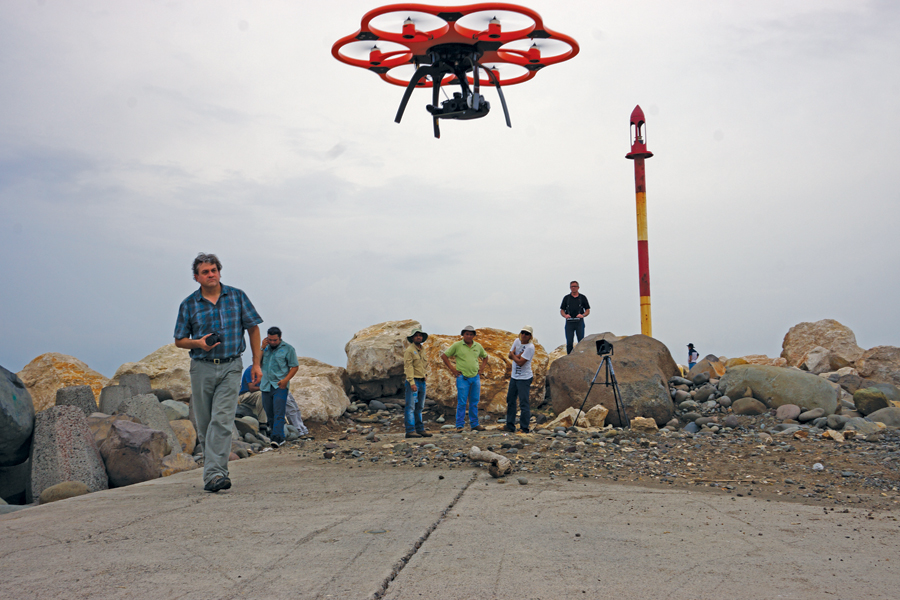
A UAS rotocopter pilot directs the successful imaging of a breakwater project in Costa Rica.
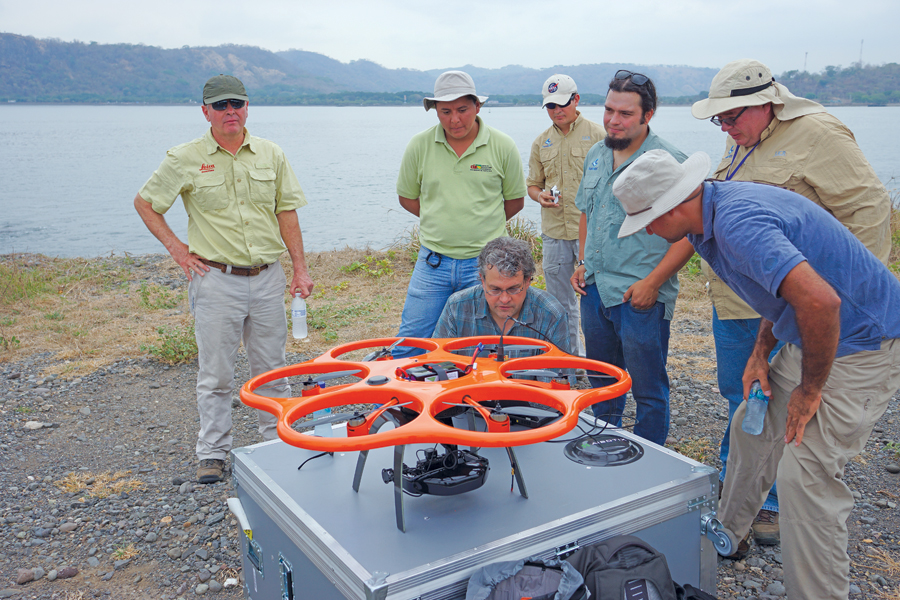
The breakwater project team reviews the flight plan for the Aibot X6 UAS.
Unmanned aircraft systems (UAS) are finding their way into geospatial applications beyond the obvious commercial topography, volumes, and inspection applications. One particular application that is poised to take advantage of the lower cost associated with UAS data acquisition is environmental conservation. Conservationists of all kinds rely on geospatial information to properly plan, execute, and monitor their efforts. Whether it is wildlife tracking or habitat management, having accurate and current maps is essential.
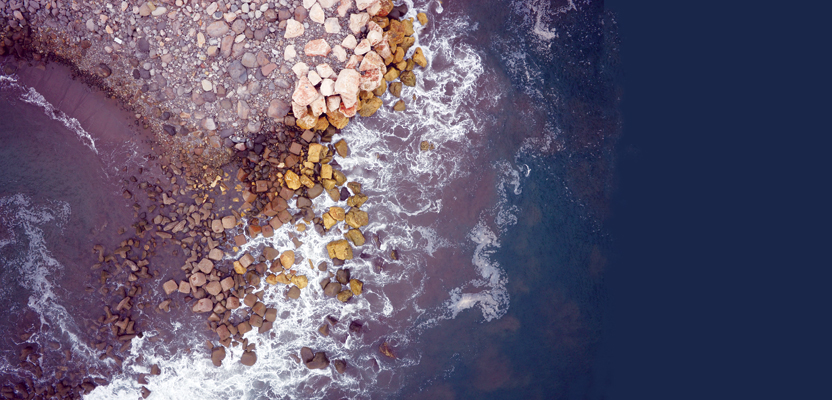
Coastal erosion is a branch of conservation that has presented itself several times now as an application that could greatly benefit from UAS. Coastal erosion has the potential to negatively affect millions of people around the world by removing the first line of defense from ocean storms.
Traditional terrestrial-based methods for data collection like RTK, total stations, and even laser scanning have limitations in either the volume of data that can be collected, the time required to collect large volumes of data, or accessibility to the desired study area. Manned aircraft photogrammetric data collection is usually accessible for only the most well funded erosion studies. UAS provides a lower-cost way to collect large volumes of highly accurate data on an ongoing basis, which is an essential component to the study of erosion.
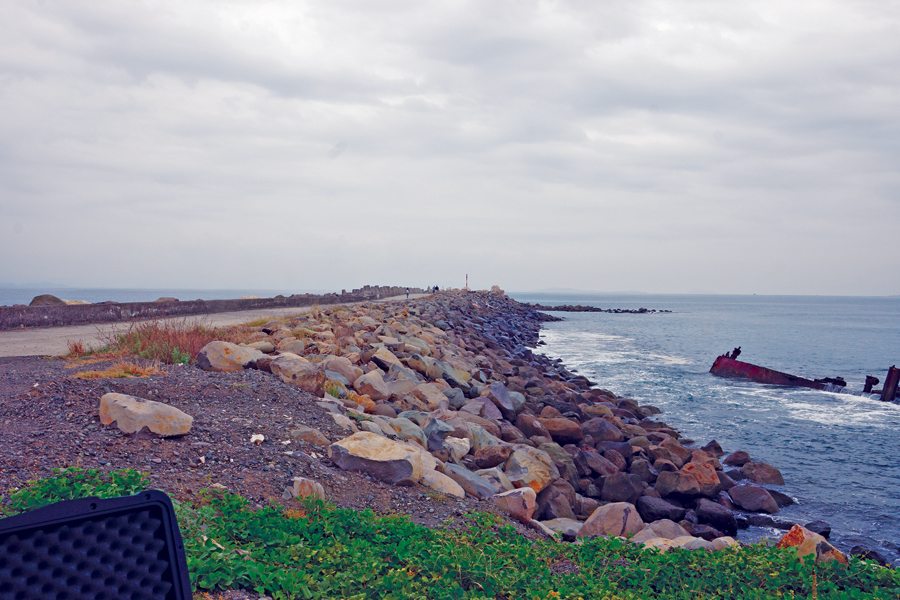
Risk included the proximity of open water as well as launch and recovery locations limited to the beach and the road along the centerline of the breakwater.
Researching a Breakwater
A small but important study has begun in Puerto Caldera, in the Puntarenas region of Costa Rica. A breakwater was constructed in a project that ran from 1976 to 1980 at the harbor entrance to protect a container ship cargo terminal from being inundated with sand carried in from the tides and to reduce the need to dredge the harbor periodically.
Over time, the breakwater has sustained damage from storms and accumulated the sand that would have collected in the harbor. The breakwater has needed repair several times, and the accumulating sand has been excavated and transported to the inner harbor beach to mitigate its erosion.
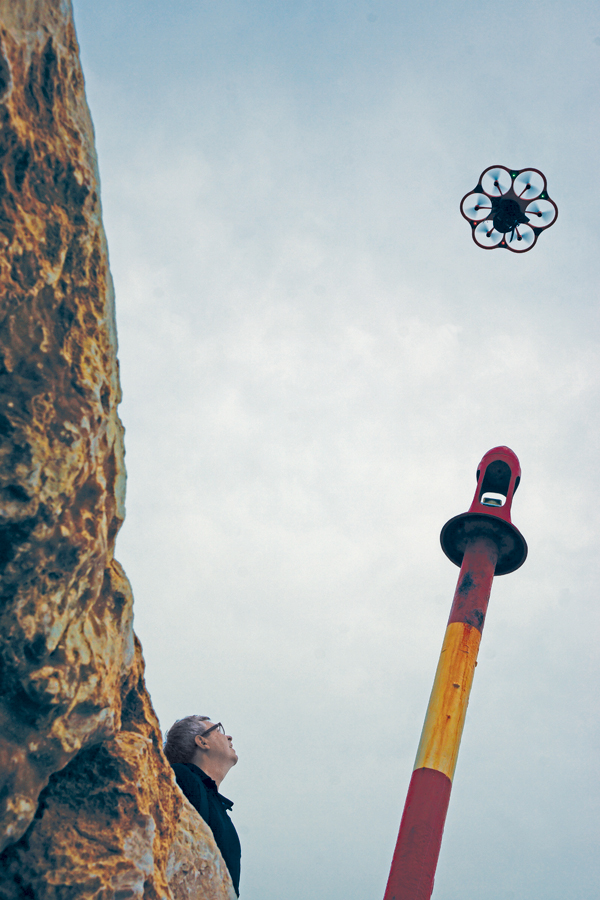
Baker observes the Aibot X6 closely as it flies a round-trip flight of almost one mile around the breakwater.
To get a better idea of how much damage was sustained, how much sand has been accumulating on the outer beach, and how much sand is eroding from the inner beach, the University of Costa Rica was asked by the Ministerio de Obras Publicas y Transportes to conduct a research project. Although it’s not of a large area, the volume of data and level of detail needed to detect the subtle changes associated with the sand accumulation made the project ideal for a UAS.
The team consisted of the project leaders and newly trained pilots from the University of Costa Rica, Kriss Myer and me from Leica Geosystems Inc., and Moviles, our Leica dealer in Costa Rica. We arrived in Puntarenas the morning of April 30, 2015. It was to be the first UAS project for the University of Costa Rica after taking delivery and receiving training on their Leica Aibot X6 aircraft.
Flying Conditions
The sky was a high overcast and the winds were mild. As any pilot knows, flying conditions are generally more favorable in the morning rather than later in the day. As the sun warms the surface of the Earth, convection currents are created, clouds build, the air is less stable, and winds and turbulence increase. For UAS, strong winds increase the risk associated with operating the aircraft due to their lightweight design and low operating speeds.
Many a rookie UAS pilot has learned the wind limitations of their aircraft the hard way, either as it sails away on a stiff 25mph wind or as it struggles to return upwind to the launch location as the batteries reach depletion. Both are consequences of poor flight planning, (i.e. pilot error). The properly trained UAS pilot measures the wind speed and direction prior to launch and monitors both during the entire flight. The experienced pilot also knows that the winds aloft are generally stronger than they are at the surface. Most importantly, the experienced pilot knows when not to fly.
Control Points
Setting the project control is always an important step for obtaining accurate photogrammetric results. In the case of UAS, setting control points is usually the most time-consuming part of the fieldwork. The number and position of the control points required is a function of accuracy requirements, project area, terrain relief, photo footprint size, and flying height.
As long as the control points are visible from the air at the time of the flight, the actual control point observations can be made before, during, or after the flight. Aircraft with higher-quality GNSS sensors (RTK) can reduce the number of control points needed due to processing software’s ability to better align the photos. In many cases, this can save more than half the number of necessary control points.
With guidance from our photogrammetric specialist, the survey crew began marking the positions of the control points. They laid out a total of 20 points, probably 6 to 8 more than necessary. (Extra points are beneficial in case one or more of the targets are too difficult to see in the photos or there is a blunder in the measurement of a control point.) During the control setting process, I began preparing the Aibot X6 hexacopter for the mission.
Preflight Prep
Preflight preparation is the most important part of any UAS mission. If you take your preflight seriously, nothing short of catastrophic equipment failure will prevent you from having a successful mission. Because there are so many details involved in preflight, it is impossible for someone to remember them all 100% of the time. For this reason, conscientious pilots use a checklist … every time.

This screen shot shows the flight plan uploaded to Aibotix AirProFlight software.
The United States Federal Aviation Agency (FAA) recognizes this importance to the extent that there is a regulation regarding the preflight process. Federal Aviation Regulation (F.A.R.) 91.103 states, “Each pilot in command shall, before beginning a flight, become familiar with all available information concerning that flight.” It then describes some of those preflight items.
Of course there are differences for UAS, but the main premise is the same. I’ve seen many projects fail because of simple things such as forgetting to remove the camera lens cap, forgetting to turn the camera on, having the camera settings incorrect, forgetting to charge the ground station (or some other) battery. More catastrophic consequences result from a bad flight plan, misjudging or a change in wind speed and or direction, collision with obstructions, and simple battery depletion.
With luck, the pilot may simply re-fly the project with enough charge in the battery. If unlucky, a pilot could return home with no data, a damaged aircraft, and a call from the FAA. It is not uncommon to spend more time on preflight activities than is actually spent in the air. A typical preflight can take between twenty and thirty minutes, not including creating the flight plan.
A risk assessment should always be a part of your preflight preparation. For this particular project, flying over or near open water added a tremendous amount of risk. The risk was so great, in fact, that I was not comfortable with the newly trained pilots performing the flight. The pilots had completed just under three hours of logged flight time; I wouldn’t recommend any pilot with less than 20 hours perform a flight this risky.
Although the aircraft would be flying autonomously via a preprogrammed flight plan, the pilot must be able to take control of the aircraft manually if something goes wrong. For this project, risk not only included the proximity of open water, but the launch and recovery locations were limited to the beach and the road along the centerline of the breakwater. Because it was high tide, the structure required a long round-trip flight of almost a mile (a half mile each way).
A pilot’s ability to determine aircraft attitude is a function of the distance of the aircraft from the pilot, the size of the aircraft, and the pilot’s vision. Even with a one-meter-diameter bright orange aircraft, it is difficult to see if the aircraft is moving toward or away from you, ascending or descending, travelling at one half of a mile. A pilot may be able to detect it if it is moving left or right. If a pilot’s vision is less than 20/20, the aircraft would most likely not be visible at all.
Taking all factors into account, I decided that it would be less risky to launch and recover the aircraft in the middle of the breakwater rather than the beach. That way, the aircraft would never be more than about 300 meters (1,000 feet) away, with the beach as an alternate landing site (always have an alternate).
After I completed the placement of the control points and the preflight, including the risk assessment, and I uploaded the flight plan, the copter was ready to launch. I double-checked the winds, the airspace, and the ground activity in the flight area. All checked okay, so I launched to an altitude of about 3 meters (10 ft).
Having verified all systems functioning, no strange noises (possibly indicating a failing motor or a damaged prop), I initiated the flight plan. The copter rose to its determined altitude of 50 meters (150 ft) as it made its way to the beginning waypoint of the first flight line. It then began its way up the first flight line at a steady 4 meter (13 ft) per second, taking a photo every two seconds. The benefit of a photo every two seconds gave us almost double the number of photos we actually needed. This is one way to back up your data in case of any blurry images from turbulence.
As the copter returned towards me (in the center of the breakwater), I monitored its flight behavior, battery life, altitude, and distance.
The copter proceeded along its path, conforming to the small excursions that were programmed to pick up the full extent of the breakwater. The copter passed overhead twice and made its way towards the beach and the end of the flight plan and the alternate landing site. Having completed the flight plan, the copter returned to its launch point and landed like a feather.
Advantages of Rotor-Based UAS
By Jeff Salmon
Fixed-wing or rotor-based UAS? The answer depends on what your projects require.
For larger aerial mapping and surveying missions, fixed-wing craft have the operational advantage in terms of overall area coverage based on their faster speeds and usually longer flight times. On the rotorcraft side (we include both helicopter and multi-rotor craft here) the advantages can be summed up in six words: “low and slow, stop and stare.”
The ability to fly slowly at low AGL heights enhances the quality and resolution of the data collected. The ability to stop and stare, that is to hover in a discrete position, expands the ability to capture larger amounts of data/imagery, often at extremely close distances. This close-in data collection leads to millimeter accuracy output, according to one manufacturer’s specs.
Additionally, rotorcraft are able to easily collect oblique imagery of structures to create 3D structure models. Maneuverability and versatility in flight operations, especially in restricted and interior spaces, add to the list of advantages of rotorcraft UAS.
Curiously, current FAA Section 333 exemptions indirectly (and temporarily) provide another reason to consider rotorcraft UAS over their fixed-wing counterparts. It has to do with the 333 exemptions’ visual line of sight (VLOS) rule. All UAS flights must be flown within VLOS of the operator/observer. This means, at least for now, that much of the advantage that fixed-wing craft have in terms of longer flight-times is negated by this rule.
While technology is being evaluated to mitigate the VLOS constraint, it may take a little while before VLOS flights are legal. Most inspection and monitoring tasks, with the notable exception of long-range run-of-length pipeline/utility monitoring ones, can easily be accomplished within the VLOS restriction using rotorcraft UAS. These applications are doable “here and now” within the FAA restrictions as opposed to “whenever they get around to those new regs.”
Rotocraft are ideal for inspection projects like this for several reasons.
The range of sensors routinely used on rotorcraft UAS run the gamut: electro optical (EO) cameras, gas detectors, thermal cameras, multispectral and hyperspectral sensors, and even lidar.
The above factors make rotorcraft UAS ideal for inspection and close-in mapping projects. Early adopter statistics back this up. A report by Drone Analyst looked at the stats for the first batch of FAA Section 333 exemptions. Inspection and monitoring category petition applications exceeded mapping and surveying ones by a large margin: 225 to 126 respectively. This makes sense considering that long range, wide area mapping and surveying won’t be in the cards until final rules are in place.
The “inspection” bucket holds a lot of market space. Applications include: Energy pipelines, power lines, flare stacks, wind turbines, and photovoltaic farms. Infrastructure examples include bridges, train rails, water and cooling towers, and more. A DOT report estimates that about 45,000 annual bridge inspections could be handled with UAS technology.
If you’re looking at acquiring a UAS—especially if you have inspection projects on your plate—multi-rotor and helicopter-style UAS deserve serious attention in your selection considerations.
Postflight
Postflight is almost as important as preflight. I ensured the aircraft didn’t sustain any damage that needed to be repaired prior to the next flight. Discovering damage in your preflight is a show-stopper.
More ground control points were captured than needed in case any targets were too difficult to see in the photos or there was a blunder in measurement of GCPs.
We downloaded and checked all the images and the position log of the images. It’s easy to determine the number of images, but it takes a few minutes to determine whether the exposure setting was optimal and whether the images are overexposed, underexposed, or blurry. To really be certain, I processed the data with a minimal level accuracy to make sure that that the photogrammetric coverage was complete.
Without processing any of the images, we could easily see that the end of the breakwater sustains the majority of damage from storms. We elected to do another flight to catch some oblique images of the end of the breakwater. This would enhance the university’s model of the breakwater and make change detection easier in future flights.
It’s a bit more difficult to create a flight plan that accommodates the camera at a 45-degree angle and captures the area of interest, so I elected to fly the copter by hand from the end of the breakwater. This decision increased the risk profile and left virtually no margin for error, as the copter would then be directly over open water at a relatively low altitude. Any equipment failure or mistake in my flying, and the copter would have fallen to its demise. Due to the risk involved in the flight, I would have preferred to limit the number of spectators. But because the project was the first of its kind, it captured a lot of attention.
The Data
With the copter safely back on the breakwater, we started inspecting the images to make sure we had everything we needed. We had enough batteries that we could have done several more flights if necessary. In the 30 minutes that we were in the air, we collected 512 photos which appeared to give us complete coverage with a sufficient level of detail for the project.
Meanwhile, the survey team finished locating the control points while we began packing up the copter and accompanying gear.
Before we left, we conducted a rough review and processed the photos to make sure there were no gaps in the flight lines, that all the photos were georeferrenced, and that the image-processing software could align the photos. Because the project site was a couple of hours from San Jose, it was 45 minutes well spent to know we would not need to return.
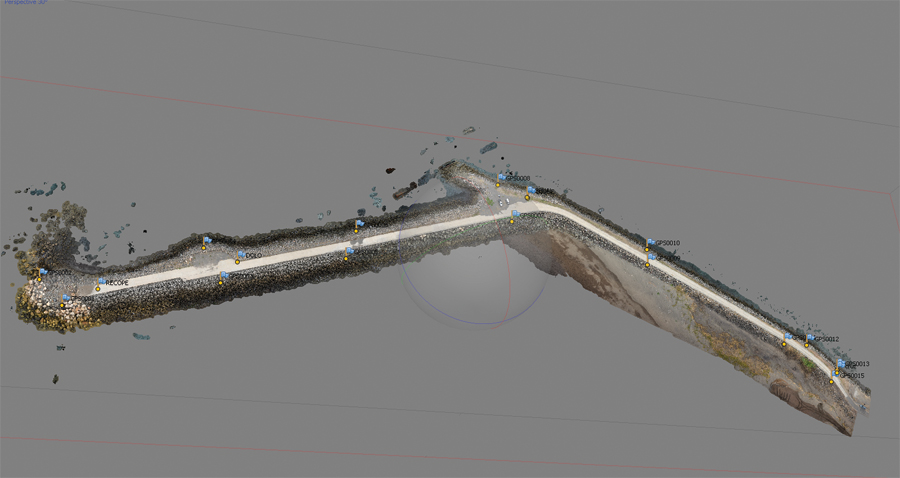
The point cloud can be used by multiple software packages and can be combined with terrestrial and mobile scanning.
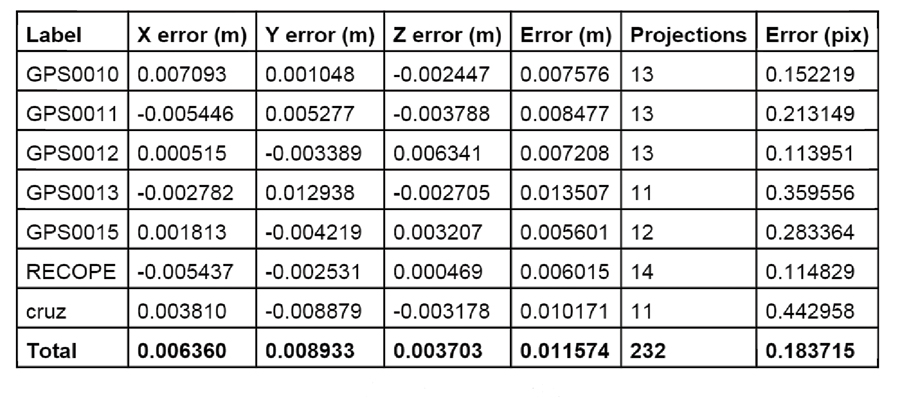
With the flying and control point part of the project completed, it was time to combine the control points with the photos. Importing the photos and control points was straight-forward. Although I assigned the coordinate values to pixels in each of the photos, the software does perform automatic point detection with special printed ground targets. Depending on the number of photos and the number of control points, this process can take 10 to 30 minutes. The image processing results showed a total error of 11 millimeters.
After assigning the control points to the photos, we let the processing software crunch the photos. Depending on the project requirements, it is possible to process several hundred thousand points (low density) in about 45 minutes to 65 million points (high density) in 10 hours.
The resulting point cloud can be utilized by multiple software packages through several industry standard formats. The aerial point clouds can also be easily combined with terrestrial and mobile scanning data to give you a complete picture that a single system cannot easily do. Having the additional benefit of the photos allows visual inspection of the structure beyond just the point cloud and the ability to more easily communicate the status to other parties.
For this project, this first data set will be a baseline from which future flights will be evaluated for the purpose of monitoring the status of the breakwater. The University of Costa Rica will conduct additional flights on the outer and inner beaches to determine sand accumulation and erosion processes and remediation results.
Projects like this abound around the world and are just one of the many applications for UAS as the technology is implemented in the geospatial community. Thanks to UAS, many applications for projects in the past that were impractical and unfeasible will be possible. In addition, better decision-making will result from better geospatial data collection methods.