Remote sensing data helps to inform ocean planning for energy development around the main Hawaiian islands.
Using remotely sensed imagery to map physical and biological patterns in the marine environment enhances our ability to understand how environmental conditions change over broad spatial scales (10s to 100s of kilometers) and temporal scales (years to decades). These maps also enable us to bridge the gap between in situ information and the marine environment and explore the effect of changing environmental conditions on the distribution of marine animals.
-
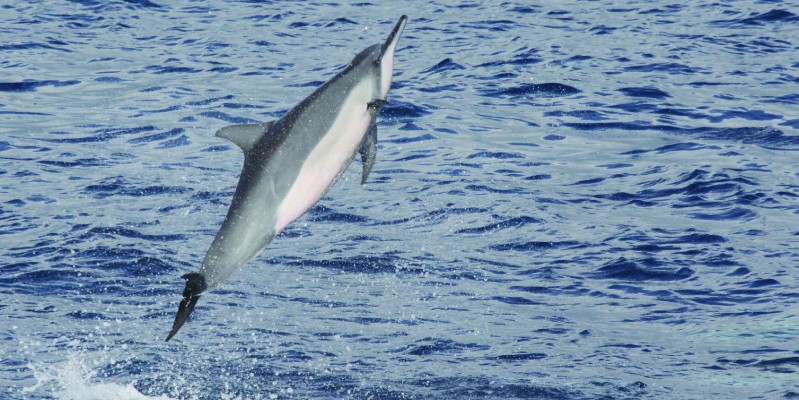
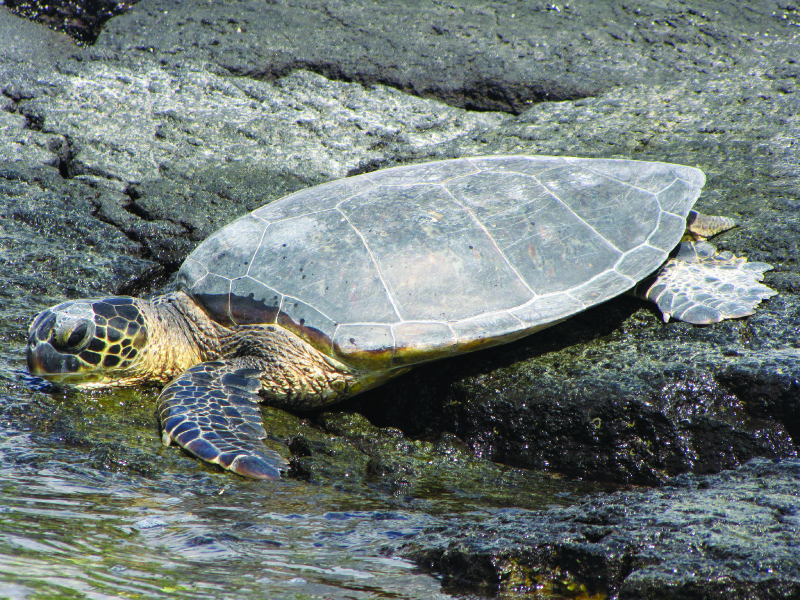
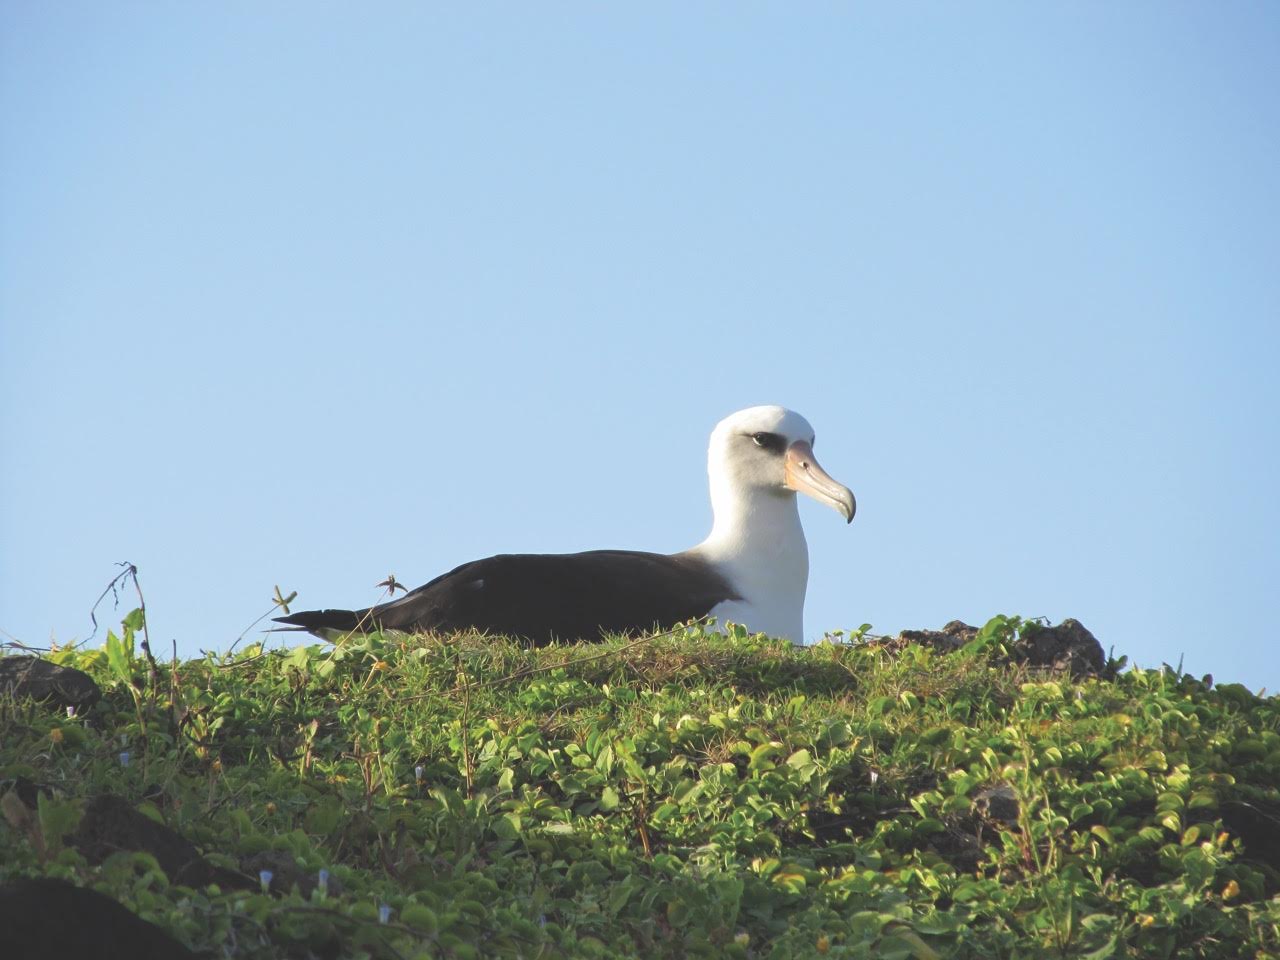
- NCCOS compiled various types of remotely sensed data to characterize the environment and map the spatial distributions of marine plants and animals around the islands. Credits: (spinner dolphin (in header)) Robin Baird, Cascadia Research Collective; (seabird) Arliss Wiaship, NOAA NCCOS; (sea turtle) Bryan Costa, NOAA NCCOS.
Studying the spatial and temporal distribution of marine animals is called marine biogeography, and understanding the marine biogeography of an area is becoming increasingly critical for marine planning efforts, including offshore renewable energy development.
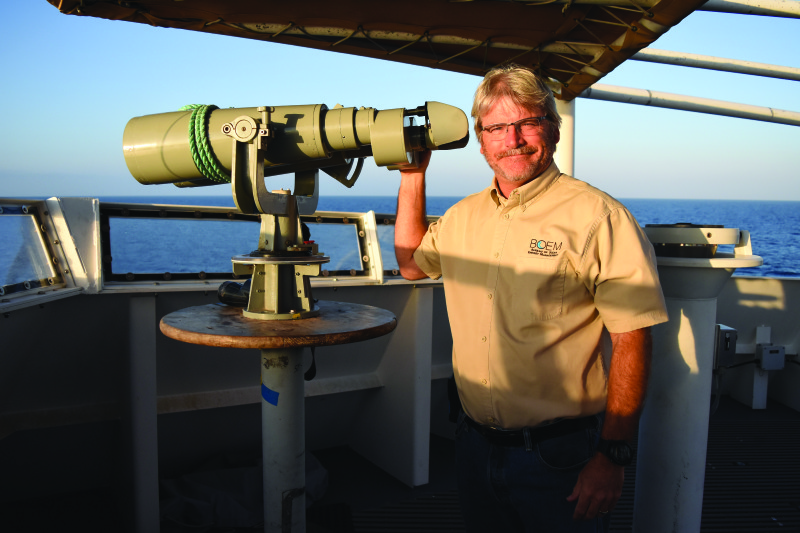
Gred Sanders, wildlife biologist
Energy in Hawai’i
Interest in offshore renewable energy development is growing around the United States, particularly in the Main Hawaiian Islands (MHI) (Figure 1). The MHI’s location in the tropical Pacific Ocean makes it rich in potential renewable energy resources, including solar and wind. At the same time, its location and isolation makes importing and generating energy from fossil fuels costly.
Given these issues, the state of Hawai’i is working to reduce its dependence on fossil fuels by developing local renewable energy sources. Most of the state’s potential renewable energy resources (notably wind) are located in federal waters. This uneven distribution of renewable energy potential makes renewable energy development likely in waters from 3 to 200 nautical miles offshore of the MHI.
-

- Bryan Costa, marine spatial ecologist

-

- Matthew Kendall, marine biologist

The Bureau of Ocean Energy Management (BOEM) regulates the leasing, construction, and operation of most renewable energy projects in federal waters. Part of this regulatory process includes assessing the potential impacts of renewable energy development on the human, marine, and coastal environments.
To prepare for these assessments, BOEM partnered with the National Oceanic and Atmospheric Administration (NOAA) National Centers for Coastal Ocean Science (NCCOS) to characterize the marine biogeography around the MHI. NCCOS compiled various types of remotely sensed data to characterize the physical and biological environment and map the spatial distributions of seafloor habitats, fishes, sea turtles, marine mammals, and seabirds around the islands. We, the authors (see above), led the NOAA team.
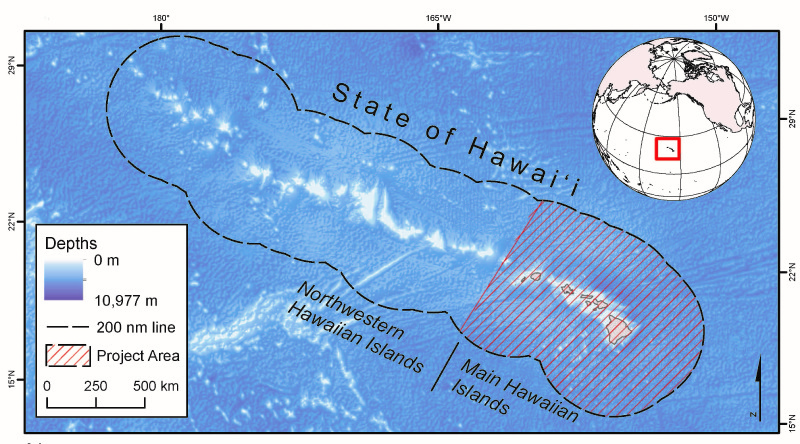
Figure 1: Map showing the location of the Hawaiian Archipelago in the Pacific Ocean, the state of Hawai’i, and the boundary of the project area and of federal waters (i.e., 200 nm line).
Sensors and Platforms
It is becoming increasingly common to have access to multiple types of imagery datasets that overlap spatially and temporally. These overlapping datasets can be integrated to leverage the benefits of different sensors and to enhance our ability to understand and map the marine environment.
In the MHI, we used multiple types of remotely sensed datasets to characterize the marine biogeography and predict the distribution of select marine animals around the MHI. These datasets came from several sensors mounted on satellites, airplanes, and ships, including multispectral, lidar, sonar, and radar.
We processed and integrated datasets from these various sensors to describe the wind, chlorophyll-a, net primary productivity, euphotic depth, turbidity, currents, mixed layer depth, eddies, fronts, upwelling, temperature, waves, seafloor depth, seafloor topography, and distance to prominent geographic features (e.g., seamounts) around the MHI.
Overlapping datasets can be integrated to leverage the benefits of different sensors.
We acquired these datasets from a variety of online sources, over several years, and at multiple spatial resolutions, and we processed and integrated them in ArcGIS, R, and Matlab software packages (Figure 2).
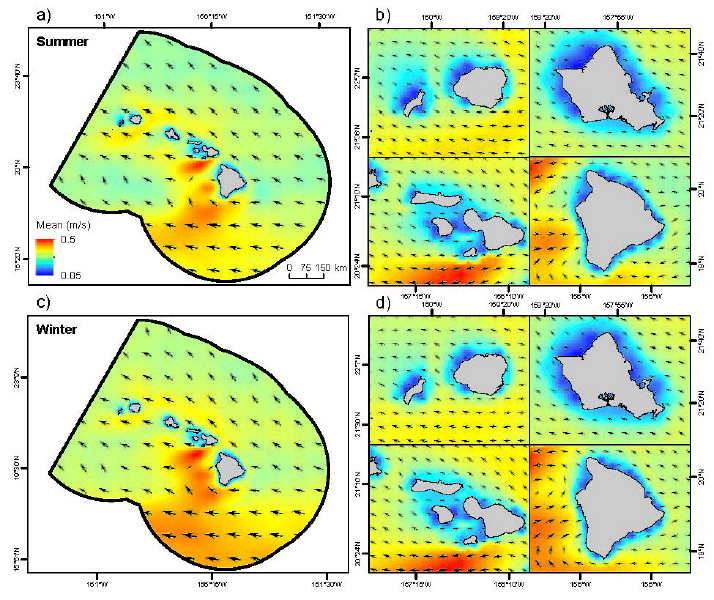
Figure 2: Maps showing the boundaries of BOEM’s proposed 4.8×4.8 km lease blocks in the MHI. (These maps are not an official record for BOEM offshore lease blocks and boundaries.)
Choosing a Framework
Because these remotely sensed datasets were so diverse, one of our main challenges during this project was to reduce them to a common spatial and temporal scale. Caution is required when rescaling remotely sensed data because using one technique versus another may lead to slightly different results and conclusions about patterning in the marine environment. In these cases, the best way forward is to directly link decisions about the methodology to the goals of the project.
Here, we chose to use 1.2×1.2 kilometer (km) subdivisions of BOEM’s 4.8×4.8 km lease blocks (Figure 3) as the primary spatial framework. We made this choice because BOEM will conduct its review of renewable energy projects within these same grid cells. We summarized datasets that had native spatial resolutions finer than 1.2×1.2 km (e.g., depth) within these grid cells and resampled datasets that had native, spatial resolutions coarser than 1.2×1.2 km (e.g., surface currents) into this spatial framework. The result of this processing was hundreds of spatially coincident raster datasets with identical spatial resolutions.
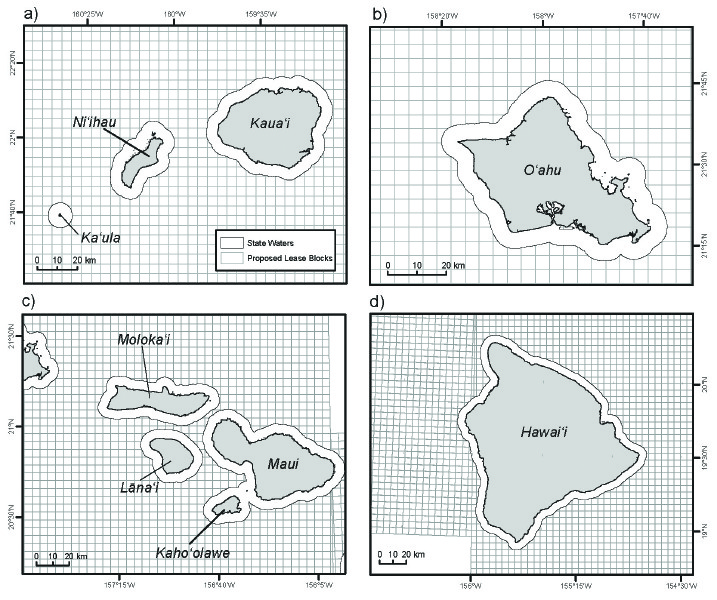
Figure 3: Example of a remotely sensed data showing the average speed (m/s) and direction (¡ denoted by arrows) of surface currents in the summer (a, b) and winter (c, d) around the MHI.
Drivers of Predictions
We used these standardized datasets as inputs to predict the distributions of deep corals, reef fish, dolphins, whales, and seabirds around the MHI. For deep corals, we found that seafloor depth, seafloor slope, and distance to shore were consistently the most important datasets in the modeling process. Similarly, we found that reef fish predictions were mainly driven by wave power, seafloor depth, seafloor slope, and distance to shore.
Depth, slope, surface current direction and the strength of temperature and chlorophyll-a fronts were found to be important for all dolphin and whale predictions.
Lastly, we found that seabird predictions were mainly influenced by seafloor depth, sea surface height, distance to shore, and distance to the nearest terrestrial seabird colony. These results suggest that the above remotely sensed variables and datasets may provide useful starting points for future studies aimed at ecological inference for select marine animals.
Interpreting Data
Remotely sensed datasets were crucial for characterizing the marine biogeography around the MHI. These datasets allowed us to better understand how atmospheric and oceanographic conditions change and how they shape the marine biogeography of the MHI. They also enabled us to better understand how marine animals respond to these changing conditions, often in different ways around the islands.
For example, some taxonomic groups and species use the same locations year round (e.g., on Penguin Bank south of O’ahu or offshore of the Kona Coast, Hawai’i), while most taxa utilize different geographic areas at different times of the year. For some taxa, this project marks the first time that their space-use patterns were mapped or modeled in the MHI and the associated data compilation made available online.
This data compilation will help inform BOEM’s process to identify and fill critical data gaps and to assess the potential direct and indirect impacts of renewable energy development on marine ecosystems. It also establishes a guide for monitoring change, a roadmap for prioritizing how to fill data gaps, and a framework for integrating ocean research and management efforts moving forward.

Figure 4: Cover of the report describing the analyses and products developed around the MHI. This report and the associated spatial datasets are freely available online.
The technical report (Figure 4), geospatial datasets, online map portal, and web-mapping services are publicly available at coastalscience.noaa.gov. These maps, databases, and analyses are one component of the larger BOEM and Hawai’i process to evaluate offshore renewable energy proposals around the MHI.