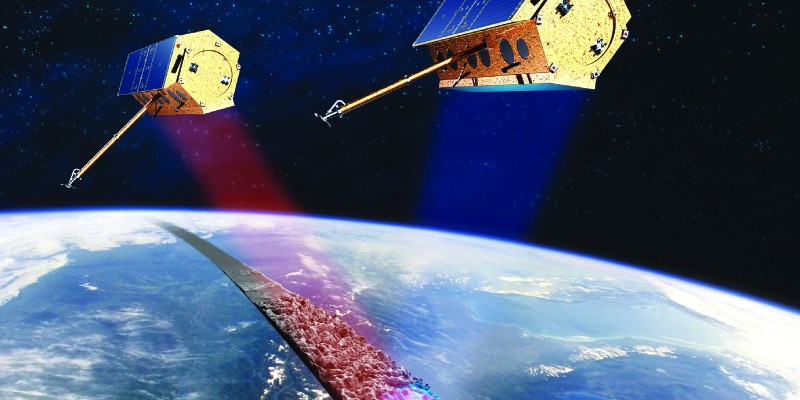
Information on the featured image for this piece
How can you monitor broad-area land deformation with high precision? Why, from space, of course.
Is it possible for satellites to accurately monitor the motion of landscapes with millimeter levels of precision? What about over wide areas while being frequently updated? If you scoffed in response to either of these questions, you might be surprised.
New applications of InSAR technology (Interferometric Synthetic Aperture Radar, a big acronym, I know) have opened the door to a new age for precision monitoring of landscapes and infrastructure.
The “SAR” portion of this acronym refers to the use of synthetic aperture radar from satellite platforms; these are active sensors that can image the Earth at high resolution by combining multiple “echoes” from a short antenna. A long antenna is “synthesized” from redundant measurements from a short one.
An analogy could be drawn between SAR and GNSS. They both involve precise ranging, but the observable signal for SAR is an echo that is returned to the satellite. The “In” stands for interferometry; two SAR images of an area (taken from the same position on different dates) are used to determine changes in phase of the ground returns. GNSS carrier phase processing also typically involves phase differencing.
Past Applications
Before an in-depth explanation on new uses, let’s consider some of the first applications of SAR and why it has been used in the past. For instance, InSAR was used in the mapping of Venus.
In May 1989, the spacecraft Magellan was launched on a mission to generate the first high-resolution imaging of Venus’ surface. SAR was chosen because of radar’s ability to “see” through the thick clouds covering Venus. The probe, after reaching the planet’s orbit and working for several years, managed to map 98% of the planet’s surface with resolutions better than 100m.
Fast forward to present day when SAR imaging has begun to be used for monitoring ground motion at an incredibly small level. How could formerly 100m resolution imaging be transformed into something much more precise in a mere 17 years? In truth, it hasn’t. Or, at least not that much (average resolutions are now around 3m-sized pixels). Instead, the technique by which the motion is interpreted has improved dramatically.
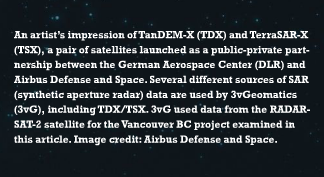
After a technologist takes a series of images of the same location, he or she uses advanced algorithms to compare the radar wave’s phase differences between neighboring pixels to determine their relative magnitude of motion and direction of movement. This technique can measure motion along the line of sight between the satellite and target (Figure 1).
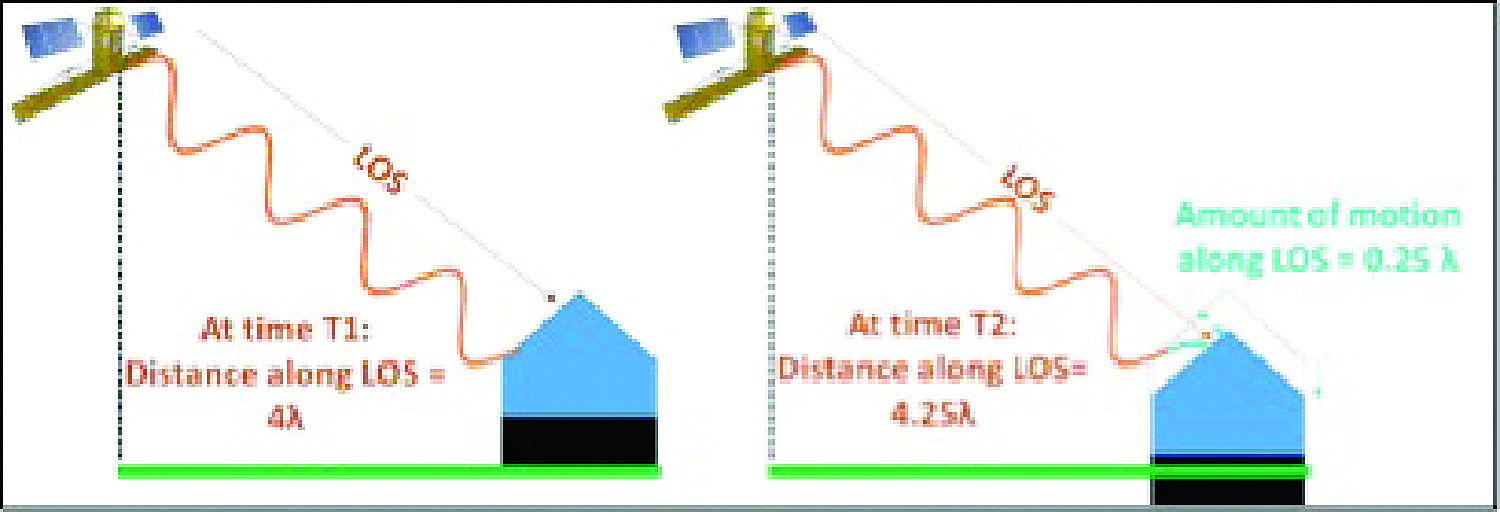
Figure 1
If opposing-look directions are available for the same target, it is also possible to resolve the motion into horizontal and vertical components. As a result, InSAR is not commonly used for detecting absolute distance, only changes in distance.
InSAR and You
InSAR is fast becoming one of those “don’t blink or you’ll miss the opportunity” topics. Its use is more prevalent than it was even a few short years ago, and it is growing rapidly.
Many elements of InSAR processing require advanced scientific education and experience; 3vG has developed many of their own processes and algorithms. To handle the heavy processing loads, 3vG employs some serious servers, including one that boasts 300+ cores
Unlike other emerging (or maturing) technologies, InSAR processing is something that a client wouldn’t ever try to tackle on his or her own; likewise you wouldn’t attempt it as a surveying consultant. But you should consider adding InSAR to your toolkit, becoming the subject-matter expert, guiding your clients through analysis, and demonstrating the unique benefits. Conventional monitoring cannot provide some benefits of InSAR, such as the “time machine” feature. Let me explain.
One of the fundamental goals of monitoring is to be able to study trends and to be able to correlate potential sources of movement: what is due to natural elements and what is not. For example, you may have had clients who need to monitor the stability of structures or utilities during periods of adjacent new construction where they may have had to dewater during construction (like the example in Figure 5). In the course of your manual deformation monitoring, how can you distinguish between movement due to construction and ongoing trends (e.g. tidal and seasonal)?
For many regions of the world, InSAR images have been collected by multiple satellites going back as many as 15 years. Your InSAR consultant can purchase the images for the site going back a few years to look for ongoing movement trends, and the results can identify areas for more intensive manual deformation monitoring activities.
Word is getting out about InSAR. Beyond mining and construction, whole cities are ordering InSAR to study ongoing trends of subsidence and slides. Monitoring is well within the wheel-house of surveying and geomatics engineering; InSAR is another tool to bring to your clients.
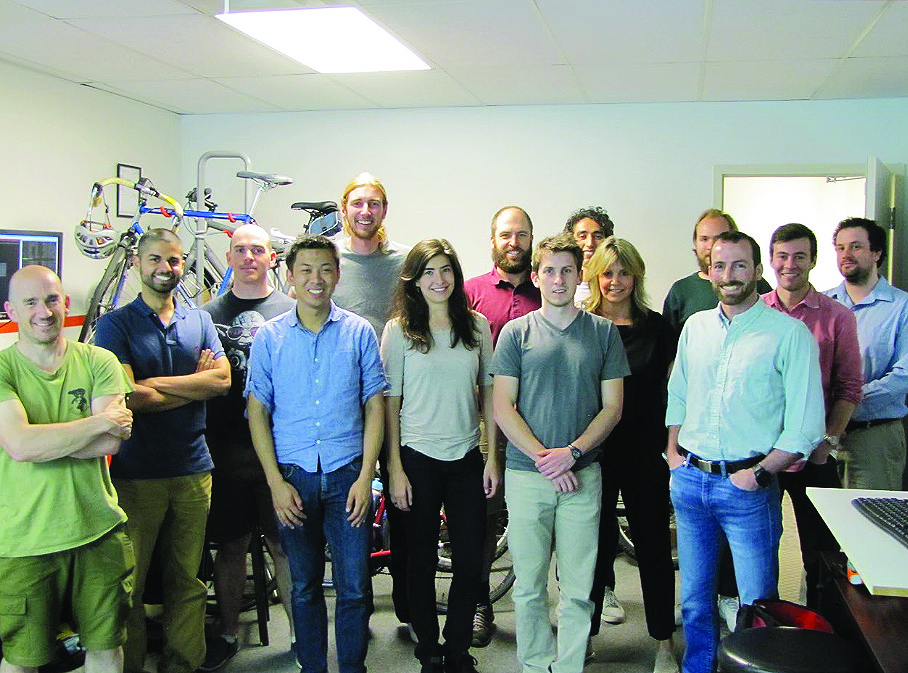
3vGeomatics has assembled a bright, young crew of scientists from all over the globe. Their office is filled with bicycles: appropriate for commuting in the cycle-friendly city of Vancouver, BC.
Current project
But enough about the history and how it works; it’s time to take a look at what projects InSAR is being used for now. The following is a case study conducted by 3vGeomatics (3vG) on the city of Vancouver, Canada, to identify and quantify areas and trends of ground motion.
Between 2008 and 2015, radar satellite data was collected and used to study an area 20km by 20km extending from North Vancouver to the middle of Richmond. In this time, 70 radar images were collected by the satellite RADARSAT2 using 2m-pixel spacing. 3vG then combined these images to make 2,415 “interferograms” through the process described earlier.
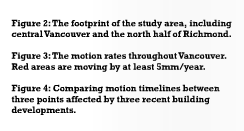 Advanced processing of the interferograms returned more than 100,000 measurements per square kilometer, and the maturity of the data stack allowed for line-of-sight measurements with a precision of 1mm per year. Figure 2 shows the study area footprint (blue outline) and a simplified representation of the microwave line of sight (white line and translucent pink beam).
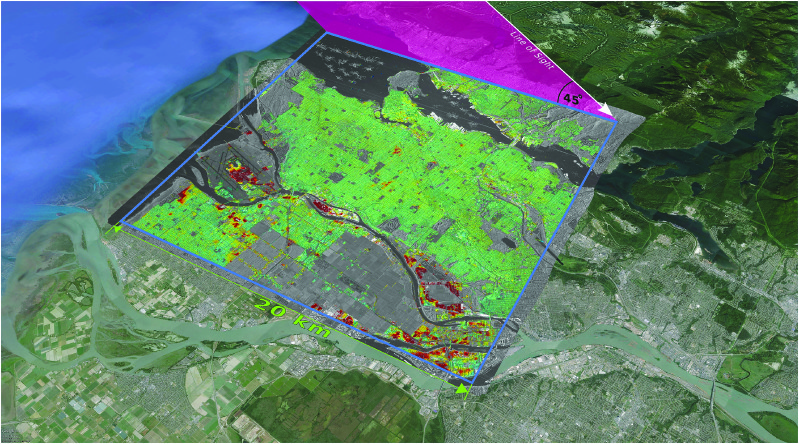
Figure 2
The processing of this dataset was tailored to suit the characteristics of an urban environment. In contrast to areas over mines or with less-developed infrastructure, urban structures act as excellent radar reflectors and give rise to more numerous and more coherent point targets. Imagine the difference between the movement of vegetation and the rigidness of buildings. Reflections gathered off of the rigid structure would obviously be able to help you determine subtler motion.

Figure 3
Figure 3 shows the study area with the motion rate color-coded from stable (green) to >5mm/year (red). The areas within the boundary that are gray are more predominantly vegetated or are changing too quickly to produce long-term permanent targets. These areas can still be monitored, but less continuously and with less precision.
Results
As seen in Figure 3, significant motion was found in many areas. The highest motion rates were measured in the area of North Fraser Way and along the skytrain on Sea Island (Vancouver Airport). Both of these areas moved at a maximum of 38mm/year during the study period. The most widespread subsidence was measured on Sea Island, Mitchell Island, and Lulu Island (Richmond), all in the Fraser River delta.
In the soft sediment of Richmond, barely above sea level, many of the motion areas are correlated with recent construction projects. These include a steady stream of condominium towers that have sprouted up, buoyed by skyrocketing real estate prices. A common saying among 3vG employees processing the Vancouver dataset is that, “The only thing moving faster than real estate prices in Richmond is Richmond.”
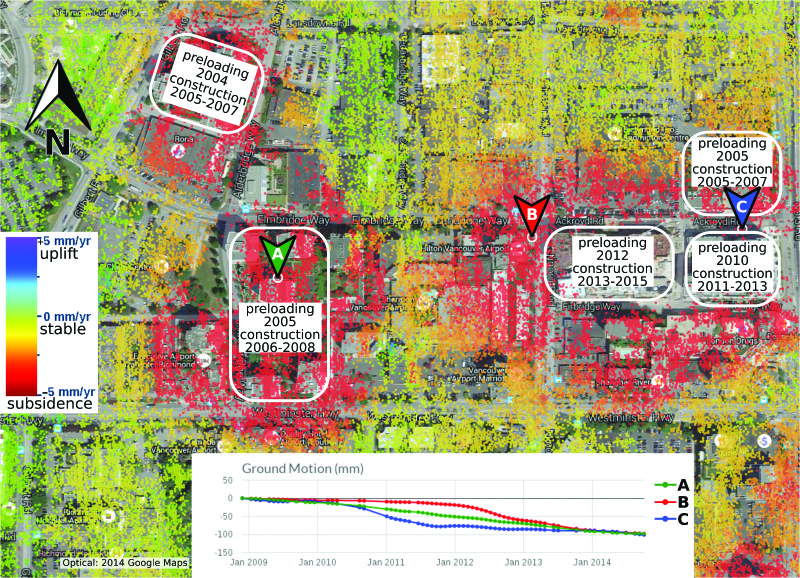
Figure 4
Figure 4 shows five nearby condo developments influencing three different motion timelines according to their location and construction date. At point A, the InSAR results show steady subsidence of 17mm/year, with subtler subsidence extending outwards over neighboring city blocks. This motion area is centered around two adjacent and contemporary condo developments, called Flo and Lotus, which completed construction in 2008 just before the beginning of the InSAR measurement period.
More interesting than the spatial correlations are the temporal correlations that appear upon closer inspection of the time series produced for each permanent target. The motion at point C accelerates in late 2010, coinciding with the preloading and the start of construction just south of that point. Later in 2012, the motion at point B accelerates just as preloading for another construction project begins between point B and the earlier project.
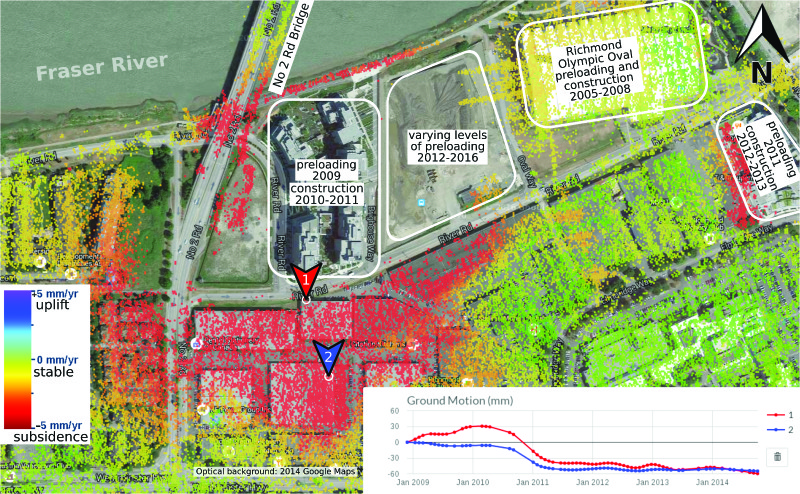
Figure5
 To the northwest of land shown in Figure 4 is a development (Figure 5) that began in 2010 near the south end of the No. 2 Road Bridge. The changing surface of construction sites restricts the coverage of long-term point targets at the center, but good target coverage was achieved immediately adjacent to the site. Coinciding with the start of construction, the point targets show an area of subsidence surrounding the site and extending 250m away, including at the south overland section of the No. 2 Road Bridge.
It is worth noting that just east of the site, the Richmond Olympic Oval remained relatively stable during this time, while neighboring structures moved, suggesting it had been built on a better foundation than other structures in the area.
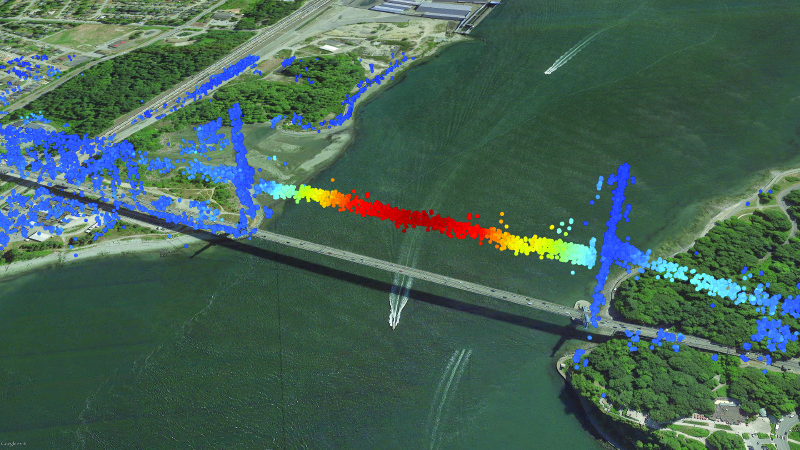
In addition to measuring land subsidence, 3vG measured thermal expansion and contraction on large structures such as Lions Gate Bridge and Second Narrows Bridge. Figure 6 shows permanent target measurements on Lions Gate Bridge color-coded according to magnitude of thermal motion. The red areas move 1.5cm per degree Celsius of temperature change. While the motion due to thermal cycles is not a concern, precise measurement allows suspicious, unexpected motion signals to be separated from normal motion.
Permanent Targets
“Permanent target” does not mean targets set by the project team or surveyors (although additional targets can be set in special circumstances), but rather hard objects that appear in consecutive processed images. The best targets are hard objects clear of obstructions or seasonal foliage; right angles help to provide distinct “scattering” of the signals. Building corners and light standards are good scatterers, whereas an open flat parking lot would not be. For areas that have few existing scatterrers, such as open fields, it is a common practice to add additional targets. Typically, these are metal reflectors that have three or more facets in a kind of open “half box.”
Areas of Application
There you have it: satellite-gathered data monitoring motion at millimeter levels of precision. This type of subtle motion detection is incredibly useful for reducing risks involving pipelines, bridges, mines, geohazard/landslides, etc. And because it is radar data, it is possible to acquire insights through clouds, day or night. Data can also be updated according to application needs from monthly updates to multi-day updates. The main drawback of InSAR is, of course, the negative effects vegetation, snow, and water have on obtaining useful measurements, along with the orientation of the satellite compared to the area under observation. Shadows and layover from buildings can occlude other infrastructure. Some of these troubles, however, can be resolved by setting up artificial targets in areas lacking naturally occurring ones.