Thermal Infrared (TIR) remote sensing technology makes existing applications more cost-effective and creates new applications, including for the environment.
News footage frequently shows a dramatic scene of a suspect hiding in the shadows on a pitch-black night. Despite the darkness, the subject glows white-hot in the video recorded from a police helicopter’s thermal infrared (TIR) imaging system. There is a definitive gotcha moment when we all feel like we’re in on the discovery of a target who thought he or she was truly hidden.
This real-time, point-and-shoot airborne surveillance is a common application of TIR imaging and has introduced the public to this technology. But, in fact, airborne TIR remote sensing has long been around as a mapping tool, and the geospatial applications of this technology continue to expand with advancements in spatial resolution and thermal resolving power.
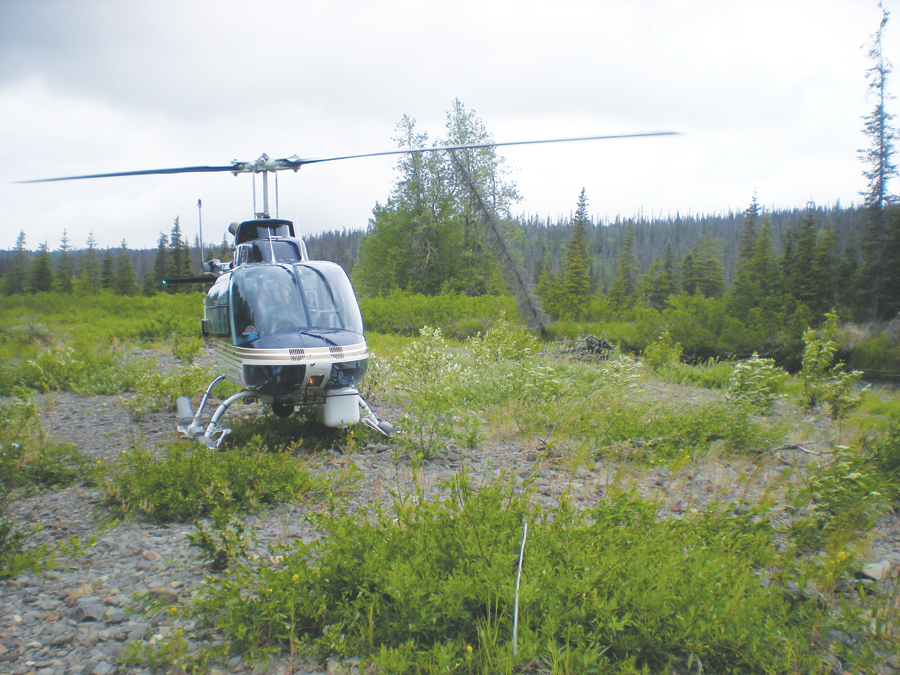
TIR helicopter platform landing by a streambed in Alaska. Data were collected by QSI for Cook Inletkeeper to understand cold water inflows and thermal refugia for fish.
A similar sense of discovery exists when using TIR remote sensing to detect and map processes that are otherwise veiled to visible sight or occur at spatial scales that are unattainable using traditional ground-based methods. TIR sensors can image a scene without visual illumination because all objects with a temperature above absolute zero emit infrared radiation. (Instruments are capable of sensing between the ranges of 3-5µm or 8-14µm wavelengths.)
The amount of emitted radiation received at the sensor is directly related to temperature. Warmer objects emit more radiation than colder objects, allowing the creation of a thermal image. By collecting imagery during times of peak thermal contrast between the object of interest and the surrounding background, the TIR images can be used to detect or map objects or processes based entirely on their relative thermal properties.
Quantum Spatial, Inc. (QSI) has been offering airborne TIR mapping services for almost two decades. In the late 1990s, QSI (formerly Watershed Sciences, Inc.) built upon research conducted at Oregon State University for airborne mapping of river temperatures in order to detect ground water discharge and to locate habitat for cold-water fishes. Other airborne TIR mapping applications conducted by QSI include locating illicit point-source environmental pollution, detecting geothermal activity, locating mine vents, quantifying residential energy efficiencies, and mapping forest fire perimeters.
The following are two examples of environmental applications of TIR remote sensing. The first is a traditional river mapping project where the client’s objective is to understand spatial temperature dynamics to better guide stream restoration efforts. The second focuses on the use of TIR technology for geothermal energy exploration and is an example of broad-area mapping and the fusion of other spatial data sources. We conclude by exploring how TIR remote sensing technology is expanding in ways that are not only making existing applications more cost–effective but are also creating entirely new applications.
Project Examples
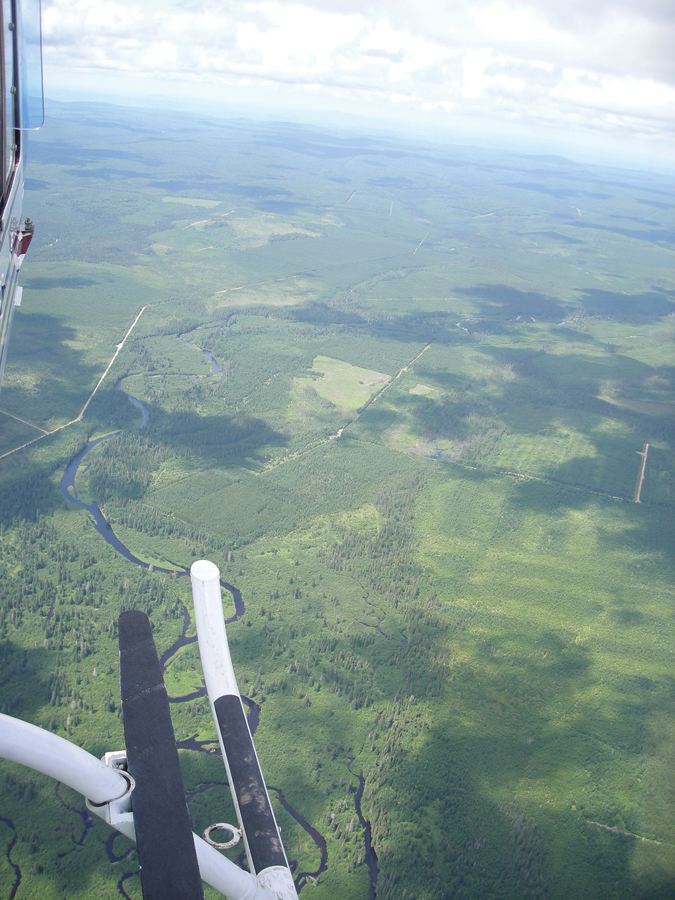
View of Mirimichi River from TIR flight conducted in 2013 in New Brunswick, Canada.
River Temperature Analysis
The goal of most river thermal mapping projects is to better understand the spatial distribution of water temperatures along the river gradient. This includes direct detection of the sources of both cold water (tributaries, cold springs, etc.) and warm water (tributaries, hot springs, illicit point sources, etc.). However, in addition to direct detection of local thermal features, image mosaics can map out broader patterns by illustrating river segments that exhibit rapid longitudinal heating and those reaches that remain cool during extreme summer temperatures.
This information can help managers determine the availability of thermal habitat for cold-water fishes like salmon and trout and identify candidate areas for both restoration and preservation. QSI has used TIR remote sensing to map rivers across North America, including Alaska and the Canadian Maritimes. A great example of this application is a 2014 TIR survey we conducted for the US Bureau of Reclamation covering 168km of the Boise River watershed in Idaho.
The Boise River TIR survey was acquired on August 30 during the mid-afternoon in order to accurately capture the greatest pressures on fish habitat, taking into consideration the peak water temperatures and low flows typical of Pacific Northwest rivers in late summer. The sensor was mounted on a helicopter flown longitudinally along the river center to collect 50cm resolution imagery with 60% forward-lap. The TIR sensor was integrated with a GPS/IMU system that allowed direct geo-referencing of the image frames. To assess the radiometric accuracy of the collected data, in-stream temperature loggers were placed at regular intervals along the river.

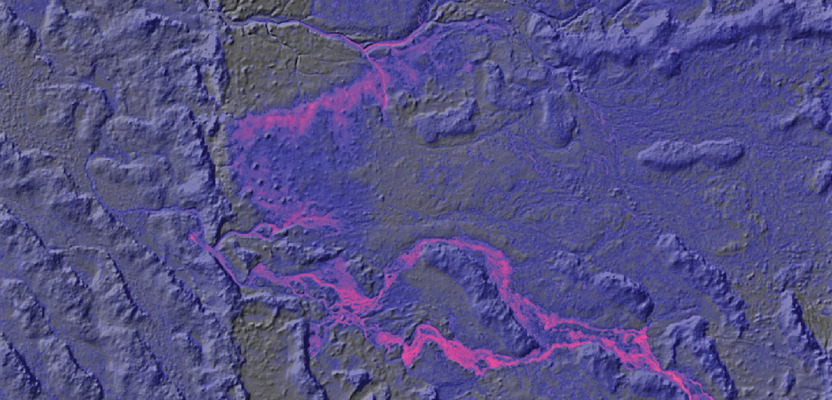
Figure 1: Calibrated TIR image mosaic of the Middle Fork Boise River, Idaho at 50 cm resolution, identifying warm-
and cold-water pockets. (Courtesy: US Bureau of Reclamation)
Once collected, the TIR images were converted from radiance values to apparent temperatures and then assessed against data from in-stream data loggers. The difference between the computed radiant temperature and the in-stream kinetic temperatures was <0.5oC for all six sampling sites.
The images were then directly geo-rectified to create a continuous image mosaic along the channel. The mosaic was analyzed to find all point source discharge to the river (i.e. tributaries and springs). In addition, radiant temperatures were sampled longitudinally along the stream channel to illustrate thermal heating/cooling patterns over the full acquisition length (Figure 1).
Products include the geo-rectified TIR mosaic and a longitudinal temperature profile including the locations of both cold- and warm-water sources. These data provide a vivid and comprehensive map of surface water temperature for the entire stream length and are instrumental in mapping suitable fish habitat across the watershed. The analytic power of these data is enhanced when combined with other data sources, such as ground surveys and detailed terrain models (Figure 2).
Geothermal Exploration
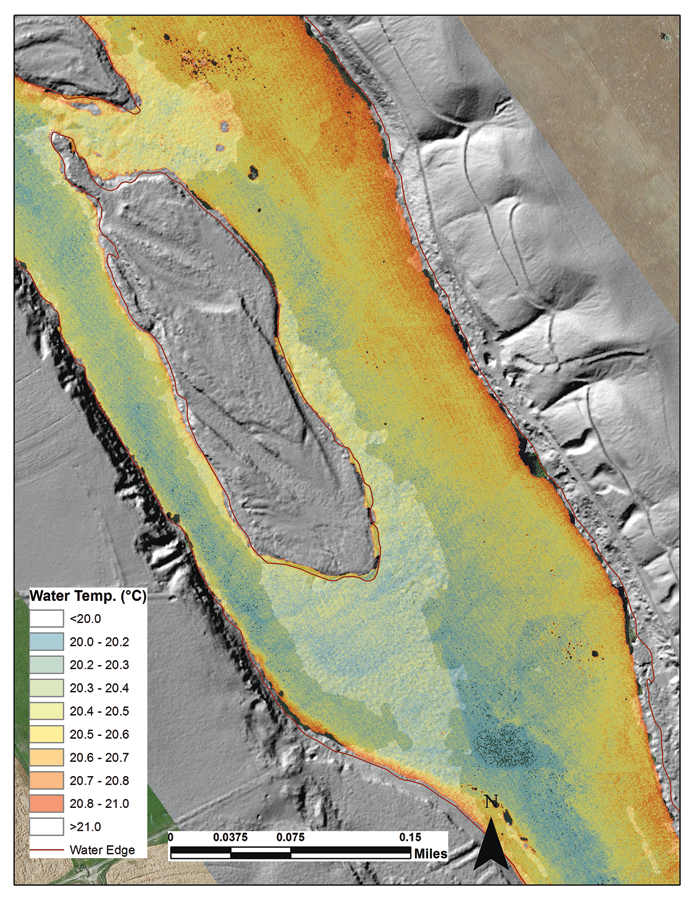
Figure 2: TIR image mosaic draped over a detailed topographic and bathymetric terrain model derived from water-penetrating lidar in the Snake River, Idaho. (Courtesy: The Freshwater Trust and Idaho Power Company).
In early spring 2012, QSI worked with the Oregon Department of Mineral Geology and Mineral Industries to map geothermal anomalies on a 30,000-acre pilot site at Summer Lake in eastern Oregon. While TIR remote sensing has been previously used for geothermal exploration, this study was designed to explore whether TIR data with high spatial resolution and high radiometric accuracy could be used for the more subtle and challenging task of identifying warm springs or ground that was only slightly warmer than background levels.
Another unique aspect of this project was that the TIR imagery was co-acquired with lidar data. The lidar-derived digital elevation model allowed spatial association of detected thermal activity (i.e., springs and surface expressions of heat) with detailed landforms such as fault lines and surface lineaments.
Flights were conducted between midnight and dawn (average air temperature = 20oC) in order to capture the greatest contrast between potential geothermal sources and the ambient temperature of the surrounding landscape. TIR imagery was captured at a native pixel resolution of 50 cm with 60% overlap and 40% side-lap with lidar data co-acquired at 5 pulses/square meter.
Surveyed air targets consisted of space blankets (very low thermal emissivity) and small catalytic heaters (Figure 3). Blankets were distributed evenly throughout the study area to measure the spatial accuracy of the data.
The survey resulted in 10,974 TIR image frames that were then ortho-rectified to create a single mosaic image. The resulting mosaic had a horizontal spatial accuracy of 0.5 m RMSE compared against 28 surveyed air targets. The TIR imagery was converted to apparent radiant temperature, and results exhibited swath-to-swath consistency errors of <0.5oC.
Follow-on analysis conducted by DOGAMI located 37 warm springs and 81 cold springs within the project area.Additionally, the lidar data did an exceptional job at locating the fault scarps as the data fusion contributed to the identification of at least one significant geothermal exploration target (multiple warm springs aligned with a Holocene fault).
Technology Advances

Figure 3: In the Summer Lake geothermal exploration project, we used a combination of space blankets (foreground) and small, catalytic heaters as ground control points.
A limiting factor to some mapping applications has been the size of the TIR detector arrays. The TIR sensor used for the example projects above had exceptional radiometric capability but a detector array of 640 x 512 pixels (3.3 MP). To achieve a high spatial resolution, therefore, we had to collect data using lower-altitude flights, resulting in increased flight time and a large number of frames. For high-resolution projects, this increased both the acquisition and processing time.
Recently, though, the efficiency of TIR remote sensing for broad-area applications has been greatly enhanced with the introduction of higher resolution sensors specifically designed for airborne applications. For example, the ITRES TABI 1800 is a push-frame sensor with a horizontal array of 1800 pixels. Similarly, the FLIR SC8300 Series sensors have pixel arrays up to 1344 x 784 pixels. These sensors can increase data collection efficiency twofold over previous-generation systems.
Increased data collection efficiency naturally translates to lower costs. QSI has conducted TIR imaging projects to assess heat loss in urban residential areas and to assess the energy efficiency of military infrastructure. These projects required high-resolution data (e.g. <30 cm) in order to correctly pinpoint the source of heat loss (Figure 4). Because many TIR surveys are sensitive to changing conditions (solar heating etc.), the increased efficiency greatly enhances the ability to collect larger areas within a specific time window of environmental conditions.
These technological advances have important practical implications. Airborne TIR remote sensing of this type can assist professional surveyors and engineers in inspecting infrastructure in both urban and industrial settings. The detection of thermal discrepancies can help precisely locate infrastructure failures and help estimate their impact. Such failures can include leaks from pipes, irrigation canals, storage tanks, or sewer systems.
Early detection of these incidents can improve response time and focus maintenance efforts. Mapping areas of heat loss due to poor insulation, exposed vents, or other inefficiencies can guide corrective actions that can have significant long-term cost savings.
Warm Up the Drones
Another interesting development is the rapid introduction of small unmanned air systems (sUAS) into the commercial market. The sUAS market continues to drive the need for smaller, lightweight imaging sensors, and TIR imaging is no exception. For example, the Tau 2 sensor designed by FLIR, Inc. specifically for sUAS platforms is only 1.75 inches long and has a radiometric capability such that collected data can be saved as temperature values rather than simply relative differences in emitted energy.
An sUAS equipped with a miniaturized TIR sensor and flown at 400ft above ground level (the current legal maximum for commercial drones) can collect imagery at about 12cm ground sample distance (GSD). The imagery can be displayed real-time but is also collected as calibrated digital frames for geo-rectification and ingestion into a CAD or GIS package.
We recently planned an sUAS flight over a project site of 200 acres that would produce approximately 2,000 frames. At one time, this number of frames, collected without precise knowledge of the aircraft location or attitude, would have been problematic. However, the relatively recent introduction of software packages such as Agisoft PhotoScan allow rapid geo-rectification of images based on feature mapping across photos and automatic solving for the camera’s internal (i.e. optical) or external orientation (i.e. location or attitude) parameters.
The spatial accuracy of the resulting image mosaic depends on several factors. The relative accuracy (i.e. frame-to-frame) can be amazingly good if collected correctly. However, we have found that surveyed ground control points (GCPs) are still required to ensure and quantify the absolute accuracy of the resulting data products. The required number and distribution of GCPs depend on the accuracy specifications of the individual project. In general, five or more well-distributed GCPs are needed for a typical sUAS mapping area (100-200 acres). It’s important to remember that, in this case, the GCPs must be identifiable in the TIR imagery, which means the target must have different emissivity properties than the background.
We are actively evaluating the quality and sensitivity of sUAS-based thermal sensors for various applications. Their introduction to the commercial market has the potential to provide affordable access to very high-resolution, geo-rectified thermal imagery at local spatial scales. Applications can include precision agriculture, detection of ground water discharge, identification of underground heat pipes, or analysis of heat losses for industrial buildings or electric utilities.
Advances in airborne TIR remote sensing could not come at a better time. The improved technology is concurrent with an increasing demand for more precise geospatial data. The simultaneous need for improved efficiencies in areas such as environmental analysis and energy efficiency, coupled with the ability to rapidly acquire and process high-resolution data, can open new markets for survey and mapping professionals.
As with any mapping application, the intended use of the data will drive the required spatial resolution, thermal sensitivity, and spatial accuracy. Project design must additionally consider the appropriate timing of the data collection to maximize thermal contrast and increase the probability of detecting the object or process of interest. Overall, the potential of TIR remote sensing continues to grow as acquisition and processing tools become more sophisticated and efficient.