A new app standardizes workflow by turning a list of surveyed points into underground 3D utility maps.
Imagine that you’re surveying an underground waterline in your city.
You use your survey devices to record the locations of the pipe system, including the manholes, the water valves, and their depths. Using your tablet on-site, you’re able to assign contextual and geographical labels to these object points, auto-compute their underground elevations, and connect the dots to create pipe networks. Then, you simply send a geospatial data file to your GIS team. They use it “out of the box” because they don’t need to interpret field notes. For surveyors who perform public utility surveys traditionally, this scenario is a dream.
Thus, the good news is that this workflow is available today.
Public Utility Surveys
Most residences, offices, and facilities are connected to public infrastructure such as water lines, sewage, electricity, phone lines, gas, and, increasingly, internet services. Utility surveying is required for the operation, safety,and maintenance of these pubic services. Most are deemed essential because th elimination of one or more would endanger lives, personal safety, or health of a population.
City planners and utility companies want to know the locations and network of existing water lines to ensure that people are well-served presently and for the future. Construction crews want to know where the gas lines are so that they can dig without endangering themselves and cause damage. Maintenance crews want to know where to repair leaks so that they can fix them promptly and resume service to their customers.
A new app standardizes workflow by turning a list of surveyed points into underground 3D utility maps.
In an ideal world, the locations of public infrastructure lines could be found by referencing the original design plans. Yet, in most field construction and operation applications, the as-built conditions rarely match design. The field crews might have responded to unforeseen site conditions, and they could have built minor field variations to compensate. Perhaps the engineering design was slightly flawed, but the field crews made changes that reflected the design intent. Or else errors were made, but the cost and delay to fix minor mistakes weren’t worth the trouble and didn’t endanger the public.
Compounding the prob- lem is that documentation of as-built conditions is rarely the priority. Crews are under a time crunch to meet dead- lines, and the documentation of as-built conditions is a pa- per-based, time-consuming process. Thus, details may be insufficiently recorded, and it is very likely that the original construction plans may be lost. Furthermore, as-built utility drawings have continual changes due to new construction and maintenance. Thus, land surveyors are hired to help pubic utilities update the locations of their as-built networks for asset management.
Applying the technology!
Utility Surveys Are a Pain
Despite the importance of public utility surveying and the need for the most updated information, traditional methods are very time-consuming and laborious to perform. The survey of underground utility networks can be error-prone, manual, and archaic, even with modern survey equipment. Underground structures are not easily captured due to safety and difficulty of access, plus there is more information to record.
In a typical land survey, the actual object of interest is captured through a direct measurement, whether that is a laser point or a prism/GNSS pole touching the object. As a result, land surveyors often need only to import points and simple lines into CAD, which can make for a simpler process.
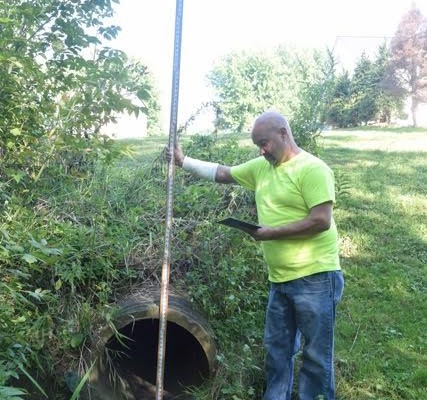
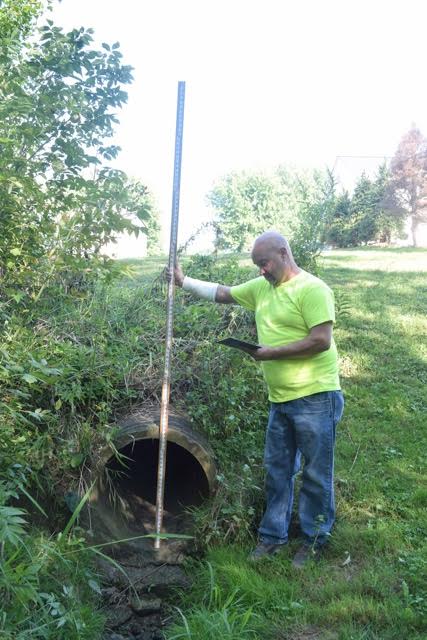
By contrast, underground utility surveys are more complex. There may or may not be direct measurements of points, and each structure-point requires object-attribute data that’s needed for underground utilities (diameter, type, material, shape, width, height, etc.). Typically, surface measurements of the rim and rim elevation of a manhole are captured. Then, the manhole is opened, and a surveyor measures and takes written field notes of all the pipes and their characteristics. This isn’t a conveni- ent or reliable way to record information.
Matthew Miley, PS, GISP, is the founder of Ohio-based GeoNet Labs, and he started his software company stemming from his own frustrations and experiences in the field and office. They develop Survey to Network, a mobile app that enables a user to streamline the process of turning a list of surveyed points into underground 3D utility maps.
“[I was] the guy in the field recording the information into a field book with handwritten notes,” saus Miley. “I was [also] the guy in the office using CAD and GIS, having to interpret the field guy’s handwritten notes.”
Miley says that there are a couple of key issues as to why underground utility surveys are error-prone. The problems begin in how a structure is recorded in the field. After a measurement is made, “land surveyors write down the point number that locates the rim and rim elevation of a manhole in their field notes. Then it’s basically a “free for all” for how they describe what they observe after they open the manhole and measure all the pipes that flow within it.”
There is no standardized workflow to do utility surveys. Each crew has its own method of recording site information, and the inefficiency in workflow emerges during the trans- fer of survey data from the field crews to the GIS/CAD office teams.
Richard Reid, Jr., PLS, from Lighthouse Land Surveying, frequently performs utility surveys and is a user of GeoNet Labs. In the “old” way, Reid would enter a survey point into CAD one at a time. He would open his field notes and search for the information to assign the point, such as the pipe diameter. Since the survey point was for the surface, he would search his field notes for the underground sump depth of the sewer pipe. Reid would manually recompute the sump elevation by calculator. Then, he would repeat this process for other points and create a pipe network.
While this task is sufficient for a few points, Reid had up to 300 structures for a single survey, which his CAD team entered and re-computed one by one for a pipe network. “There’s more chance for error because human interaction is required,” says Reid. Miscalculation and missing a decimal point is extremely serious due to liability.
Embracing a Simple Workflow
Miley says that GeoNet Lab’s solution is to standardize the workflow in the field to ensure that the collected data is complete, organized, and of high quality. This way, the office team can focus on GIS/CAD functions and not on manual data entry. In addition, their Survey to Network software is installed on a Microsoft Windows tablet, which enables mobile reporting and ensures compatibility with typical land survey devices.
To begin, a list of underground utility survey points is imported into the program. These survey points come from any source: total stations, GPS collectors, or GIS. Pre-defined survey codes (such as “MH” for “manhole”) group points together. The horizontal and vertical coordinate systems are defined.
While in the field, each manhole and its depth underground is measured and entered into the program. All the structures/pipes that flow within the structure are recorded. Each pipe’s diameter, material, and depth (if it differs from the bottom of the manhole) are chosen from a standardized menu to make data entry simple.
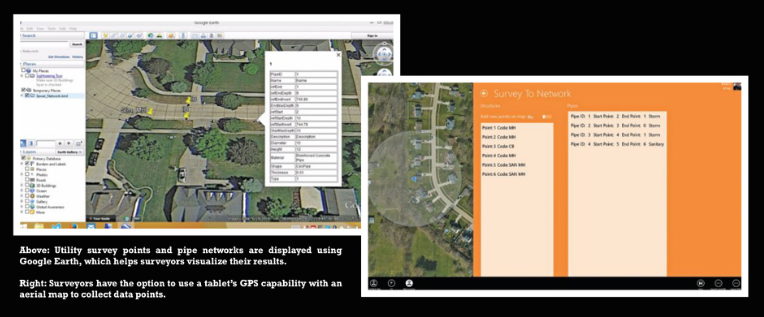
The structure’s (underground) sump elevation is computed automatically with each depth entry. Within this workflow, other structures can be selected to connect with, in order to create a pipe and to record its flow direction. Throughout this process, these survey points can be viewed on top of aerial imagery from a source such as Google Earth or Bing Maps for additional contextual information. Finally, the pipe network is exported in a standardized file format for direct import into CAD or GIS software as a 3D pipe network.
In another scenario, if the source aerial imagery is accurate, of high resolution, and available, the surveyor can use a tablet and its GPS positioning to perform the utility survey in the field. Structures such as manholes can be selected on the aerial map as a means to capture survey points.
Given the importance of underground public utilities, population growth, and an aging infrastructure, the demand for utility surveys will increase, and it will be more important that they are delivered more efficiently. In addition, the ease and automation can help survey businesses, such as in Richard Reid’s case.
“The great thing about [the app] is that it’s scalable,” says Reid. “It can fit into any workflow.” Three hundred utility structures used to take a week for his team to process. Now, one week of work has been reduced to minutes because the number of manual steps is reduced by up to 75%.
“The little guy, like me, can stay competitive with the big guys,” says Reid. “We try to embrace technology as much as we can. It makes such an impact on a day-to-day basis.”