
A consortium demonstrates the value of integrated remote-sensing technologies for studying and monitoring the impacts of climate change using the northern range of Yellowstone National Park as a testing area.
By Dr. Olaf Niemann,
Dr. Robert Crabtree,
and David Brown
In 2014, a consortium between environmental scientists and an airborne remote-sensing company was awarded funding from the National Science Foundation (NSF) for a research project to demonstrate the value of integrated remote sensing technologies for studying and monitoring the impacts of climate change.
This project was designed to build on concepts put forward by the NSF-funded National Ecological Observatory Network (NEON). NEON’s structure enables collaboration among hundreds of scientists and engineers through a single data portal. This networked technology and access to high- quality information enables long-term and nationwide monitoring of climate and human impacts on ecosystem processes and services, leading to improved natural-resource management and human well-being.
NEON consists of many assets, field protocols, and sensors, including the aerial observation platform (AOP). The AOP is a multi-sensor design consisting of a hyperspectral imaging system, discrete and full waveform lidar, and high-resolution red green blue (RGB) camera. The position and orientation of each sensor is enabled through the use of an inertial navigation system (INS) consisting of a GPS and inertial measurement unit. This integrated sensor system provides the capacity to georeference and co-register lidar, hyperspectral, and digital RGB imagery. The AOP has the capacity to collect high-resolution hyperspectral data at a spatial resolution of 1-3m.

The project data may lead to improved natural-resource management in lands such as The Grand Canyon in Yellowstone, pictured here.
Credit: Karen Peacock
Project Goals
Working with NEON experts, the project team was led by personnel at the Yellowstone Ecological Research Center (YERC). Other participants included the Centre of Applied Remote Sensing Modeling and Simulation (CARMS), University of Victoria’s Hyperspectral-LiDAR Research Group, and Terra Remote Sensing (Terra).
The overarching goal of this study is to demonstrate the functionality for future NEON AOP programs to support collaborative efforts among scientists and end-users within the public and private sectors.
One project goal is to streamline high-quality AOP, or AOP-like, data into automated processing and analysis chains. Analysis-chain outputs will inform decision-making and ultimately lessen our ecological impact and improve our environment.
A further objective of the project is to form a National Ecologic Assessment Team (NEAT). This collaborative team of end-users from the public and private sectors will develop data products so that they can be used by researchers and clients who are not sophisticated users of remotely sensed data.
Study Scope
Two advanced case studies were proposed using AOP-like sensor systems: (1) an extensive time series of hyperspectral data at approximately 5m pixel resolution to precisely quantify changes in stream, wetland, and floodplain habitat characteristics, and (2) creation of detailed 3D metrics of forests for monitoring growth and predicting future land-use and climate scenarios of individual tree species.
The selected project area was the Northern Range in Yellowstone National Park, one of 20 core sites selected by NSF’s NEON monitoring and research program. YERC has a long history of developing remote-sensing data products and models for applied ecological sciences. In Yellowstone National Park they have assimilated data sets from NASA, DoD, and private sectors since 1993.
The research and development team on the project consisted of Steven Jay and Dr. Robert Crabtree of YERC, Dr. Olaf Niemann at the University of Victoria, and the data-collection and processing resources of Terra and CARMS.
Data Collection
The first phase was the collection of AOP-like data. At the time of the project, the AOP was under testing and development; therefore, Terra was contracted to acquire AOP-like data with their similarly configured platform.
Terra’s acquisition system consisted of a Specim visible, near-infrared and shortwave infrared hyperspectral imaging system, a full-waveform Riegl LMS-Q780 lidar scanner, and RGB cameras. The data were collected simultaneously and integrated using data from the onboard INS.
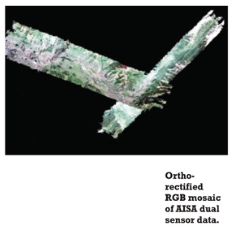
Terra works closely with CARMS, which operates at the University of Victoria in Victoria, BC. CARMS operates the Specim AISA dual hyperspectral system that collects reflected visible, near infrared, and short-wave infrared electromagnetic radiation. The Terra/CARMS team has completed a range of remote sensing projects cumulatively representing over 10,000 km2 of AOP-like multi-sensor data for a variety of projects and end-users.
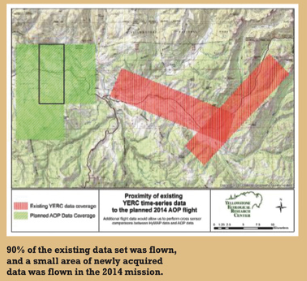
The project was flown in early July of 2014 in challenging mountainous conditions in Yellowstone National Park. The date was chosen to capture peak-green conditions in the vegetation canopy. This condition is preferable as it represents the period of the strongest, most consistent biophysical response to incoming solar radiation.
A total of 199.62 km2 was covered on this mission. Three areas of interest (AOI) were planned; two of the AOIs were coincident with historical hyperspectral imagery, and the other AOI was in an area planned for new AOP coverage. Flight height was approximately 1500m above ground level to retain 2m spatial resolution for hyperspectral imagery. The spectral range was between 400-2500nm with 492 discrete channels. The visible near infrared (VNIR) resolution is ~2.5 nm and the short wave infrared (SWIR) is ~6.0nm.
Geospatial data for the project were projected into UTM Zone 12 North coordinates, horizontally referenced to NAD83 (2011) Epoch 2010 and vertically referenced to NAVD88, Geoid12A. The vertical accuracy requirement for the lidar data was 15cm as measured on hard surfaces. Calibration flights were conducted at Bozeman Yellowstone International Airport.
These flights were performed immediately before and after the completion of the project acquisition and consisted of two overlapping and opposing flight lines along the runway and two perpendicular in relation to the runway. The purpose of the calibration is to evaluate and confirm the spatial accuracy of each sensor, which includes an estimation of sensor specific angular orientation (roll, pitch, and yaw bias).
Lidar data were collected with a nominal point density of 4 points/m2. The resolution of the digital orthophotography was 20cm. Lidar data were processed to produce digital surface models (DSM), digital elevation models (DEM), and canopy height models (CHM).
The CHM is a height-normalized elevation model. All model elevations are referenced to height above local ground elevation. This enables the user to perform direct comparison between individual trees heights, as well as investigate the vertical and horizontal vegetation structure without the influence of change in ground elevations. Canopy height normalized lidar points were organized to reflect metrics related to canopy architecture/profiles (high-resolution spatial data of canopy height/density).
Preparing to Analyze
Following processing of the lidar data, the spatially and spectrally calibrated hyperspectral imagery was orthorectified to position the imagery accurately within geographic space as well as to remove the effects of vertical displacement. In this instance the DSM was used as an input into the orthorectification process. This allowed us to account for height changes introduced by the features that are superimposed on to the ground surface. If the DEM was used as a reference, then vertical displacement caused by these features (vegetation buildings, etc.) would not be accounted for in the correction.
The fusion of hyperspectral data and lidar allows the analyst to introduce the concept of both form and functioning into the analysis. This allows, for example, stratification of the selected pixels of a given object. This object can now be defined by form rather than relying entirely on the radiant energy returned from the surface. The result is a more accurate and nuanced analysis.
Use of the lidar CHM data achieved two objectives. The first was, as mentioned above, to describe a spatially contiguous surface highlighting the vertical and horizontal distribution of vegetation structure across the landscape.
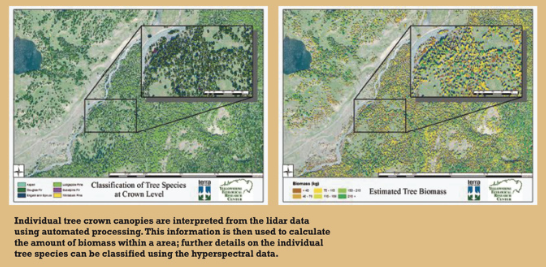
The second was to locate individual tree tops and spatially define the visible portions of the associated tree crowns. These tree crowns were then exported as spatially referenced vector files, which were subsequently used to sample the hyperspectral data and lidar CHM point cloud. The resulting file was exported as a spatially referenced spreadsheet that was used for subsequent analysis.
The advantage to this approach is the isolation of reflectance within an individual crown-object and focus of attention on the areas with the highest signal-noise, thereby reducing error and increasing, for example, classification accuracy. It also allows focus on analyzing the spectra with the consistent subtle reflectance characteristics, which is important in detecting early onset of disease or stress.
Modeling
Once the crown-objects were identified and classified into species, they could be set up in a database that could be used for further analysis and modeling. One of the initial models that was applied was to predict aboveground biomass, which is an essential step in the modeling of carbon sequestration.
In this case, allometric relationships were used that describe the growth-form relationships of organisms. For forests, and especially conifer forests, there is a well-established link between the height of the tree and the stem diameter (diameter at breast height or DBH). Similarly, there have been published studies on the link between the DBH and above-ground biomass for specific species.
So, the study relied on allometric relationships of tree height and DBH to establish a species specific DBH for each stem based on the recorded height of each crown. Published DBH-biomass relationships were then used to extend this model to the individual crowns.
Keep in mind that this analysis is carried out entirely within a spreadsheet environment. This allows implementing relatively simple R-scripts to perform the analysis and modeling. As the spatial referencing and links to the vectorized crown-objects are retained, the mapping of the analytical results in a GIS environment is a simple task.
Future Data Uses
What is next? The initial data collection and processing have been completed. The next phase of the project involves relating the the 2014 dataset to several years of legacy data that has been assimilated by YERC.
Hyperspectral data from the HyMAP sensor was collected in 1999, 2003, 2006 and 2010 (3-5m resolution) lidar flights were performed in 2003 and 2007. From the NEAT team of end users to convert data to actionable intelligence.
If budgets allow, this information will be used in tandem with planned and future AOP flights to create a hyperspectral-lidar data time series spanning multiple decades, the value of which cannot be understated.
The technology to collect hyperspectral data has been around for decades. The processing power required to process and classify these immense datasets into meaningful information is now economically feasible. It is anticipated that there could be a similar growth curve for hyperspectral technology as has occurred with lidar.