It’s after sunset in Brooklyn, New York. As I open my apartment window, suddenly I sense a strong, ocean aroma. I look outside and am shocked to see a deep surge of seawater flowing up the street quickly from a nearby boat marina.
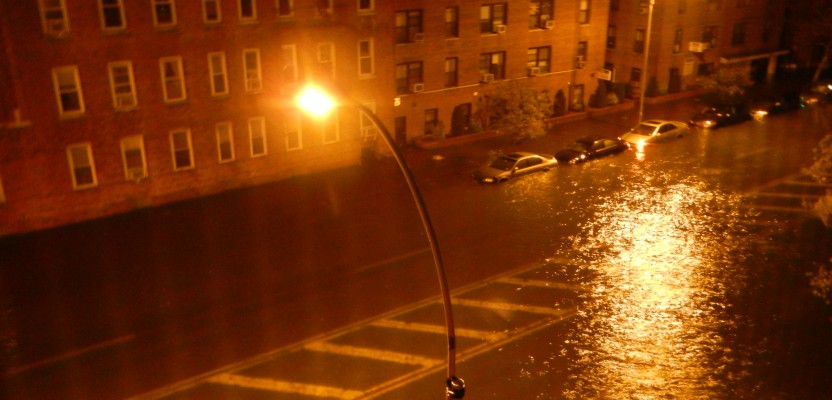
Storm surge in Sheepshead Bay, Brooklyn, NY during Hurricane Sandy. Credit: JoAnne Castagna, Public Affairs, U.S. Army Corps of Engineers, New York District.
The street lights flicker, and in the water flows large tree limbs, rubbish, and metal signage promoting party boat cruises, and standing nearby are nervous senior citizens. They’re slowly moving through the water, against the wind, holding onto rescue workers. It’s the result from Hurricane Sandy in October 2012.
Like them, I avoided the voluntary evacuation even though I reside near the Atlantic Ocean in an evacuation zone.
I lost power that evening, and for the next several weeks I lived in total darkness without electricity, heat, or hot water. I survived, but if I were elderly or sick, it would have been a different and more difficult experience.
I am a civil servant with the U.S. Army Corps of Engineers, New York District, which is working on ways to prevent these types of scenes. The agency is creating storm surge maps for emergency managers throughout New York State. These maps can be used to help identify evacuation zones, reduce risk to life and property, and better inform the public so that they can make better evacuation decisions before they’re hit by a hurricane.
The Army Corps has created these maps in the past, but now they’re creating them with higher resolution, which will provide more accurate information.
“Hurricane Sandy represented one of the largest-scale evacuations declared in recent history in the United States,” said Edward Schneyer, director of emergency preparedness, Suffolk County Office of Emergency Management.
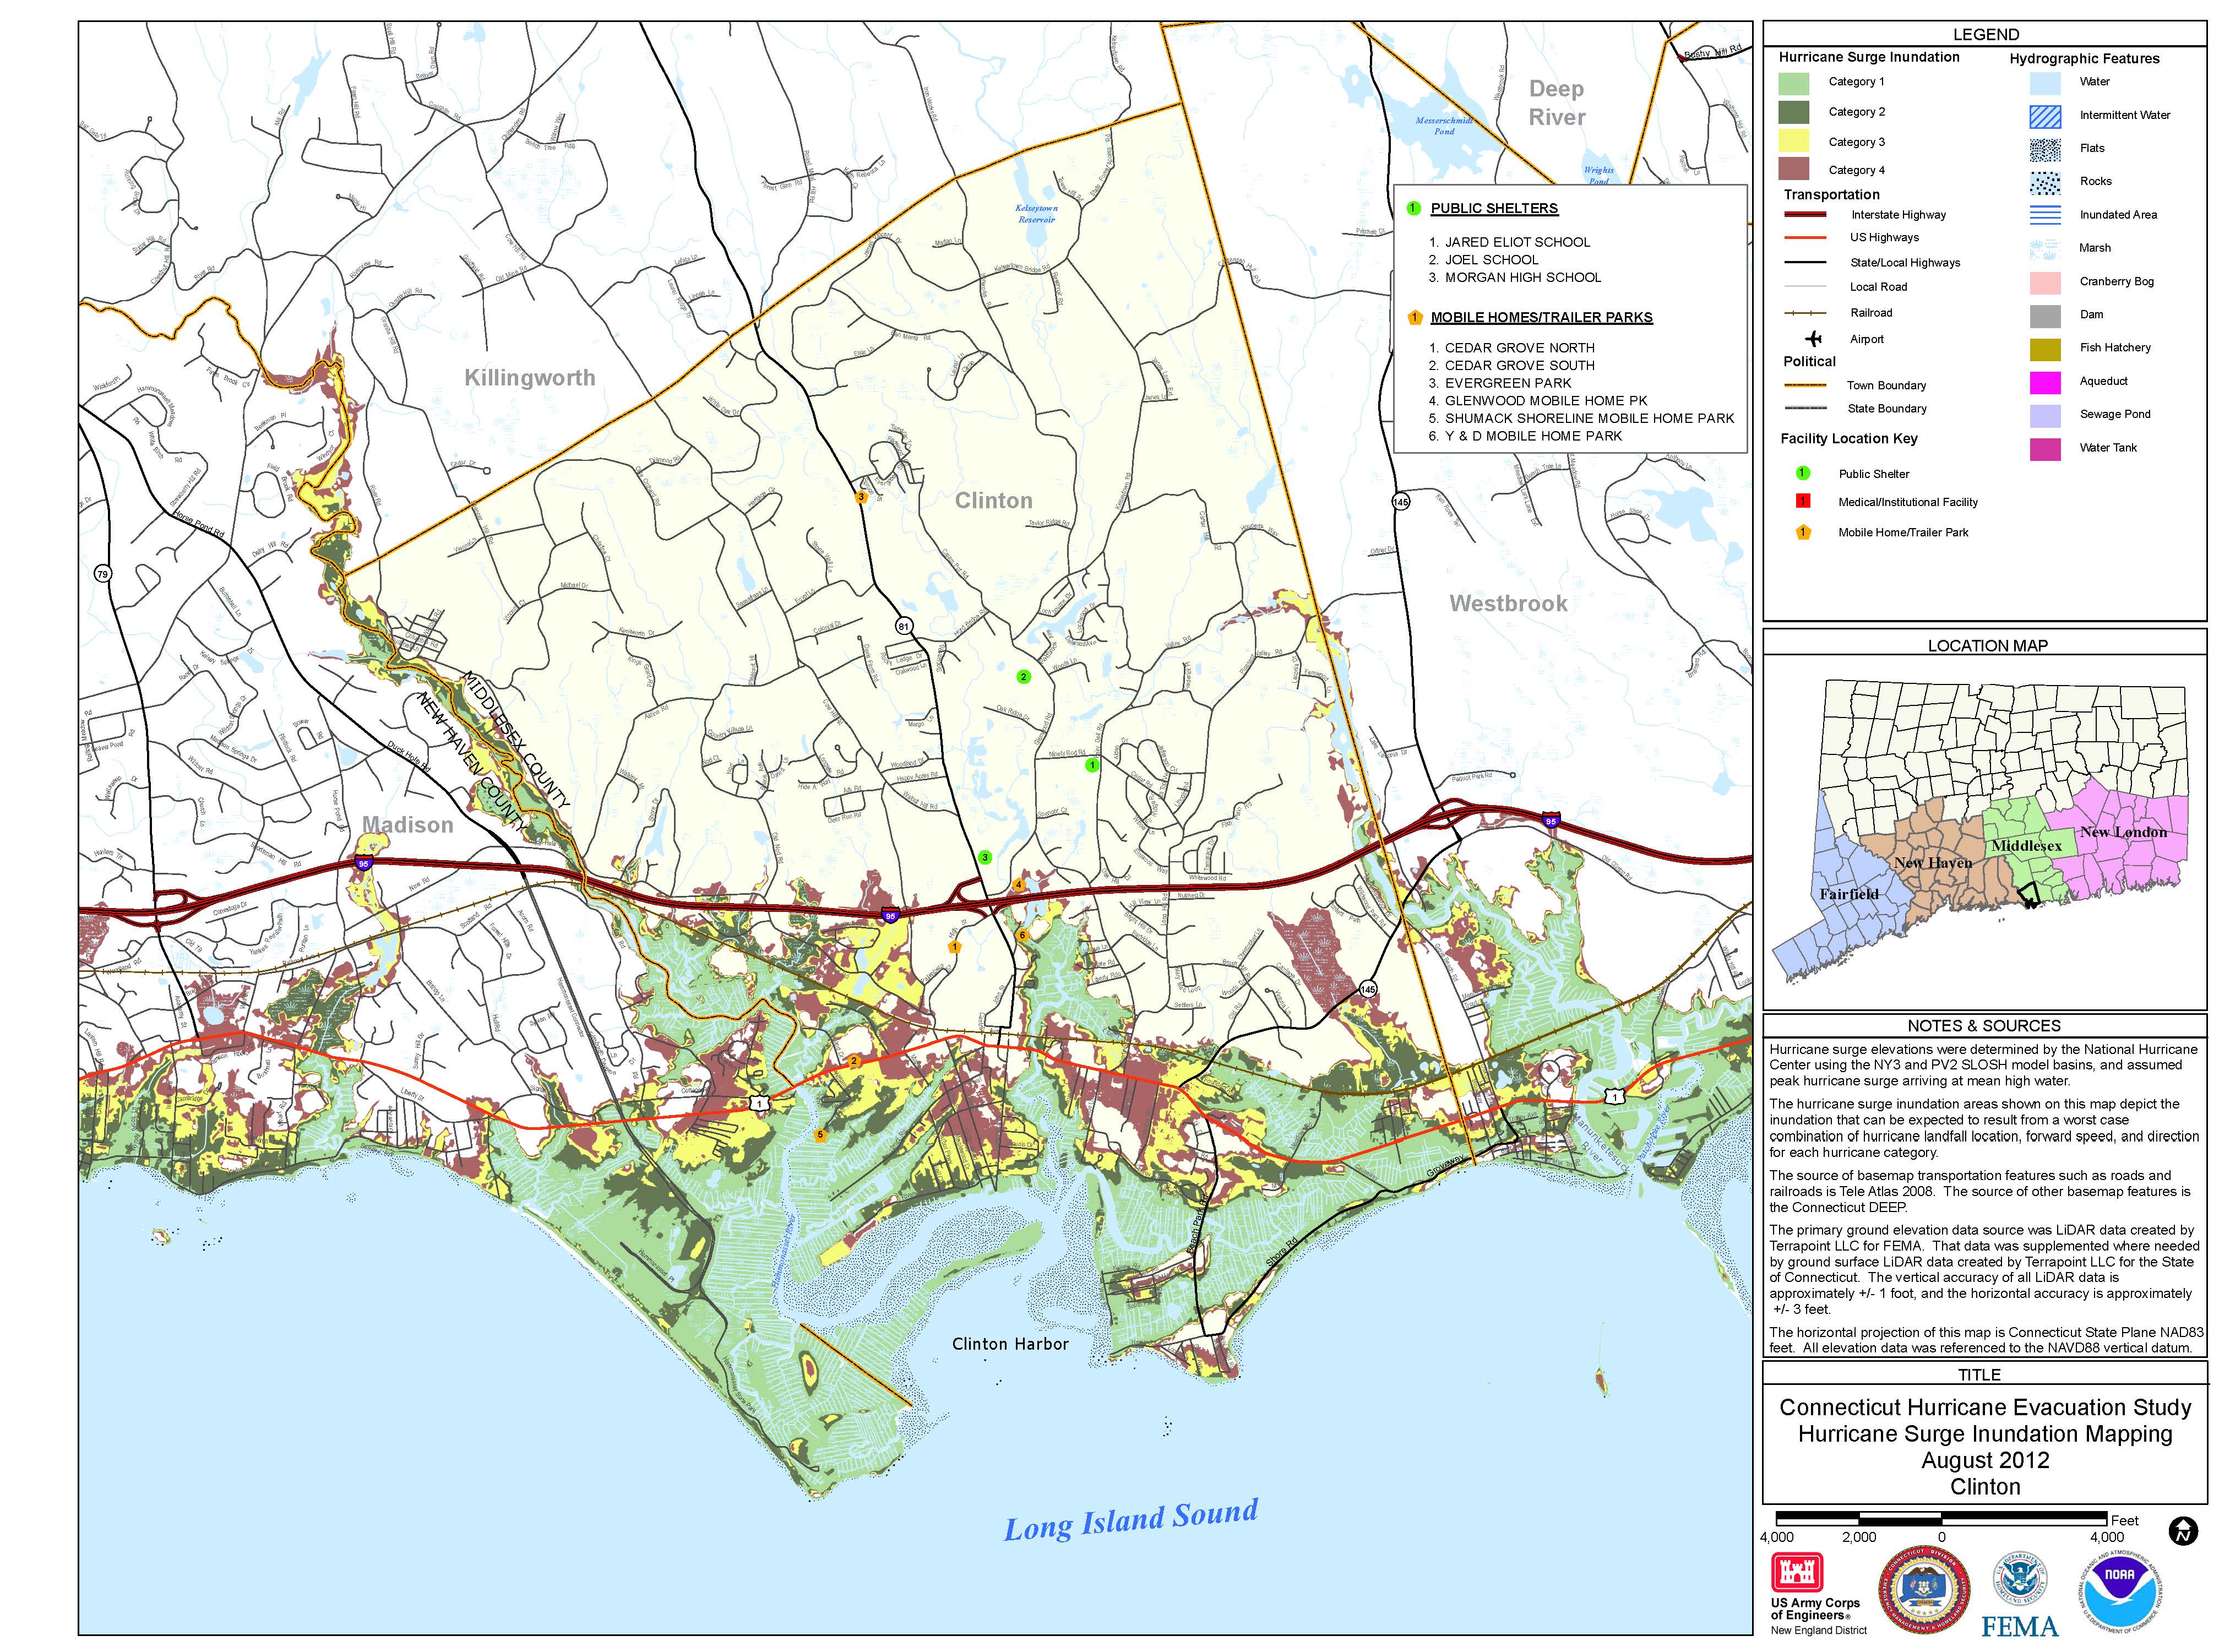
This map, which shows a portion of the Connecticut shoreline, is an example of a storm surge map. The map shows the extent of surge that can be expected as a result of a worse case combination of hurricane landfall location, forward speed, and direction for each hurricane category. Credit: USACE
He said he was able to perform rescues effectively because his agency has storm surge maps created by the Army Corps. “Storm surge” is when a significant amount of water is pushed from the sea onto the land caused by a hurricane.
“Historically, 49% of human causalities from hurricanes are due to storm surge,” said Donald E. Cresitello, USACE Hurricane Evacuation Study program manager for the State of New York, U.S. Army Corps of Engineers, New York District.
As the hurricane evacuation study managers for the National Hurricane Program, the Army Corps is responsible for creating these maps. “The development of these maps is the first step in the hazard analysis for the hurricane evacuation study process,” said Cresitello.
Cresitello said, “Agency officials can use these maps to help reduce risk to the public. They can use them for evacuation planning, to redefine their hurricane evacuation zones, identify where shelters should be located and identify where assets should be staged prior to impact from a storm.”
Schneyer said, “The storm maps serve as a very valuable resource for both government and private sector agencies, as well as private residents. As a government agency tasked with emergency management responsibilities pertaining to evacuation and sheltering of the public, we use the maps to gain insight and perspective into the geographical area impacted and use this information to determine the number of buildings or population potentially impacted by a flood.”
The new maps, like previous ones, are being created using GIS, is a computer-based information system and tool capable of capturing, storing, analyzing, and displaying location information. The tool inputs data from various sources, such as aerial photography, and combines these layers of information in various ways to perform analysis and create maps.
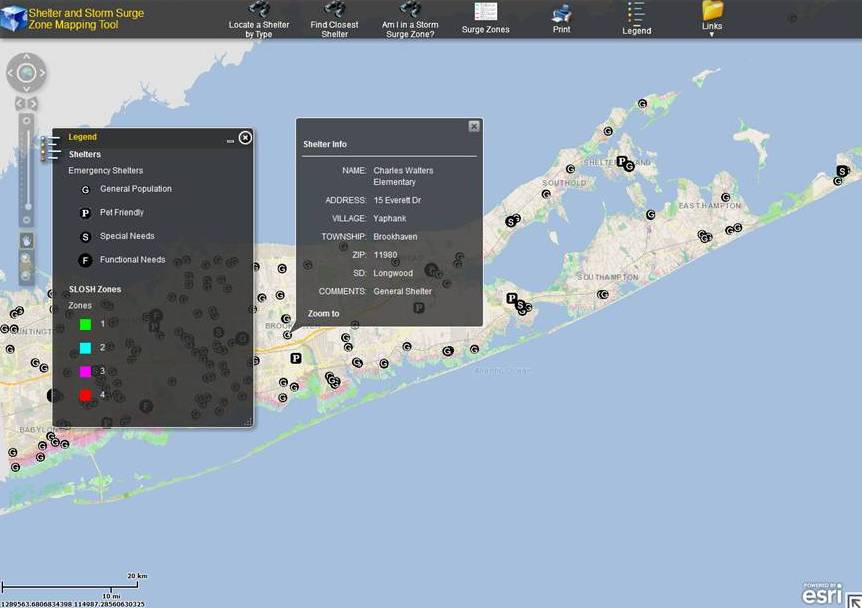
A page from the interactive website that the Suffolk County Office of Emergency Management created for its residents, using the information from the U.S. Army Corps of Engineer’s storm surge maps. The public can use the site to locate their residence, see if their home is in a hurricane storm surge zone and if so which shelters are near them. Credit: USACE.
To create the higher resolution storm surge maps, higher resolution storm surge elevation information from NOAA’s SLOSH Model (Sea, Lake, Overland Surges from Hurricanes) is being layered over higher resolution lidar-based topography in ArcGIS.
The new maps will be a considerable improvement from the older maps because they will have higher resolution storm surge modeling data and topography that will provide greater detail and accuracy. The new maps will not only show the extent of inland storm surge for Category 1 to 4 storms, but also the depth of the water in ranges of feet.
In addition, the maps will illustrate areas that will experience more flooding and areas that will experience less flooding.
“To come up with the actual depth of water through GIS we are overlaying the data out of NOAA’s SLOSH Model and subtracting out the ground elevations using digital elevation models and coming up with an actual depth of water in feet,” said Cresitello.
Knowing the depth of water helps emergency managers to better focus their limited resources. “As emergency managers dealing with the recovery effort and critical decision making, these storm maps provide the geographical area of primary concern where efforts and resources need to be focused to make essential and accurate damage assessments to determine life and property hazards,” said Schneyer.
These maps are a tool for not just agencies but also the general public. Schneyer’s agency is taking the information from the Army Corps’ maps and entering it into an interactive mapping program developed and viewable on its county’s website.
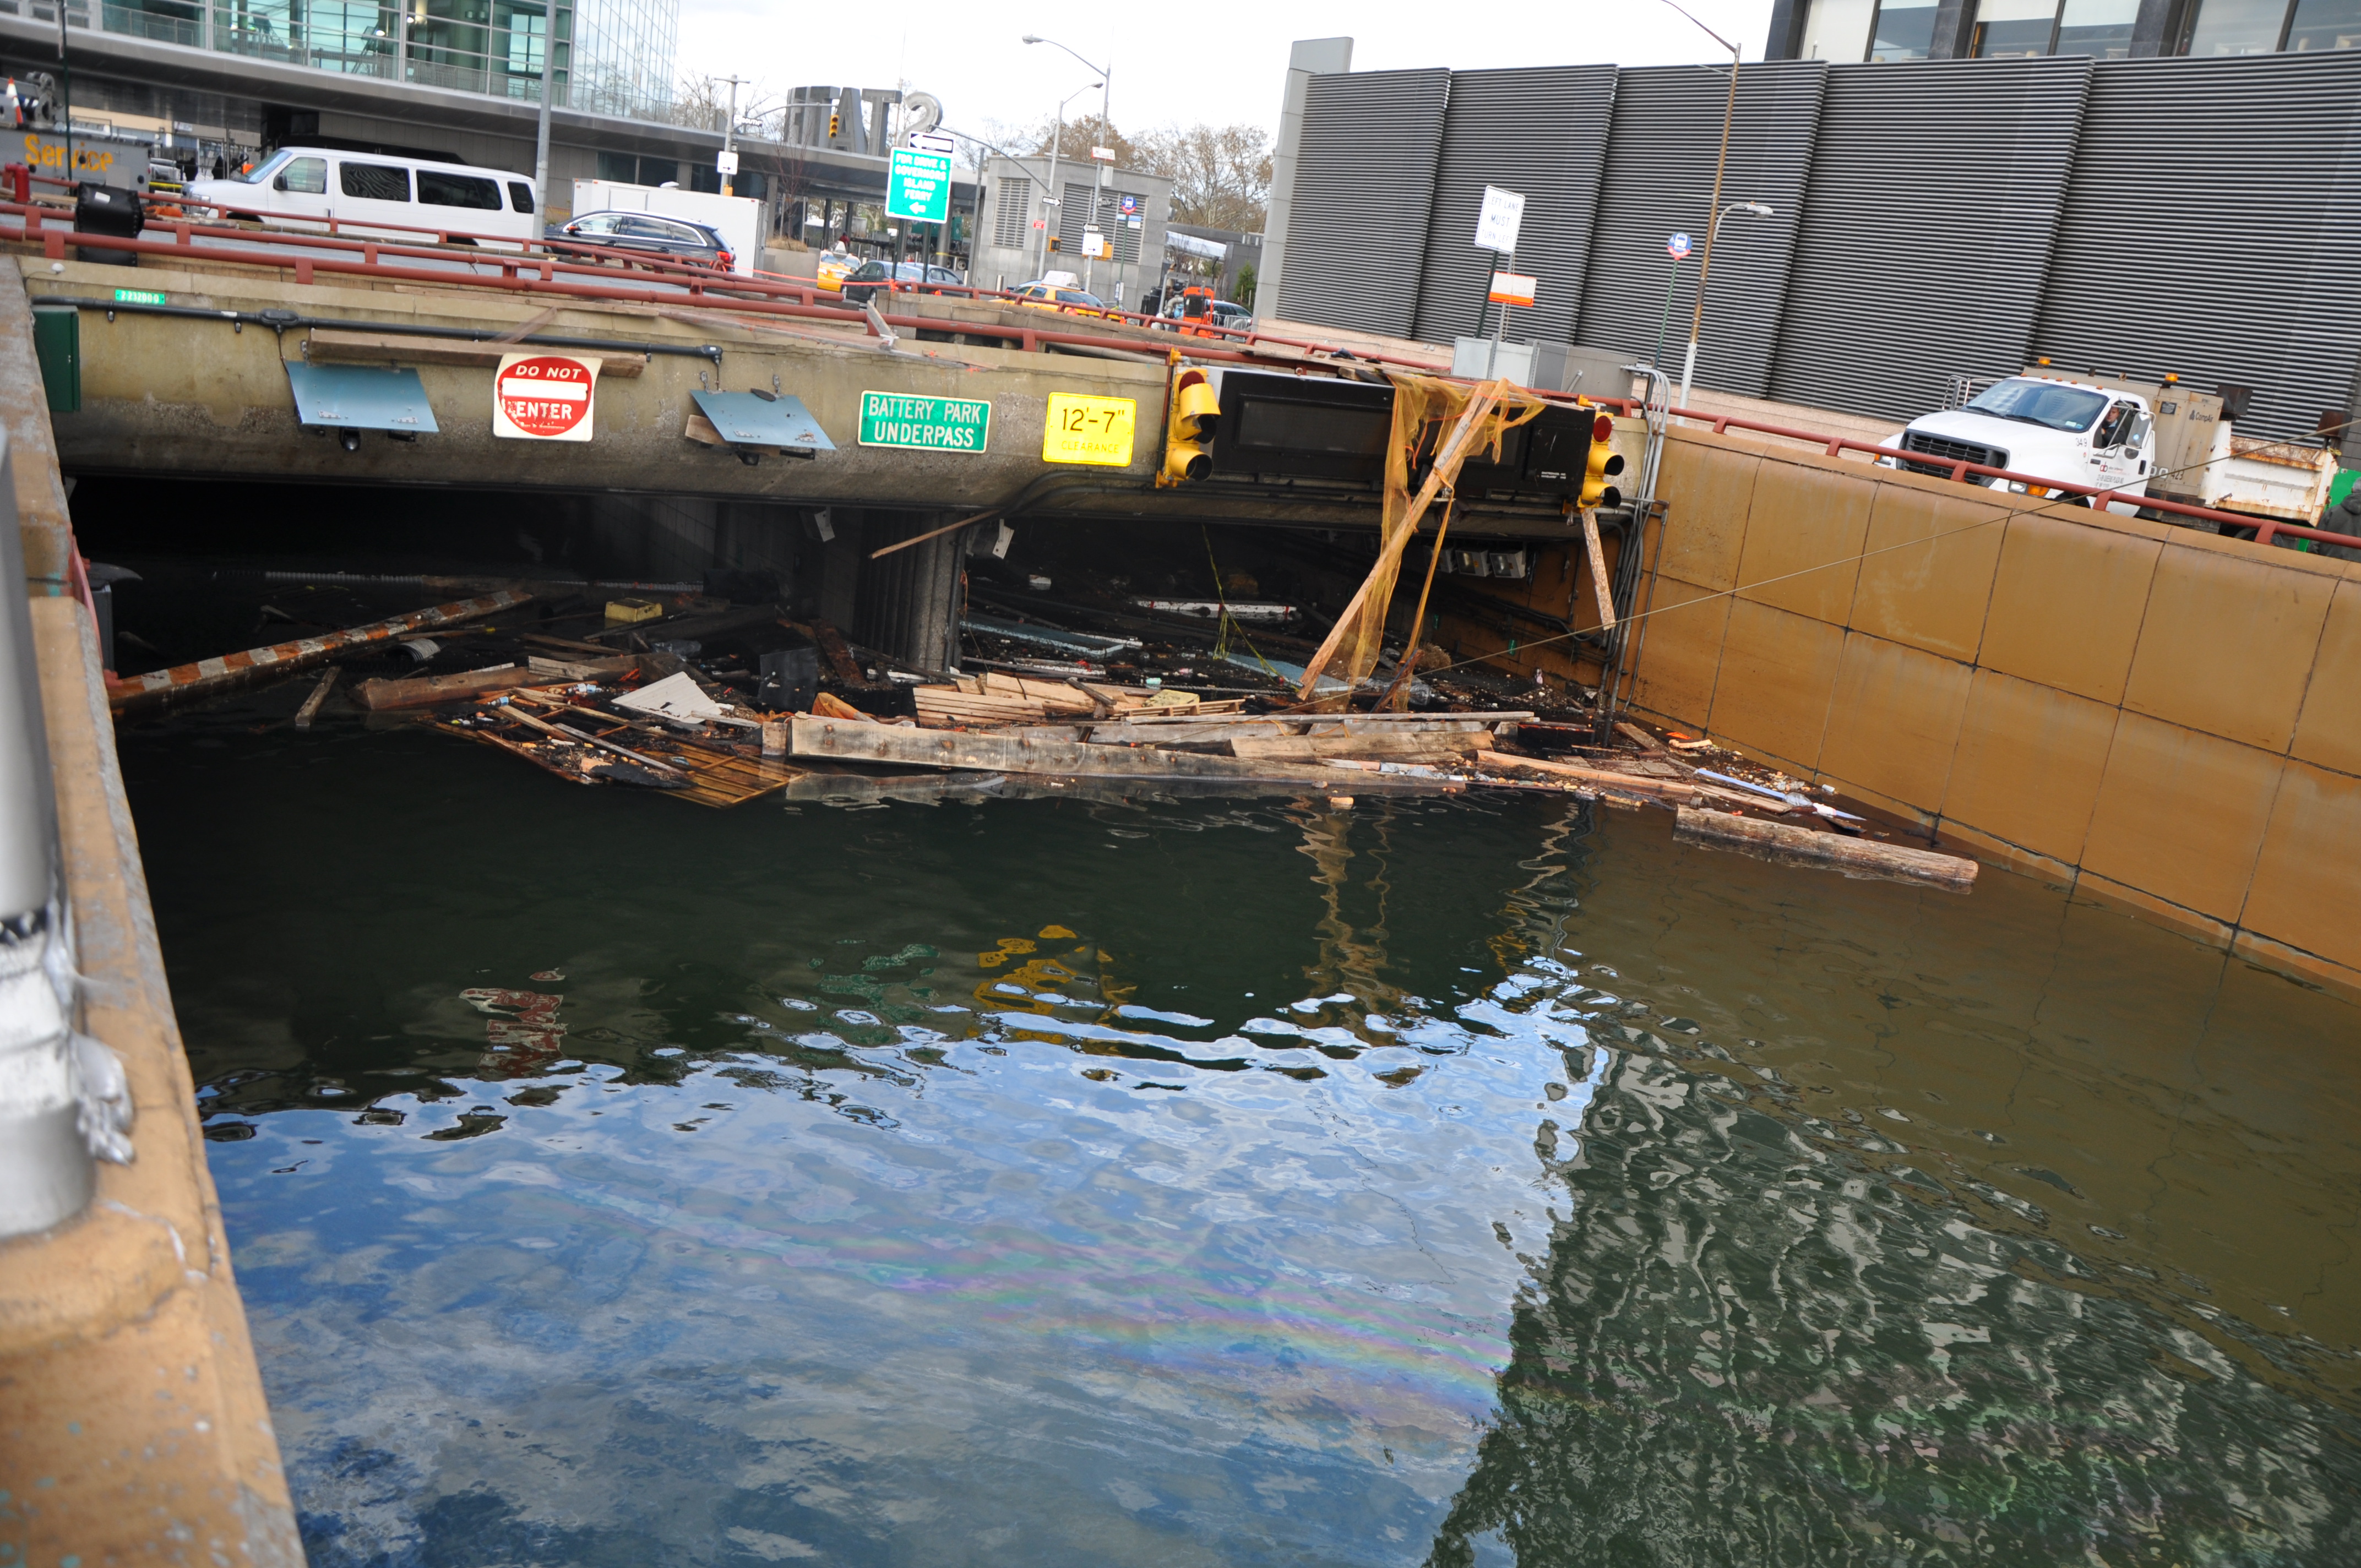
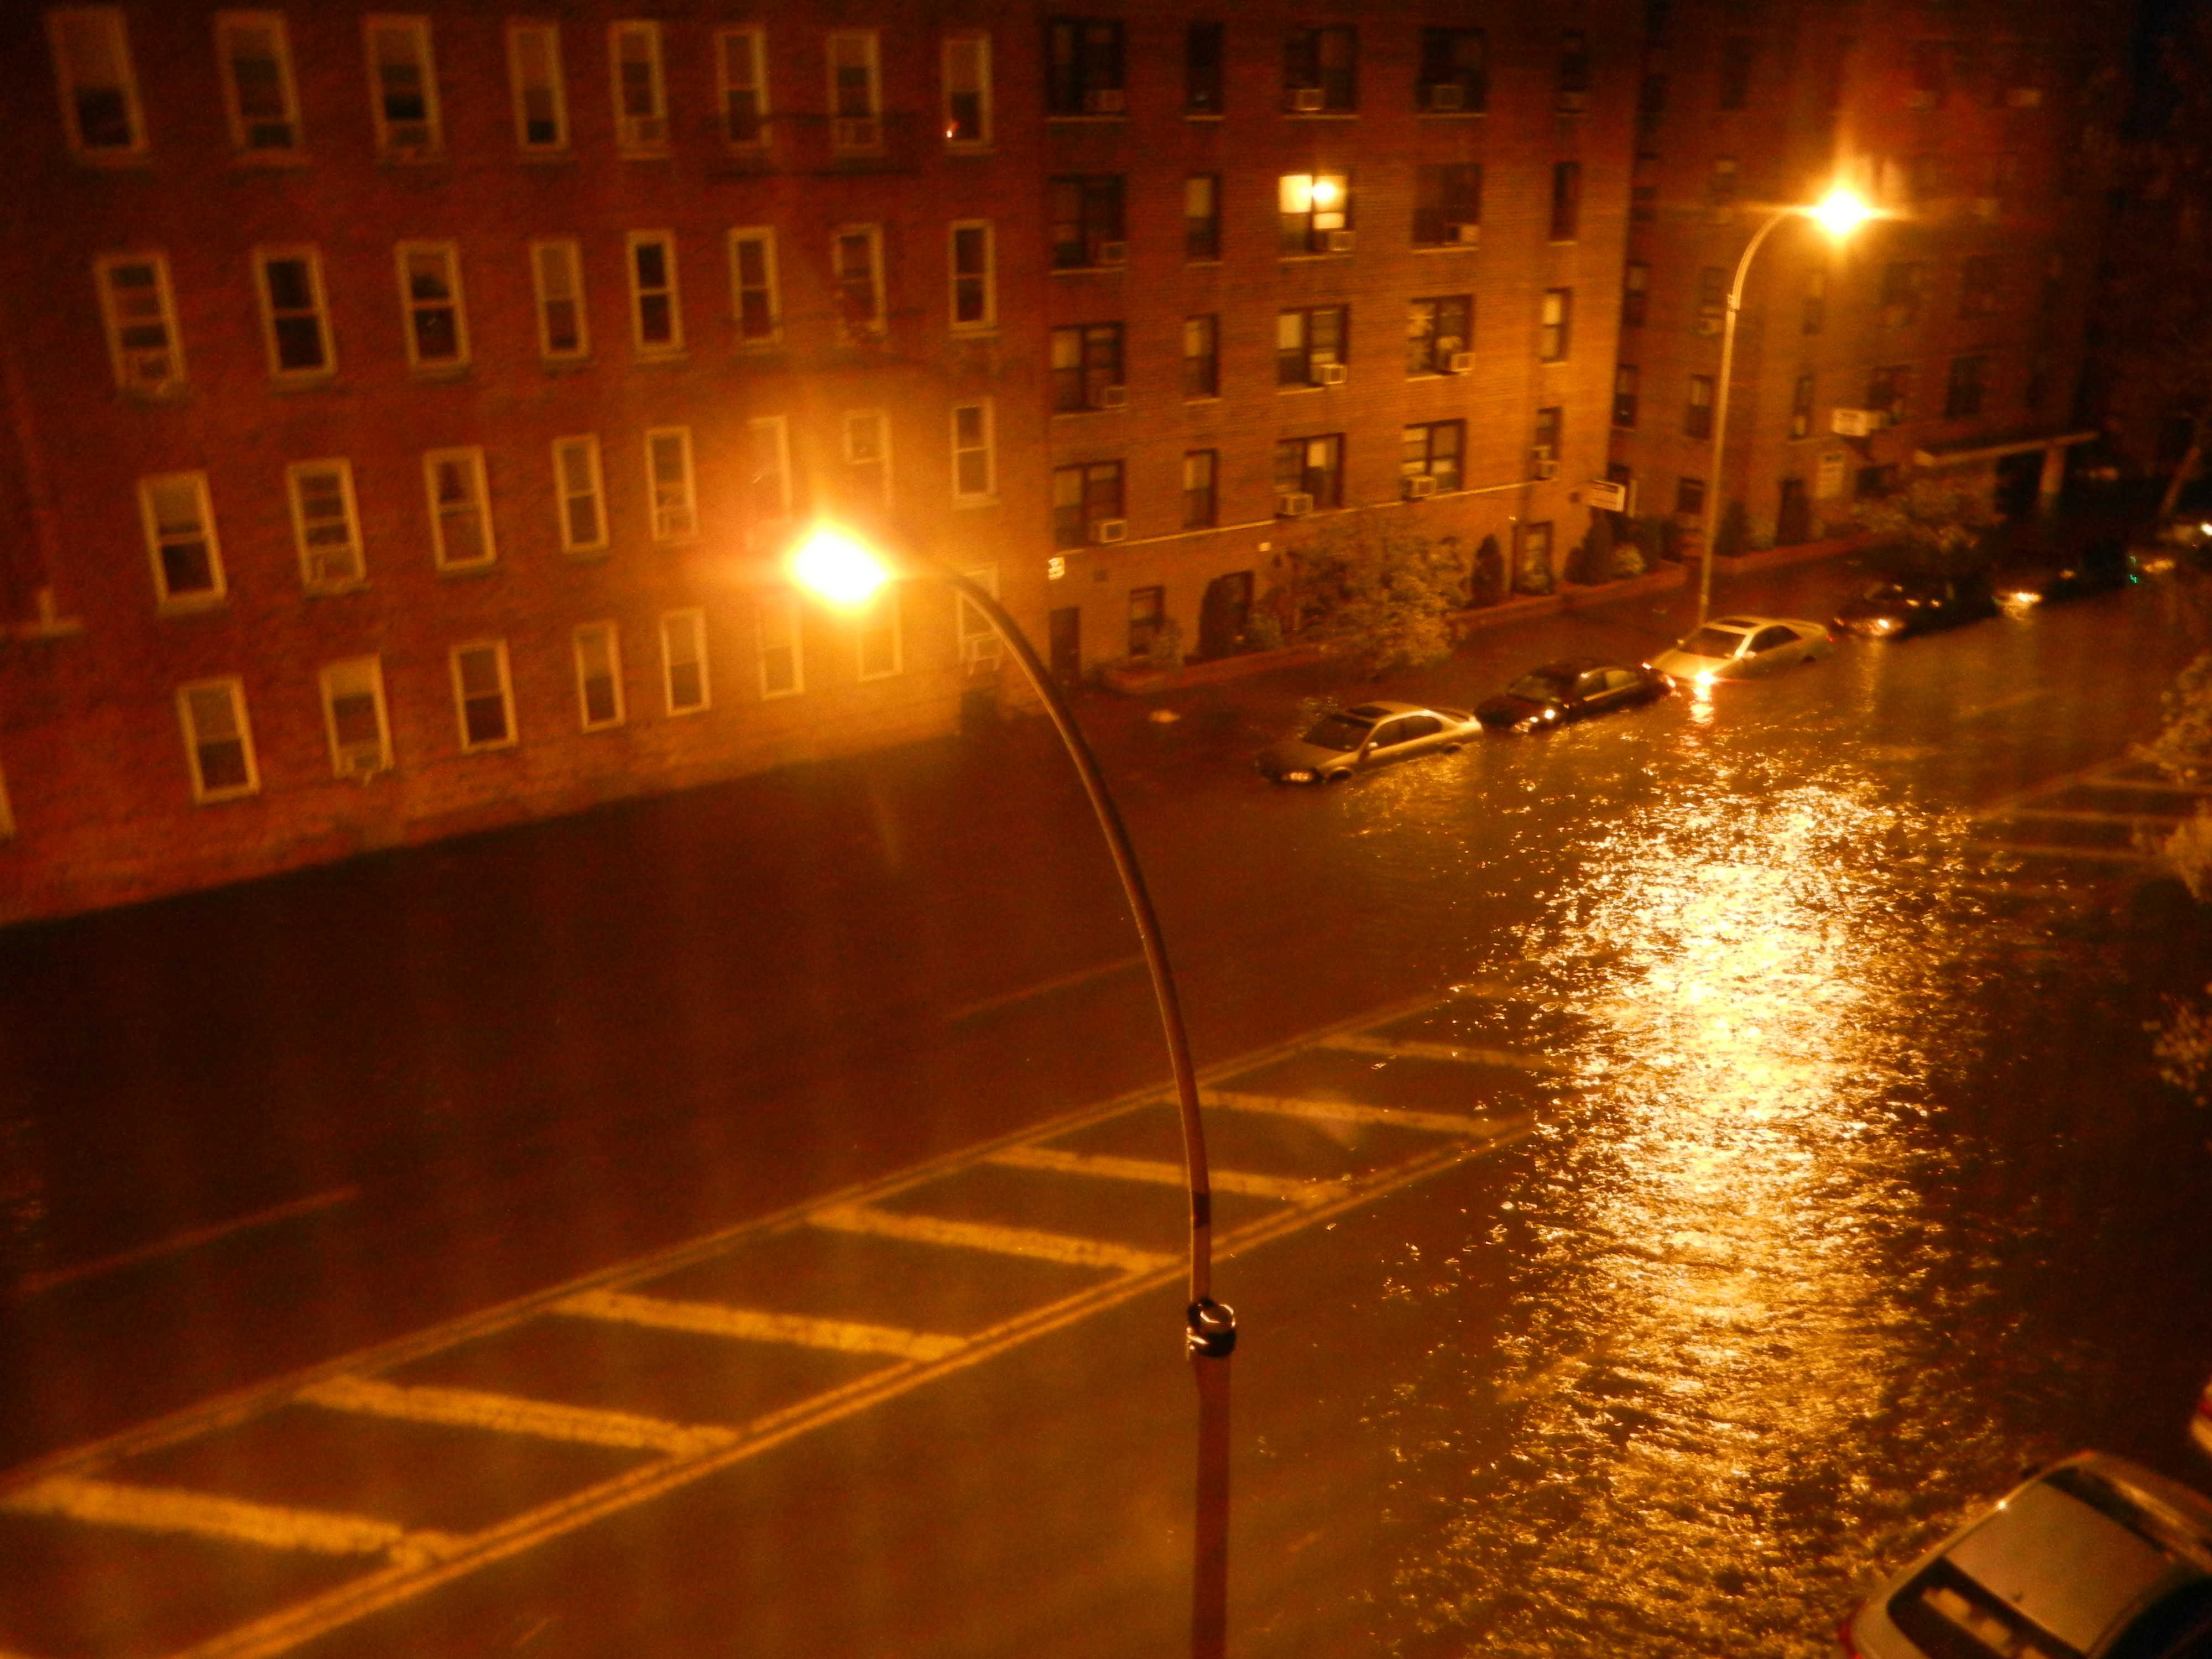
Storm surge in downtown New York City in the aftermath of Hurricane Sandy. Credit: USACE.
The public can visit the website to locate their residence, see if their home is in a hurricane storm surge zone and if so which designated shelter is nearby.
The Army Corps also wants the public to use these resources. “It’s important for people to know their specific zone,” said Cresitello. “The public should be aware of what evacuation zone they live in and should listen to their local officials so they don’t question or ignore an official emergency evacuation order.”
During Sandy, people who should have evacuated but didn’t were stranded without help and faced many dangers including electrocution from downed power lines and fires from massive gas leaks.
Schneyer added, “The more information, especially information resulting from scientific studies and available technology, the more situationally aware we and our residents will be. This very valuable resource is an excellent tool for public education, emergency management planning, and emergency preparedness in general.”
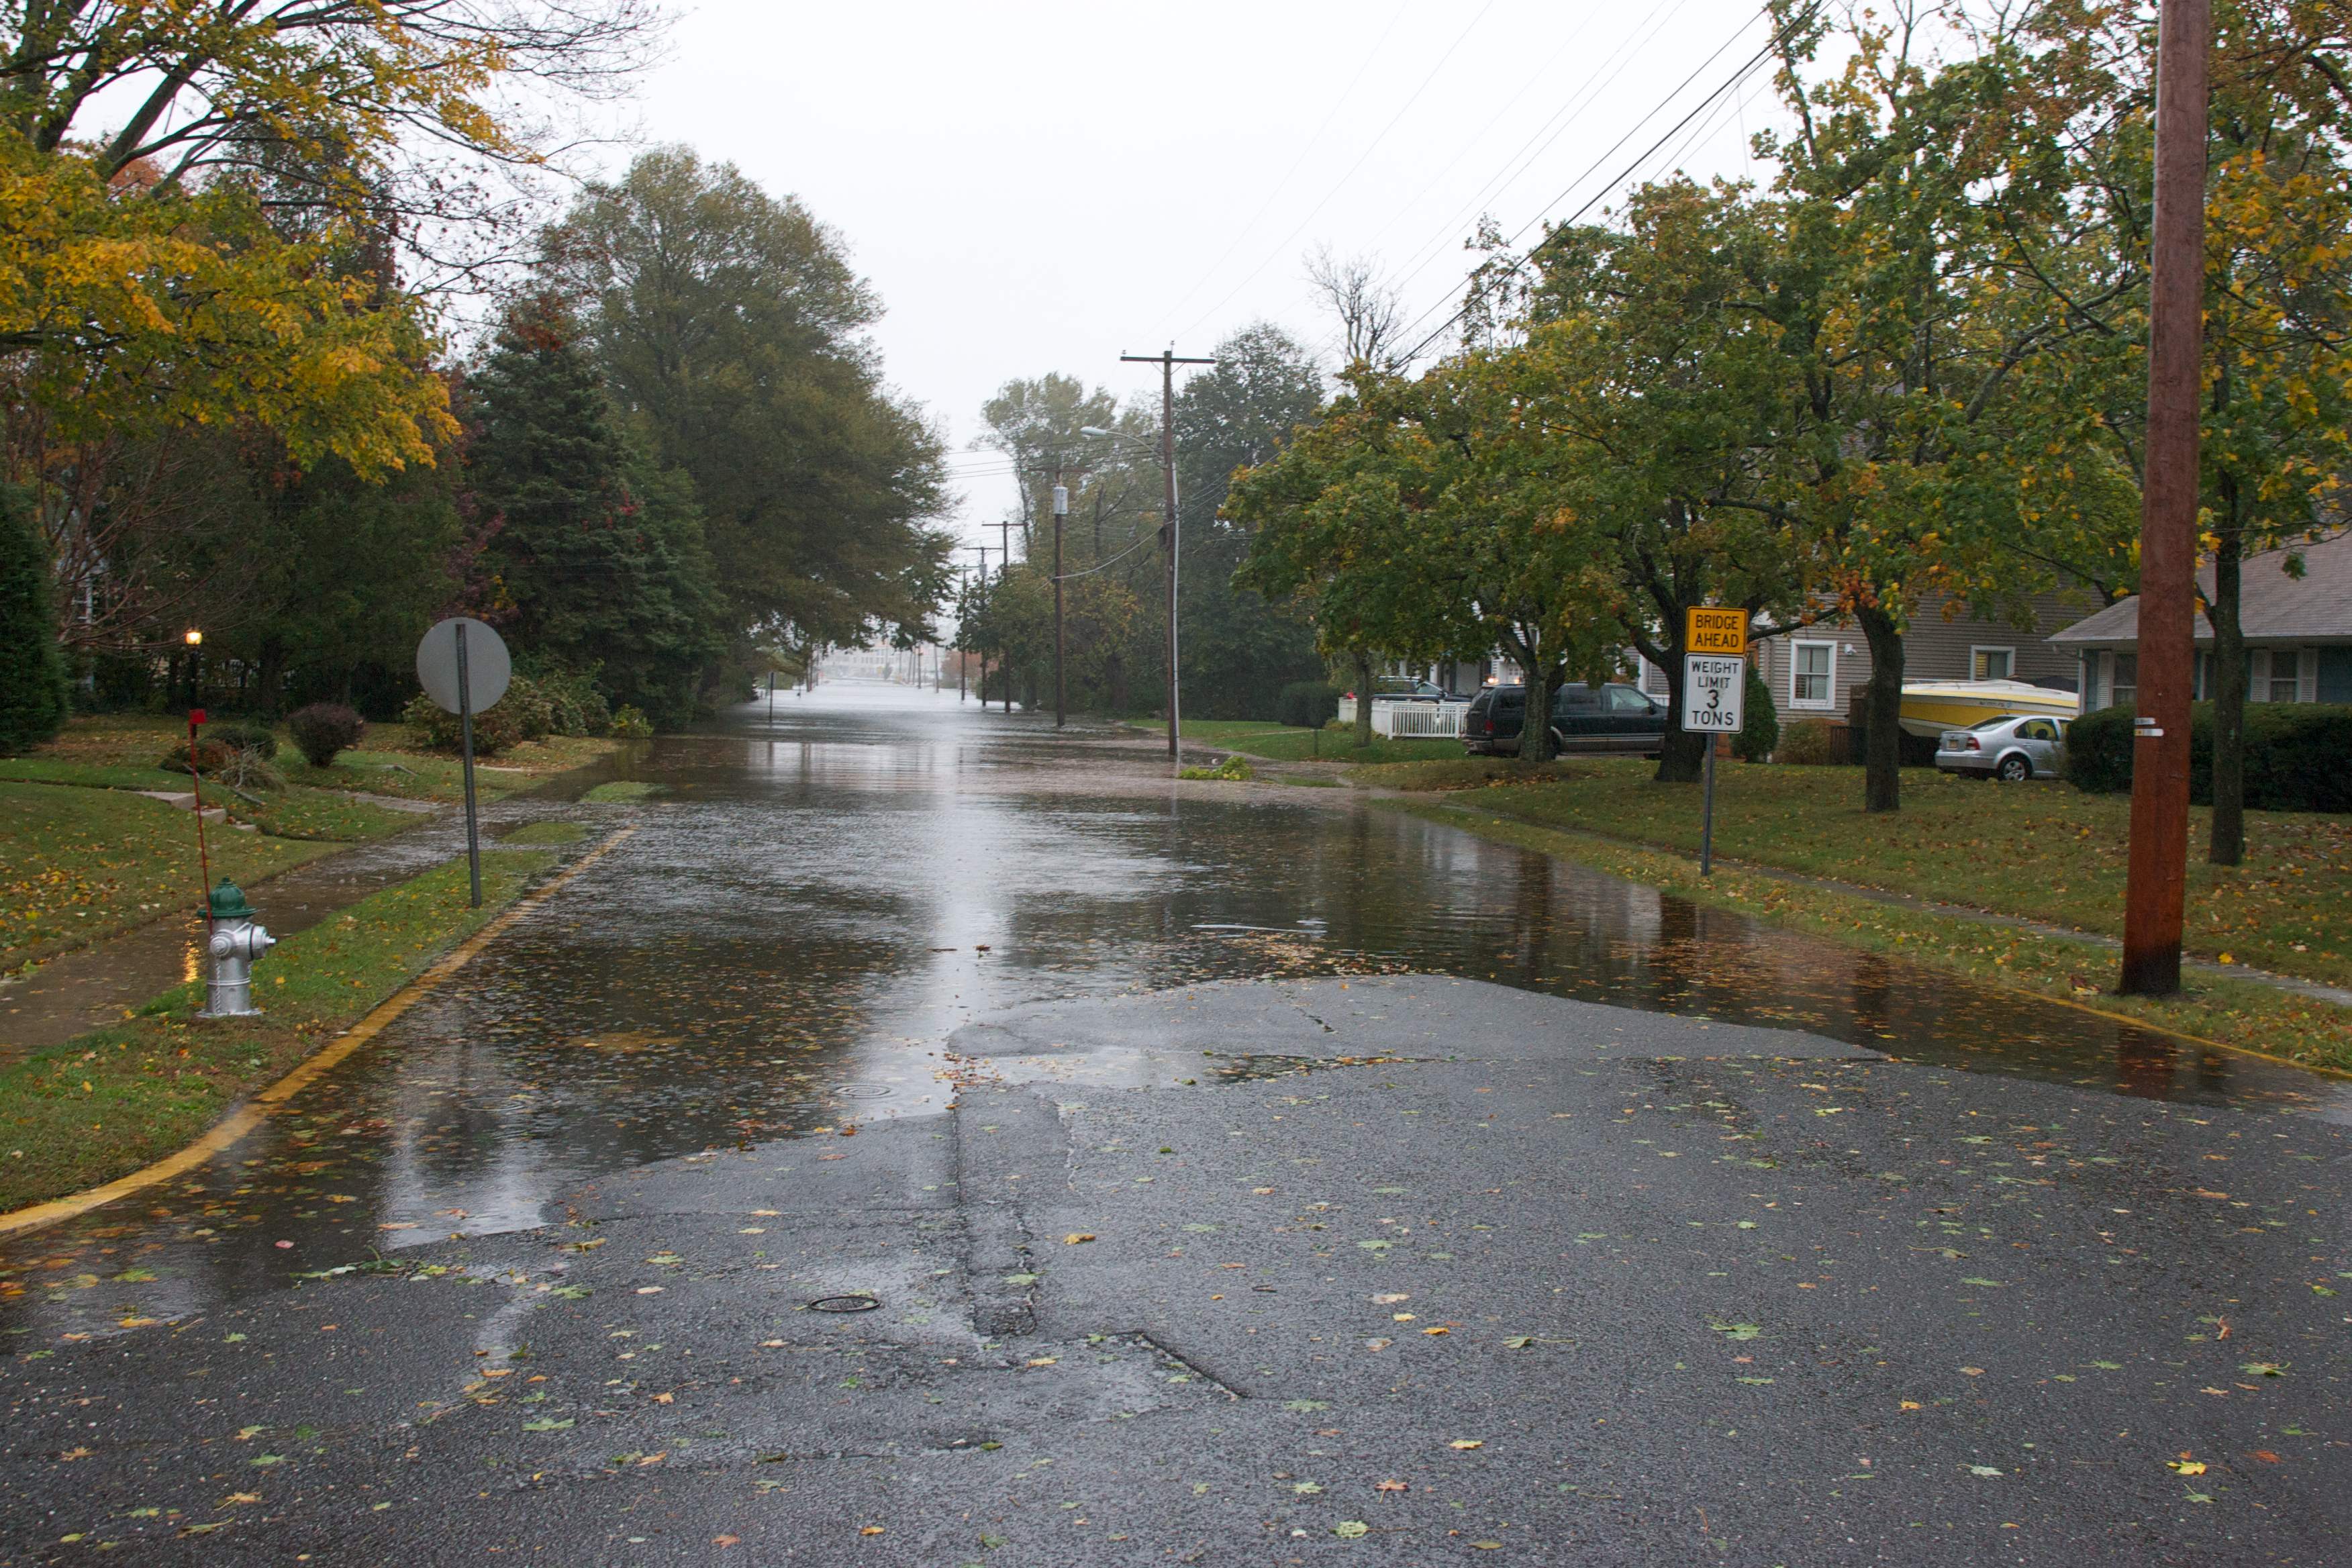
First sign of surge during Hurricane Sandy in Brielle, NJ. Credit: Donald E. Cresitello, USACE Hurricane Evacuation Study Program Manager for the State of New York, U.S. Army Corps of Engineers, New York District.
This information will better inform emergency agencies about hurricane storm surge and as a result they will be able to better inform the public. The public will then be able to make better evacuation decisions. This will save more lives and hopefully eliminate the scenes witnessed during Hurricane Sandy.