One huge structure; three organizations; five technologies; surfaces inside, outside, above and below water; plus crayfish underfoot—all challenges to building a 3D database of a dam in West Virginia.
The Bluestone Dam on the New River in West Virginia was completed in 1952. It’s 165 feet high above the stream bed and about 2,000 feet long, and it has 21 flood gates. Any way you look at it, it’s impressive.
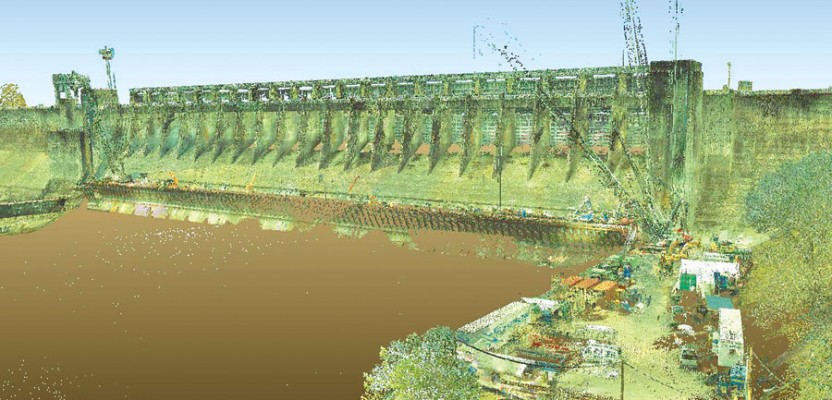
Exterior scans done terrestrially from a conventional setup were performed by Allegheny Surveys.
As part of an ongoing safety assurance program, the Huntington District of the U.S. Army Corps of Engineers (USACE), which operates the dam, has been collecting detailed data on it and plans to have a complete 3D model of it by the end of 2015.
Currently, USACE is drilling through the dam and putting in pre-stressed steel anchors. The project is generating an enormous amount of construction and design data, including soil borings and geological studies. This gave rise to the need for a plan to manage the data. The scans and surveys will make it possible to build a 3D database to do so.
Three Teams
To help with surveying and scanning the massive structure in the time allocated for this part of the program, the Corps contracted with Allegheny Surveys, Inc., a multi-office land surveying company based in Birch River, West Virginia, and Seaside Engineering and Surveying, LLC, a hydrographic survey company based in Crestview, Florida. Each of the three teams faced significant challenges in carrying out its portion of the project.
Surveyors from the Corps scanned all of the interior structures of the dam as well as some of the exterior and along some of the gates.
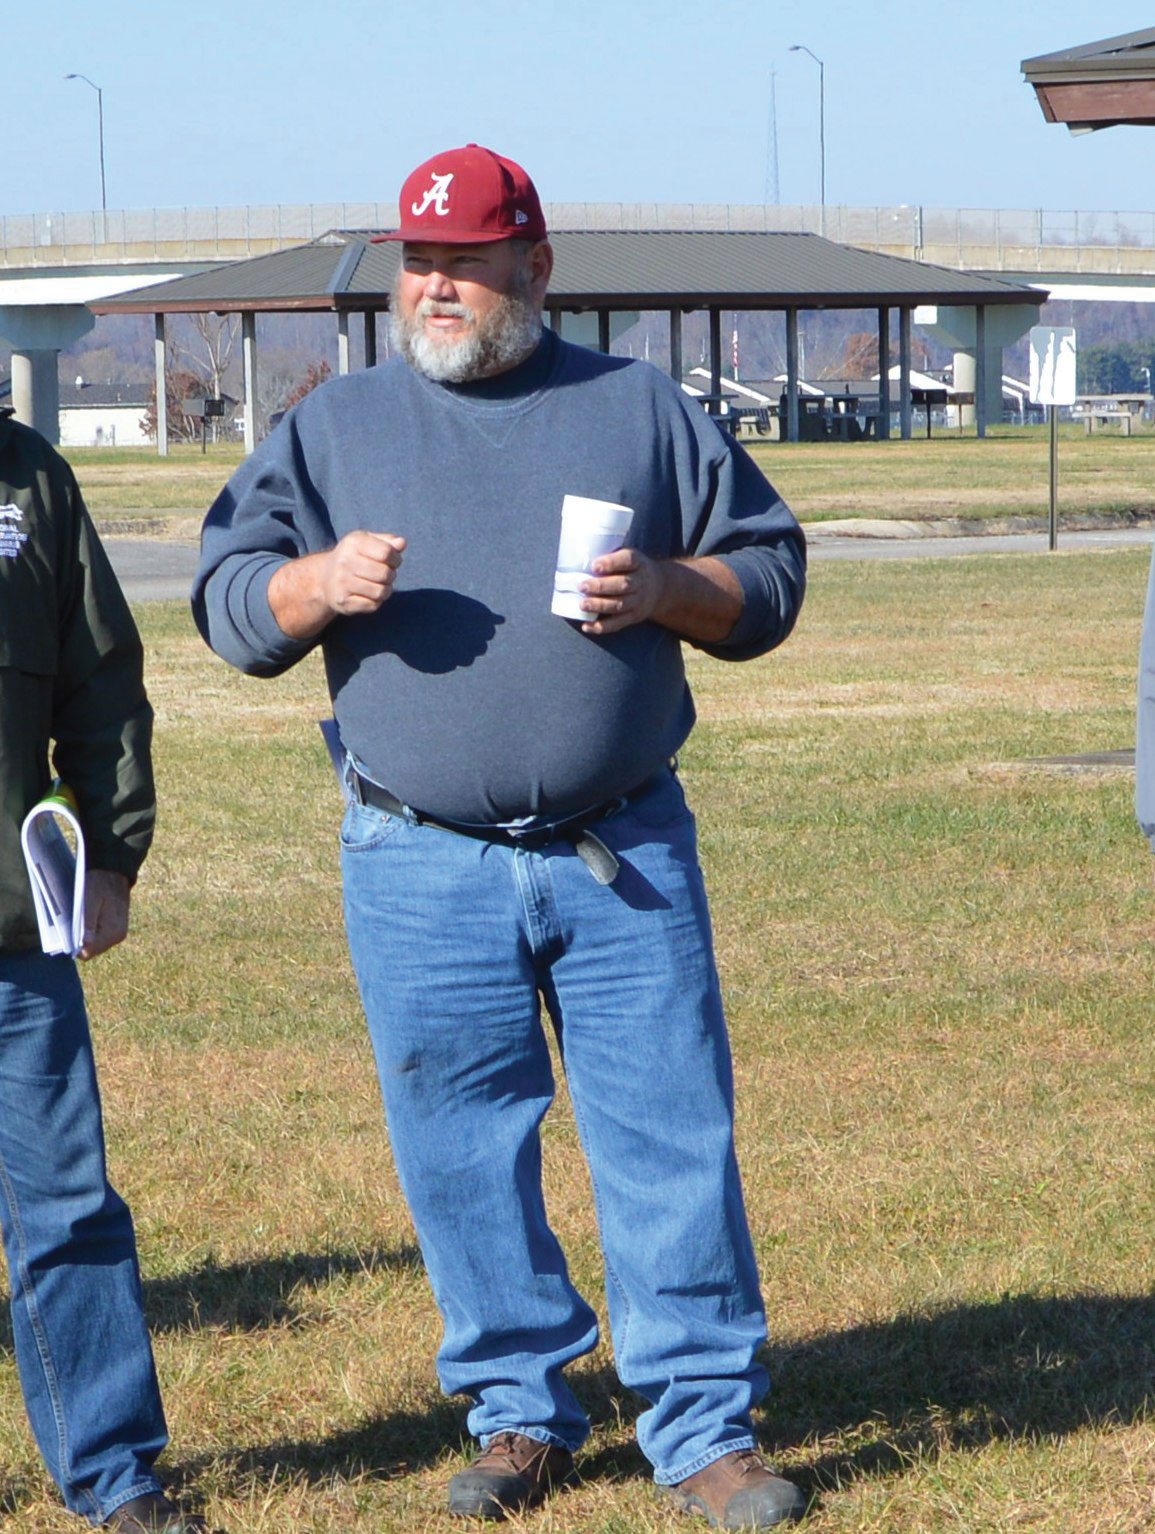
Mack McCarty of the USACE
coordinated all surveying.
Allegheny Surveys was responsible for all of the exterior scan work that could be done terrestrially from a conventional setup: the top of the dam, the back sides of the abutments on each side and some more downstream, and the guide walls for the water.
SEAS scanned the upstream face of the dam, the downstream face of the dam, the lake shoreline, and the structures surrounding the stilling basin area on the downstream side of the dam—a pool of about 1,200 ft by 800 ft used to reduce the hydraulic force of the water coming through the dam at high velocity. They also performed a bathymetric survey of the lake immediately upstream of the dam, the upstream face of the dam, and the stilling basin area.
Particular Restrictions Inside
The Corps decided to scan all of the interior structures of the dam itself because it is hard to get contractors cleared to go inside critical infrastructures, according to E.M. “Mack” McCarty, Jr., chief of the Huntington District’s geospatial section. The Corps’ surveyors used a FARO Focus X 330, a small, compact phase-based lidar scanner.
“The challenges inside the dam were quite extensive,” says McCarty, “because we did not have a very thorough control base inside our dam. We had to basically re-run survey control throughout the interior.
“All surveyors want to have really long back sights and fore sights and cover a lot of ground. However, when you are working in a small confined space such as the dam interior, a 20 ft fore sight or back sight is often the norm. It was important to network traverses together as much as possible and to make ties to control outside the dam whenever possible. We had about two weeks running controls, horizontally and vertically, in addition to running the scans.”
“Of course, as we were running the scans, we wanted to pick up as much data as we could,” McCarty continues. “For example, as you go across the main portion of our dam, inside the dam there is an operations gallery and an inspection gallery that are about 6 ft by 8 ft tunnels that go across the entire length. To obtain good scan data, we had to make several setups.
“Then, along those, there are rooms that widen out inside the tunnel, so we had to make several setups to capture the data inside those rooms. In several places, we had to scan up stairwells. Finally, we had to tie everything back together. It became quite a daunting task. Overall, we had something like 186 scans of the interior of the structure.”
Outside Scans Just Above the Water
Allegheny Surveys was tasked with performing a 3D laser scan survey of the outside of the entire dam and with surveying cross sections spanning the 1,000 ft-wide river downstream of the dam for a distance of 3,800 ft.
Only four hours for downstream
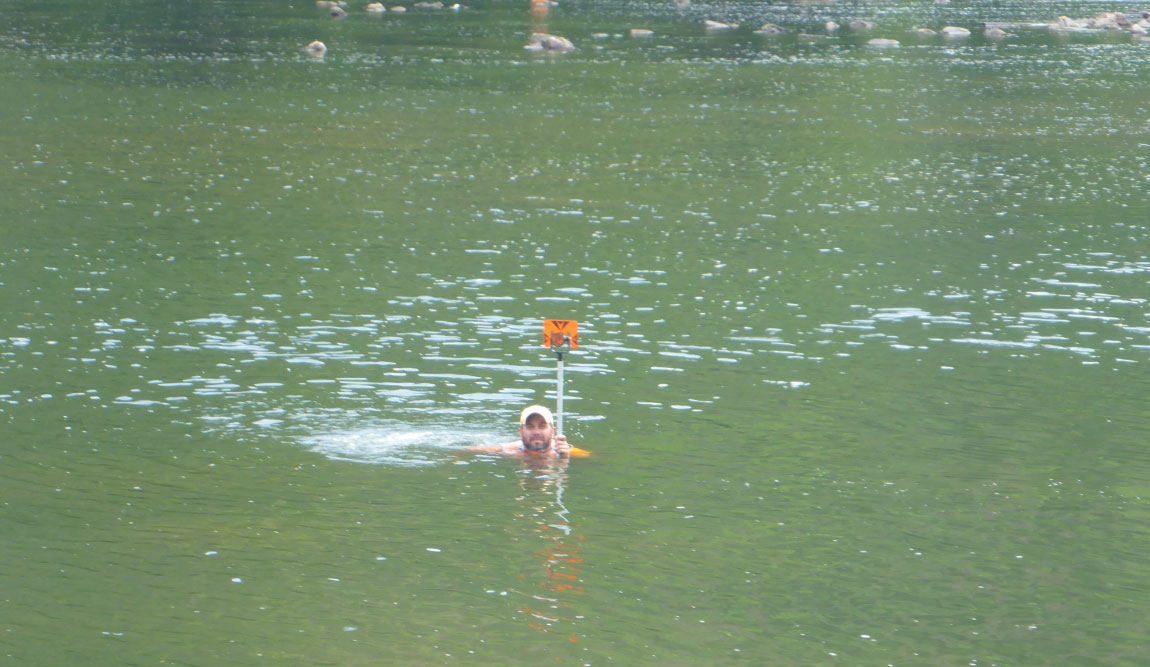
Nathan Harris, of Allegheny Surveys, swims in place while locating river bottom cross sections downstream of the dam.
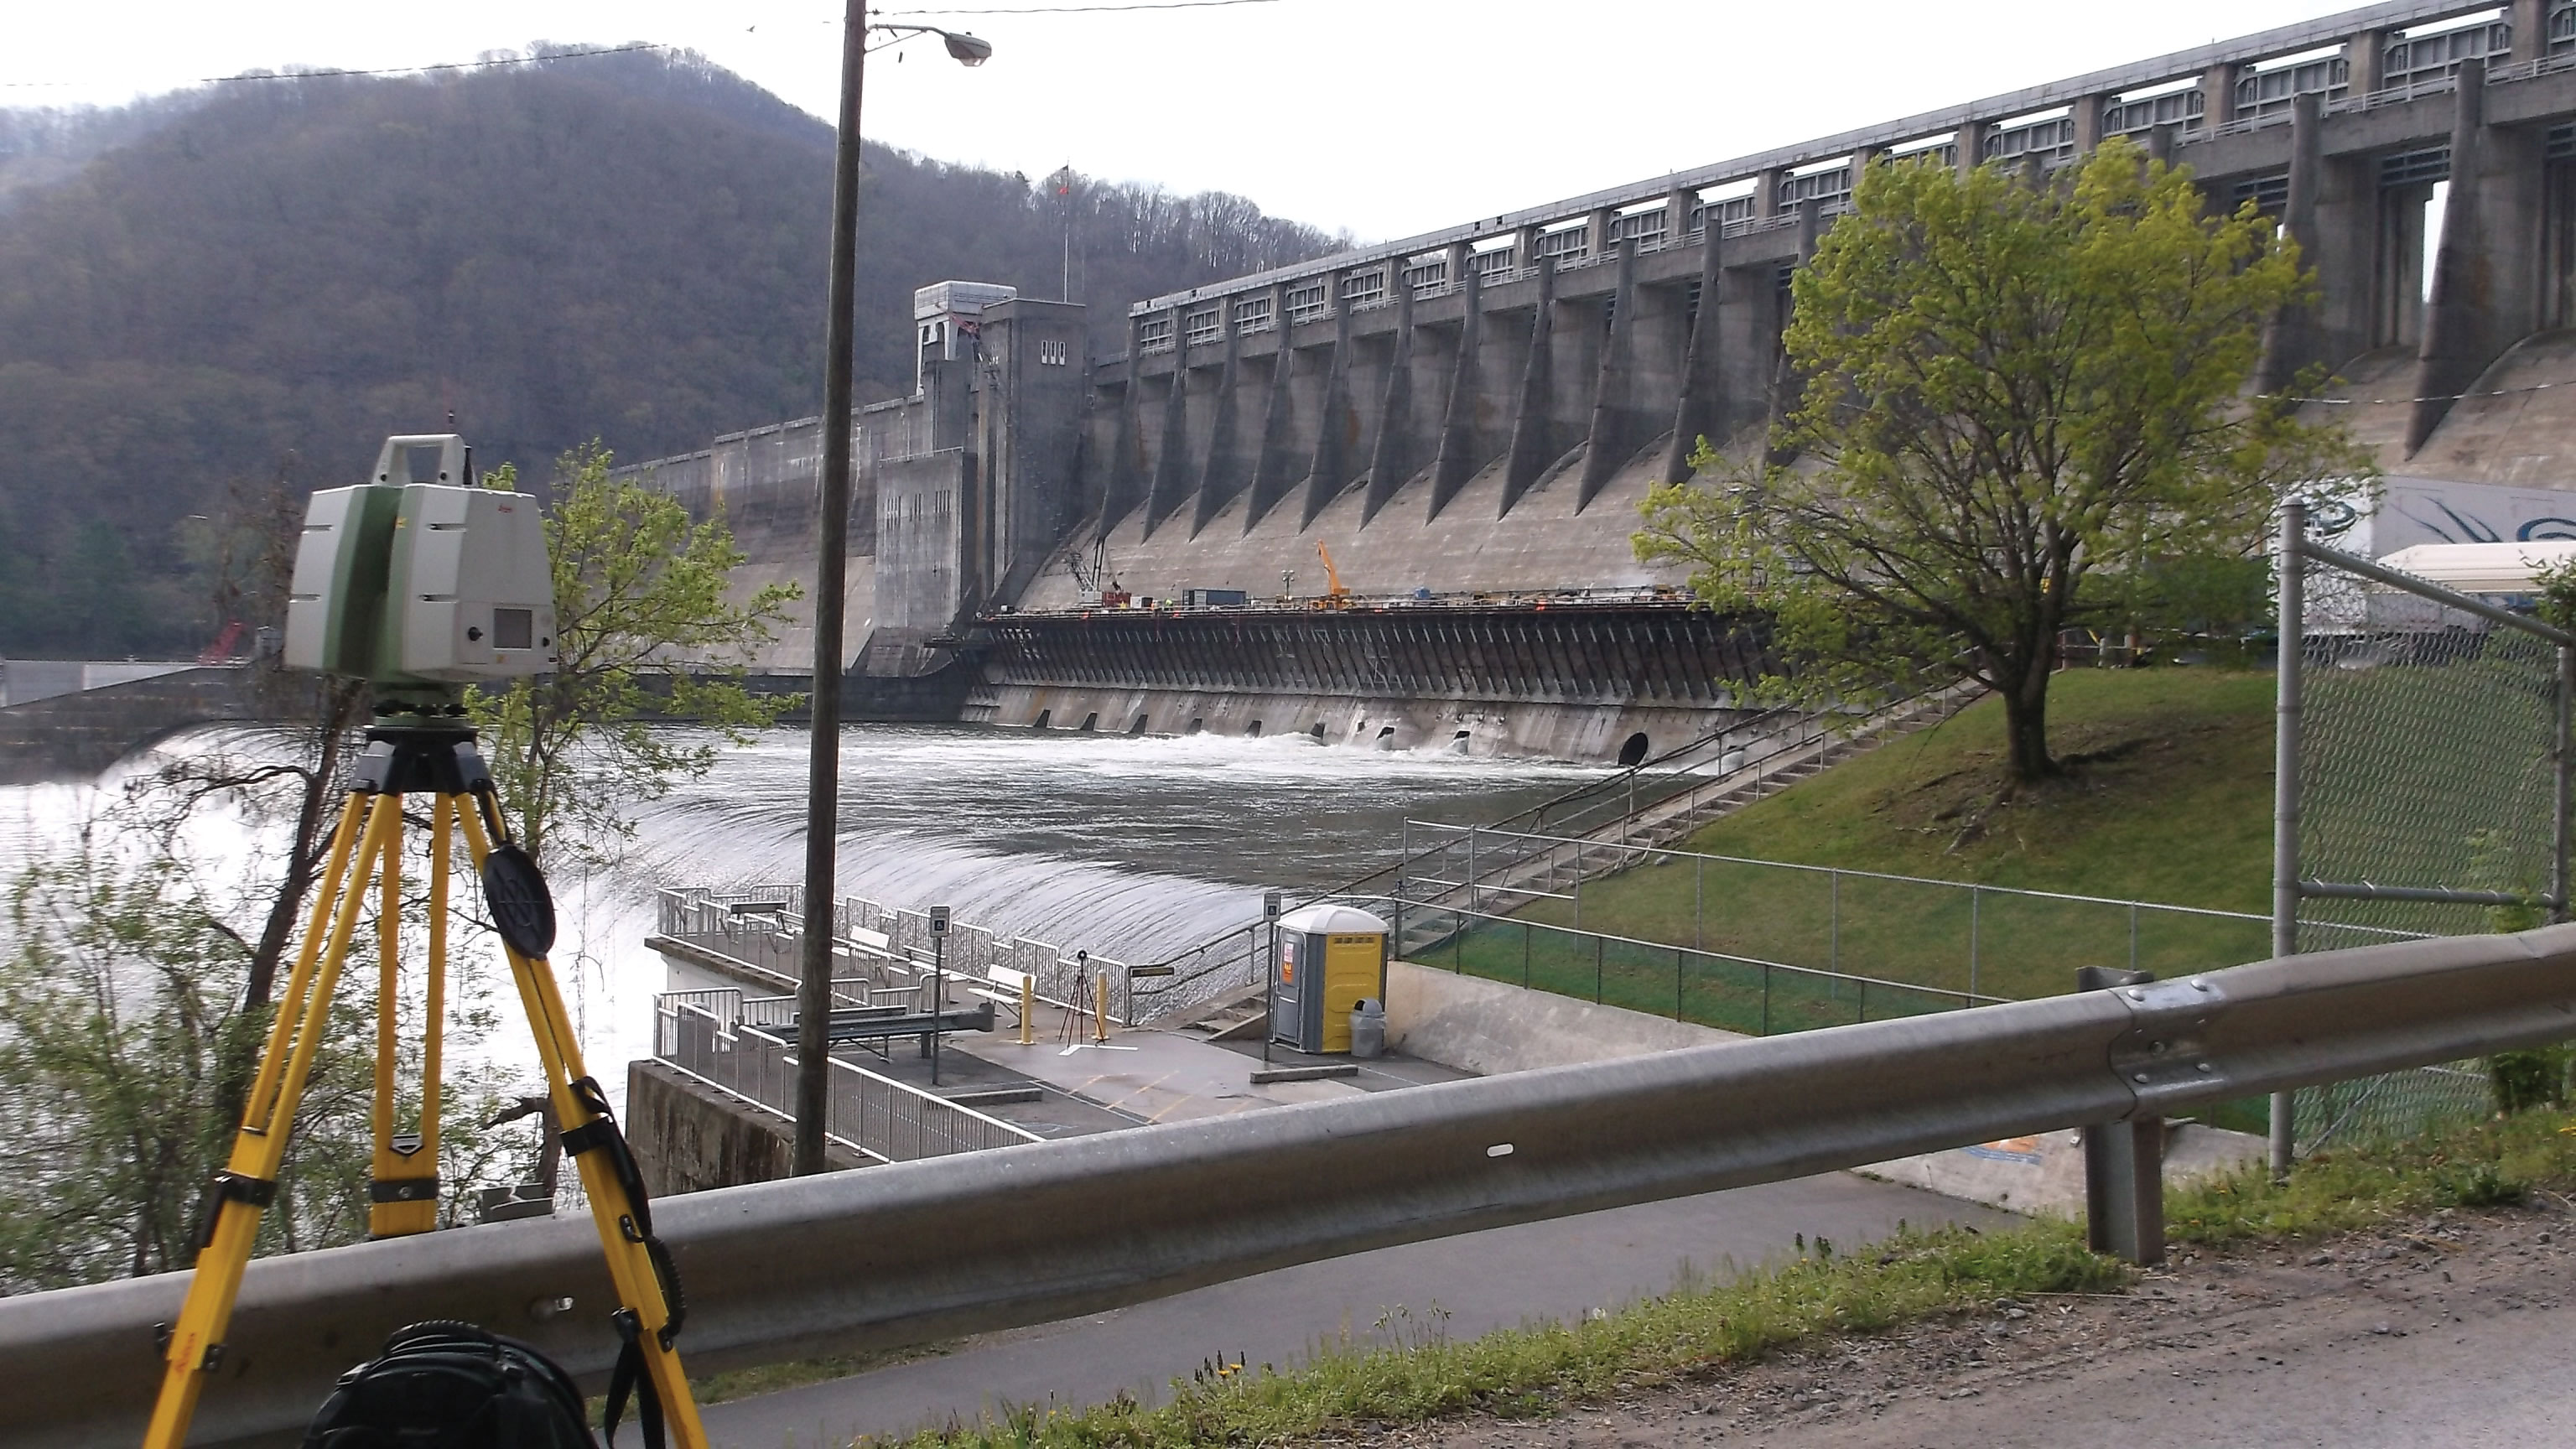
“One of the most critical parts of this project was to laser scan the downstream concrete weir,” says Damon L. Wilkewitz, a professional surveyor and ASI’s manager of high-definition surveying. “Because water continually flows over the weir, the Corps had to shut off the flow of water through the dam to expose it. The Corps was only going to stop flow for a window of four to six hours to minimize impact on the downstream wildlife. We were given just four hours to scan the structure before the water flow was restored.”
Due to shallow portions of the downstream river, it was not possible to perform a hydrographic survey with a boat. So, the Corps tasked ASI with surveying conventional cross sections across the river bottom downstream. The ASI team used a GNSS RTK system to place control points along the river banks in order to do conventional locations. Two field crews worked simultaneously to cover the site and do the cross sections.
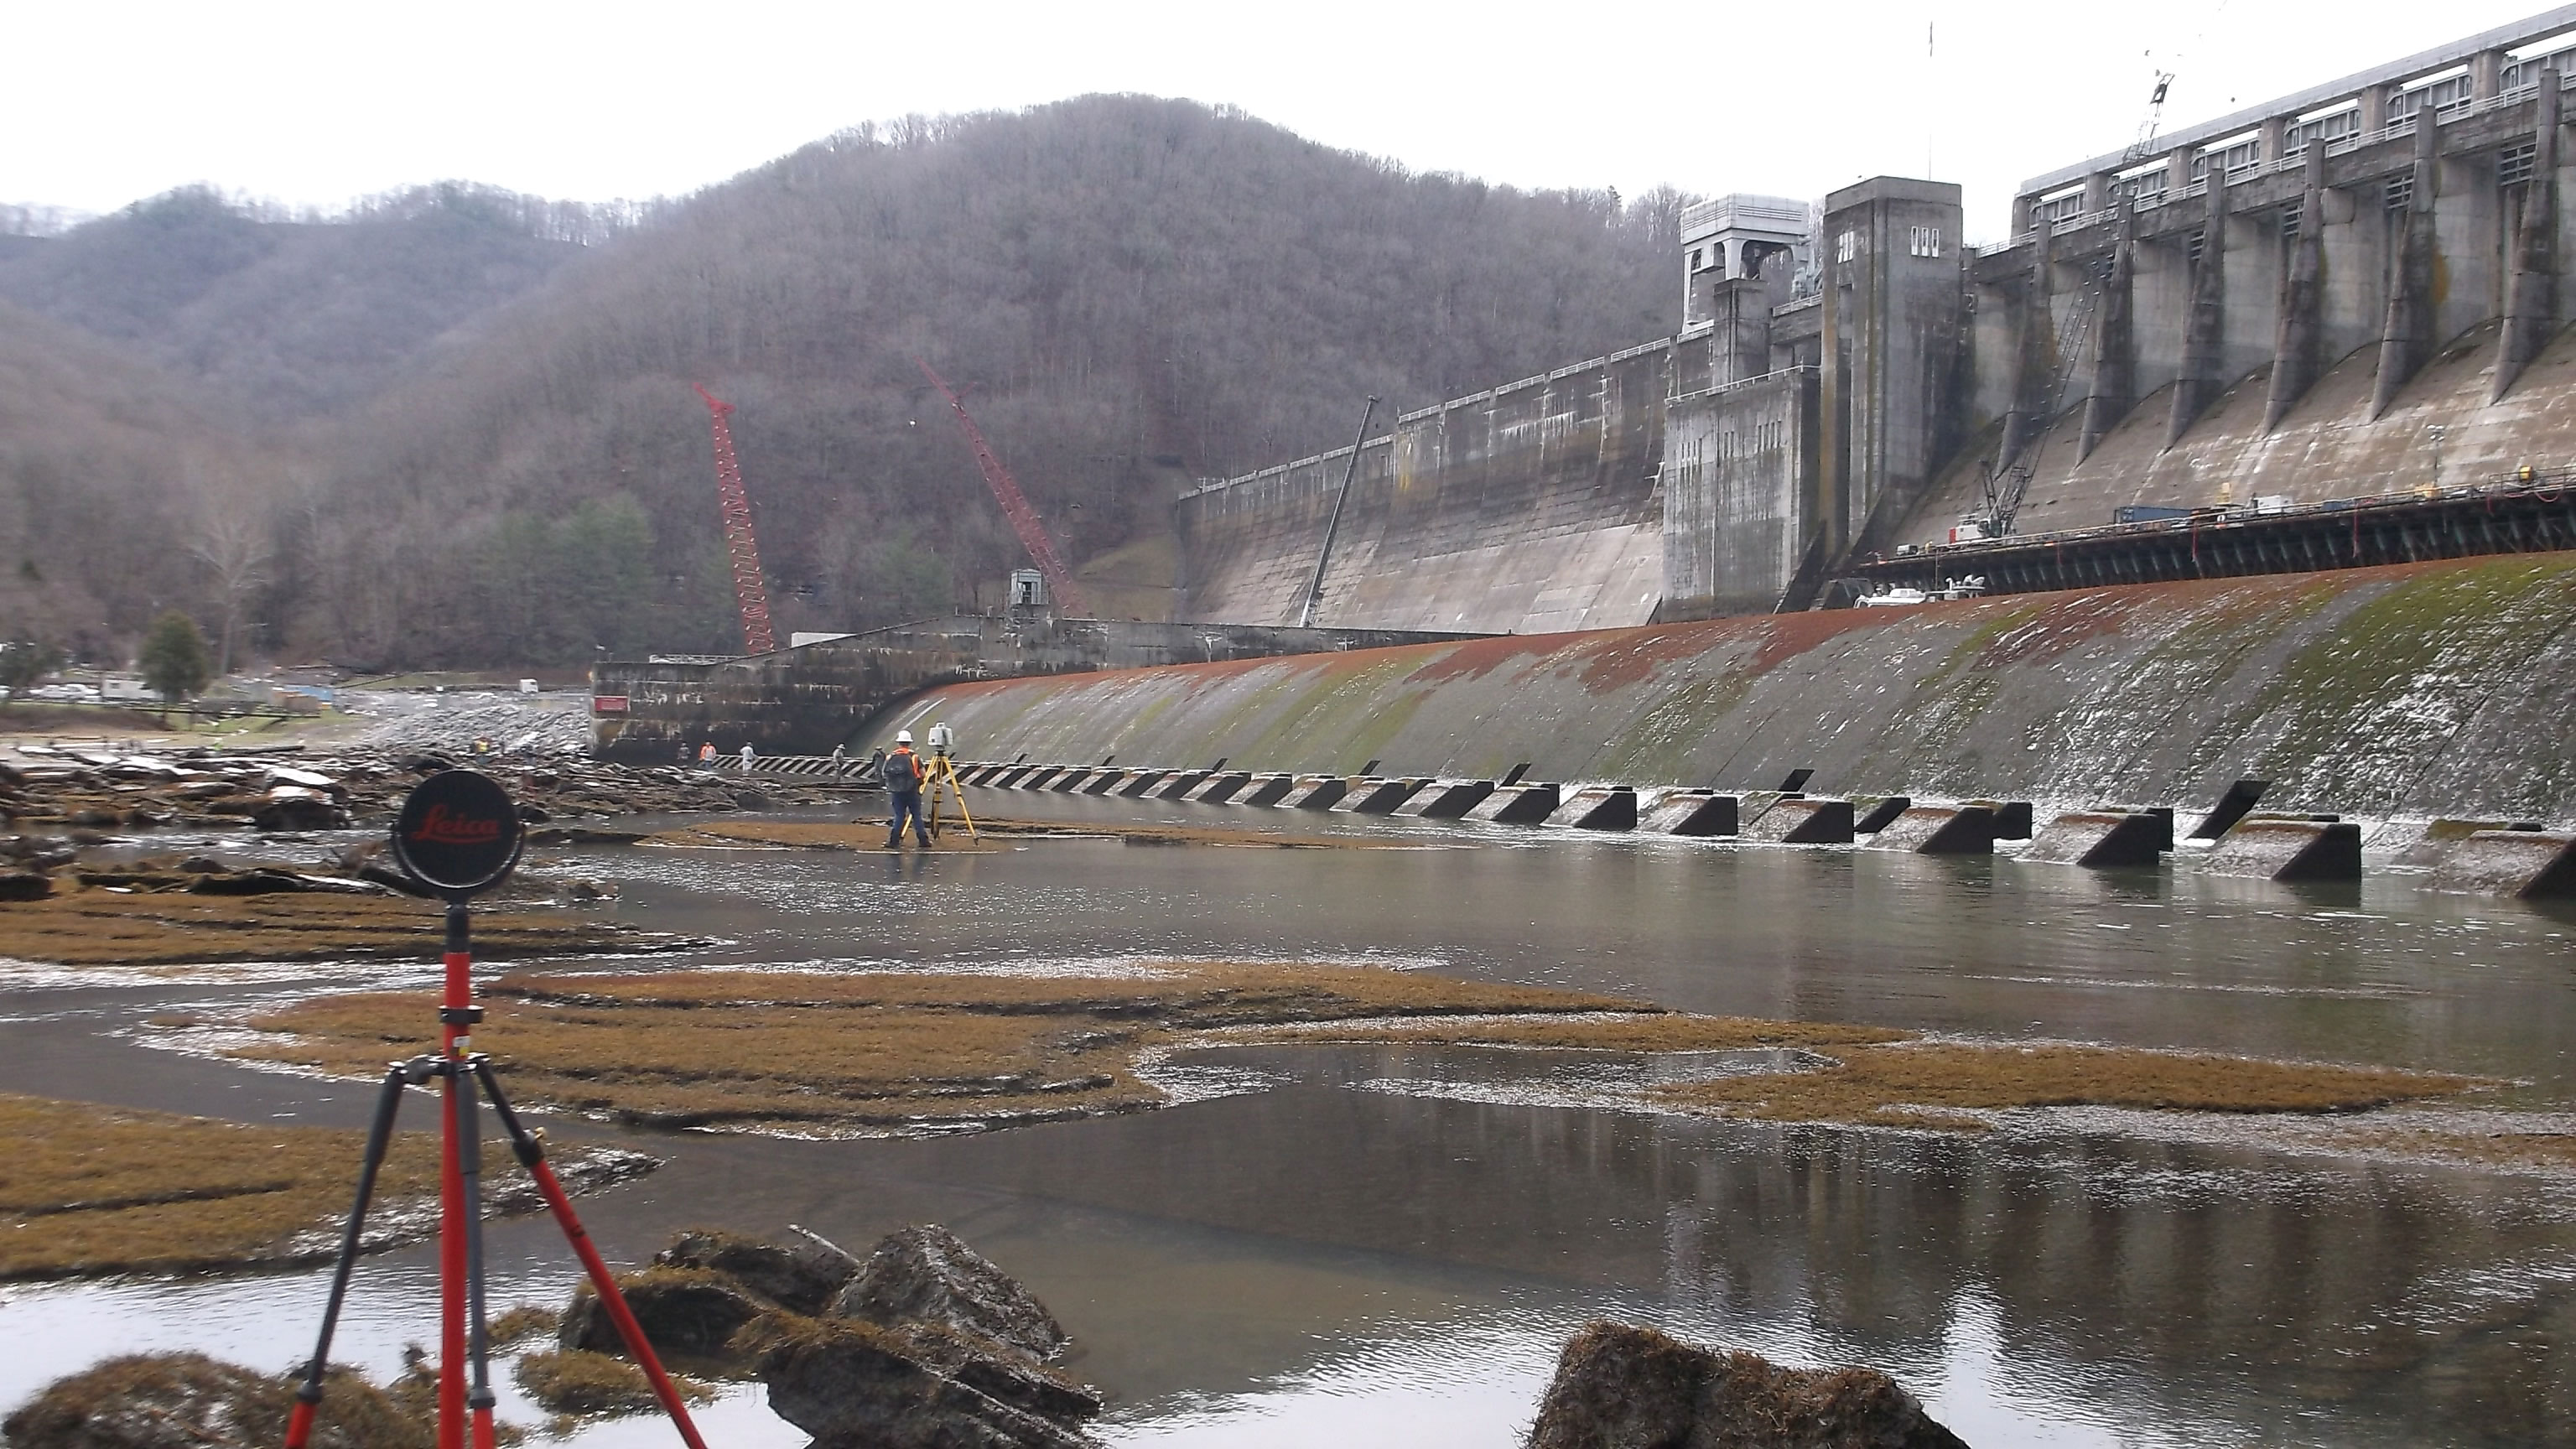
Scanning the downstream weir—with the water flow shut off—had to be completed in less than four hours to minimize impact to wildlife.
When the Corps shut the water flow off, the ASI team immediately began to place targets across the river. Coming off of existing control points on the river’s west bank, it used the intermediate targets it had placed in the river and tied back in to existing control points on the east bank, completing the job in three and a half hours.
While the ASI team scanned the exposed weir and concrete baffles, the SEAS team performed a hydrographic survey of the basin between the downstream toe of the dam and the weir. The two teams coordinated their efforts because both surveys needed to be done when the water level was at its lowest.
“As the water level went down, large rocks became exposed and we were able to set our laser scanner on them,” Wilkewitz recalls. “The river rocks were very slick, and we had to be careful with our footing. Innumerable crayfish covered the exposed river bottom, and it was difficult not to step on them. Some fish had become trapped in pools of water. A couple of Corps employees were on hand to toss the flopping fish into deeper pools. One lone gate was left open to keep a minimal amount of water flow.”
In order to manage the overwhelming amount of scan data, the ASI surveyors divided the project into several “scan areas.” This helped them manage the point cloud registrations and tie the points into the state plane coordinates.
“Each area was constrained to its ‘neighborhood control,’ and when we put all the point clouds together into one large unified cloud, we tied everything down properly to all state plane control points throughout the entire 48 acre site,” Wilkewitz explains.
A construction platform built below the flood gates gave the ASI team a great vantage point.
The ASI team also performed additional higher resolution scans of the dam on both the downstream and upstream sides. It used a Leica C10 ScanStation for this project because of its great targeting range and scanning range. “It was ideal for scanning such a large dam as this one,” says Wilkewitz. The scanning of the dam and surrounding areas took 33 days.
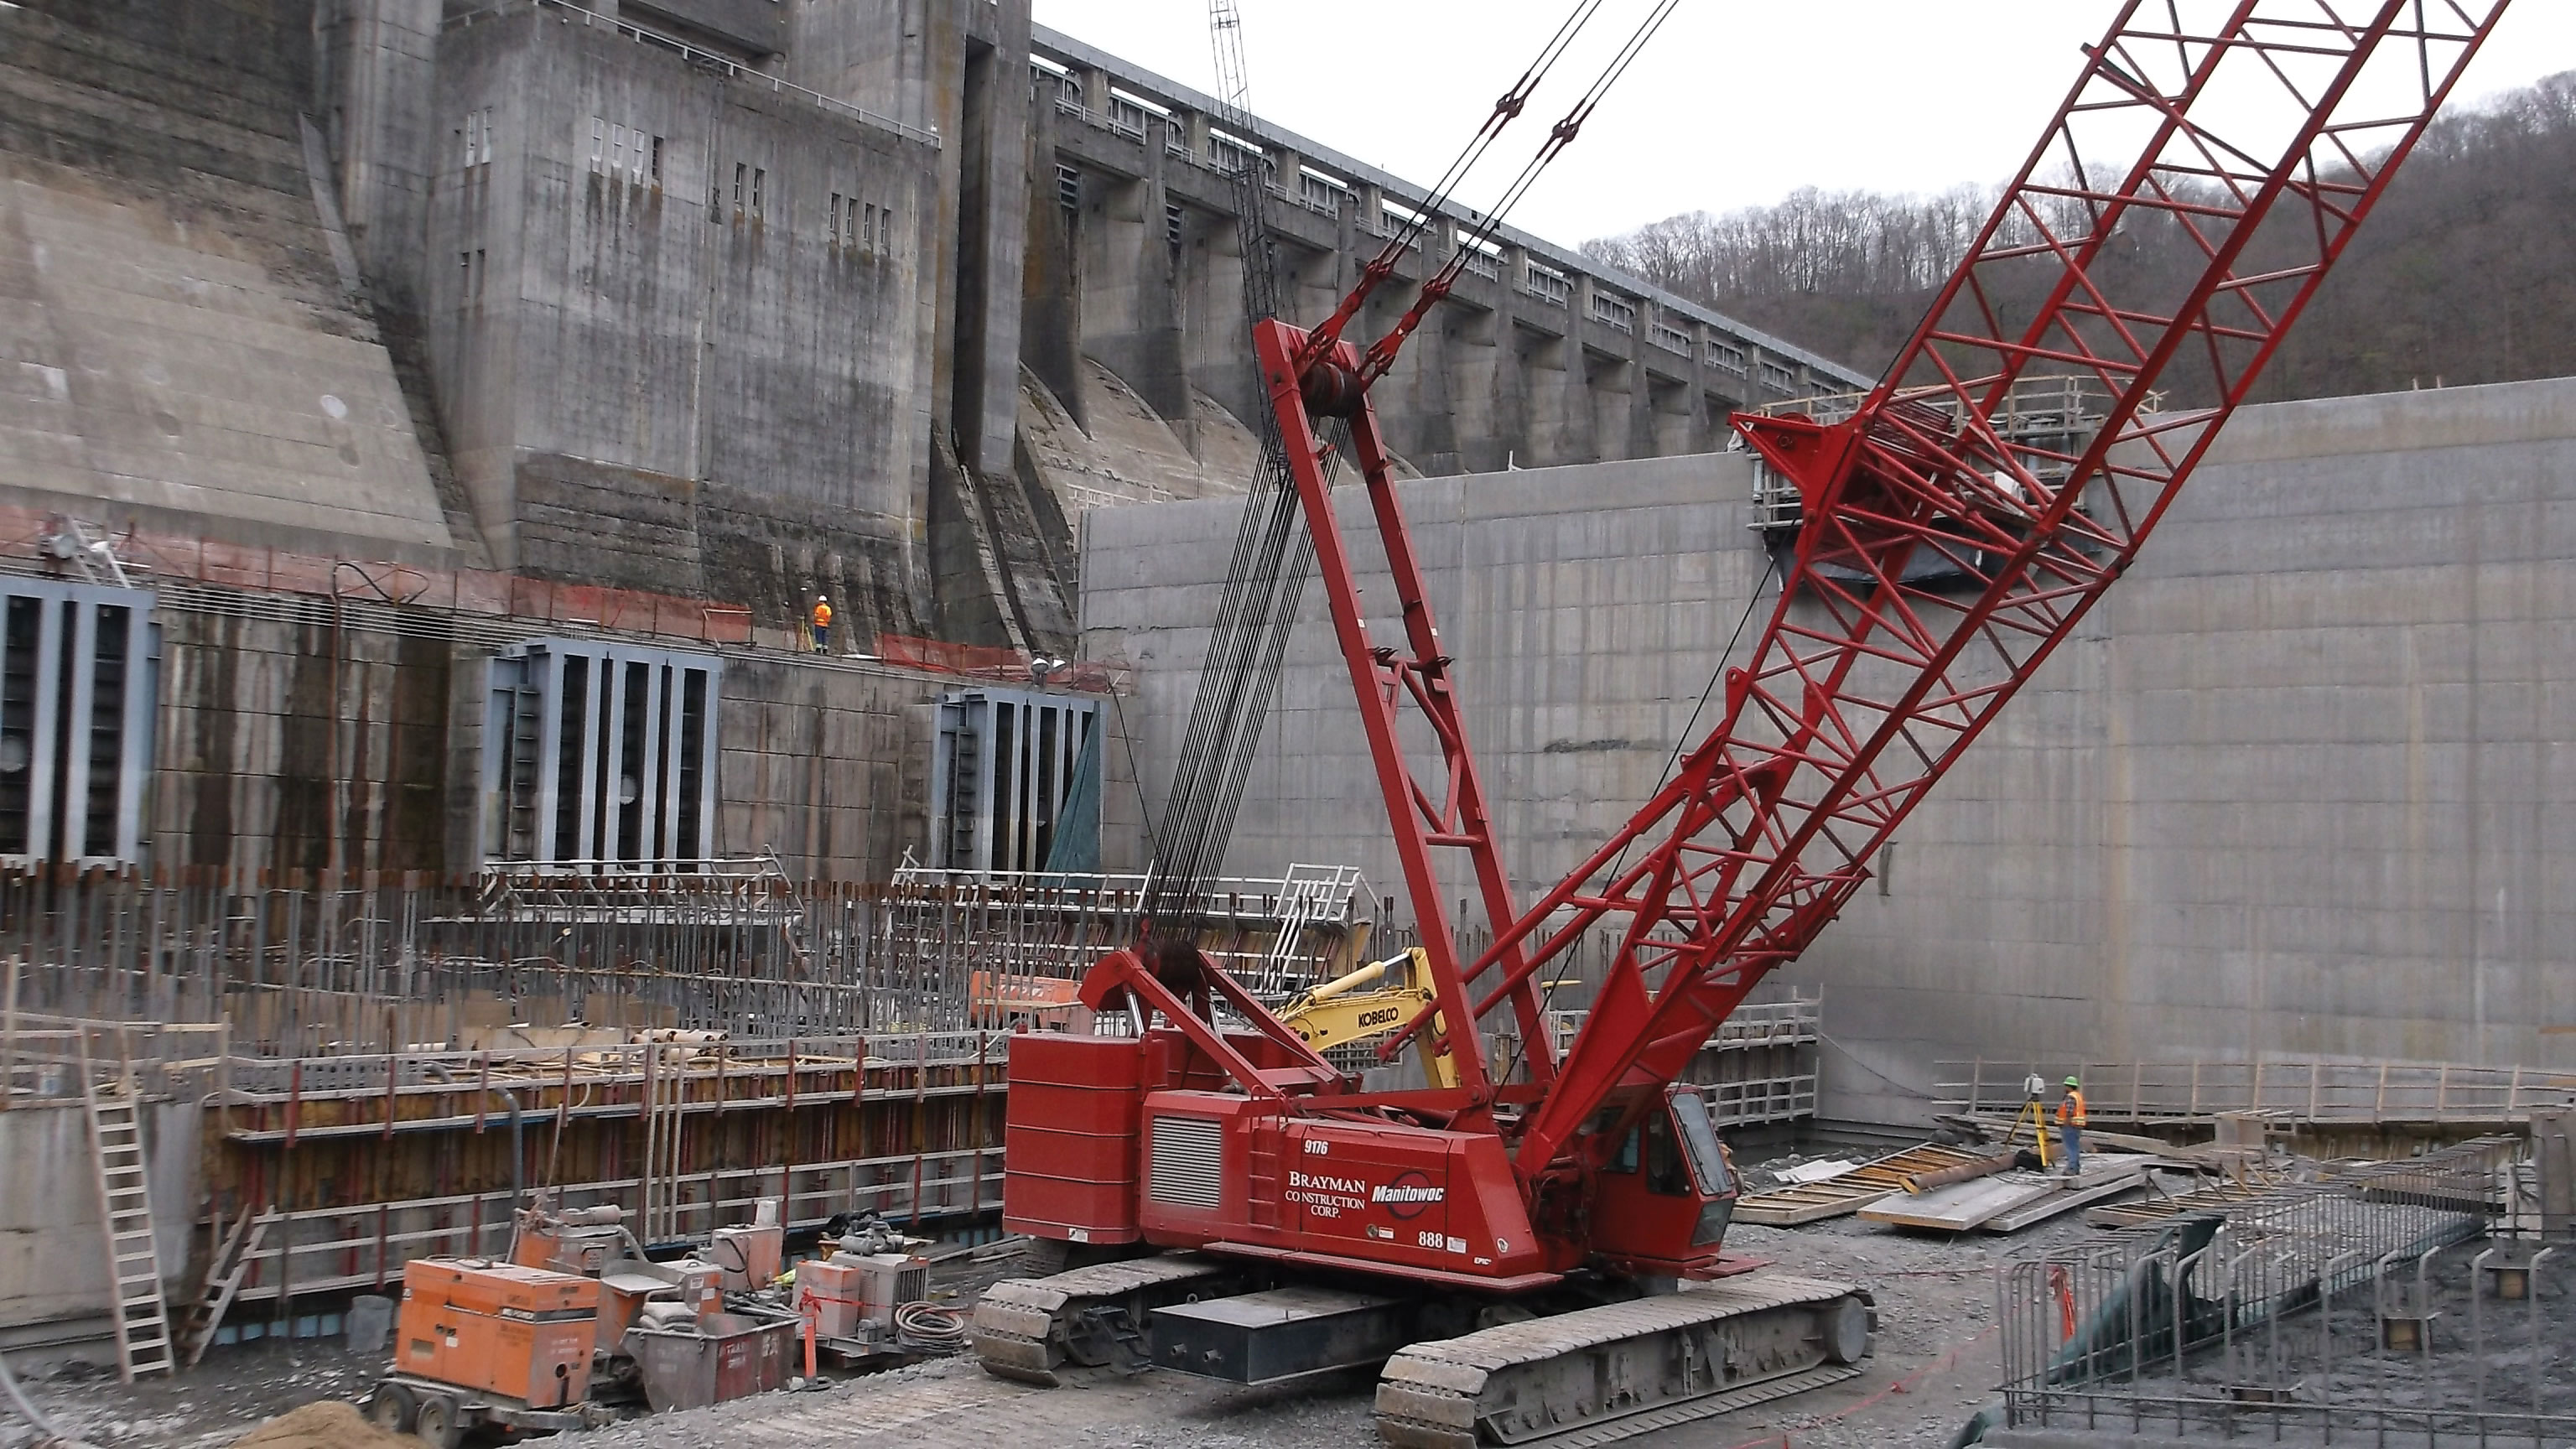
Working with construction
Cranes and construction crews were working on the dam, and another contractor was working on a major construction project on the eastern downstream half of the dam, so the ASI team had to coordinate with the construction company and the Corps. A construction platform built across the downstream side of the dam below the flood gates gave the ASI team a great vantage point from which to scan the downstream side of the dam.
The Corps asked ASI to also scan the construction area, the office building area, the access road down to the fishing pier, and the downstream east bank from the dam to the park.
For control ASI used existing USACE concrete monuments and brass disk control points located throughout the site. The Corps added additional control points for them as well. All of ASI’s scans were constrained to these control points, and the final deliverable was placed on the WV Coordinate System of 1983, South Zone (US Survey Feet). ASI did a total of 178 scan setups for this project.
The final deliverables had a total size of 87 gigabytes. “We provided a unified and colorized point cloud which was divided into seven separate LAS files due to their size,” says Wilkewitz. “The deliverables also included Leica TruViews of the entire site and an AutoCAD and MicroStation drawing showing the conventional cross section data, DTM, and topographic map.”
Mobile Mapping and Bathymetry

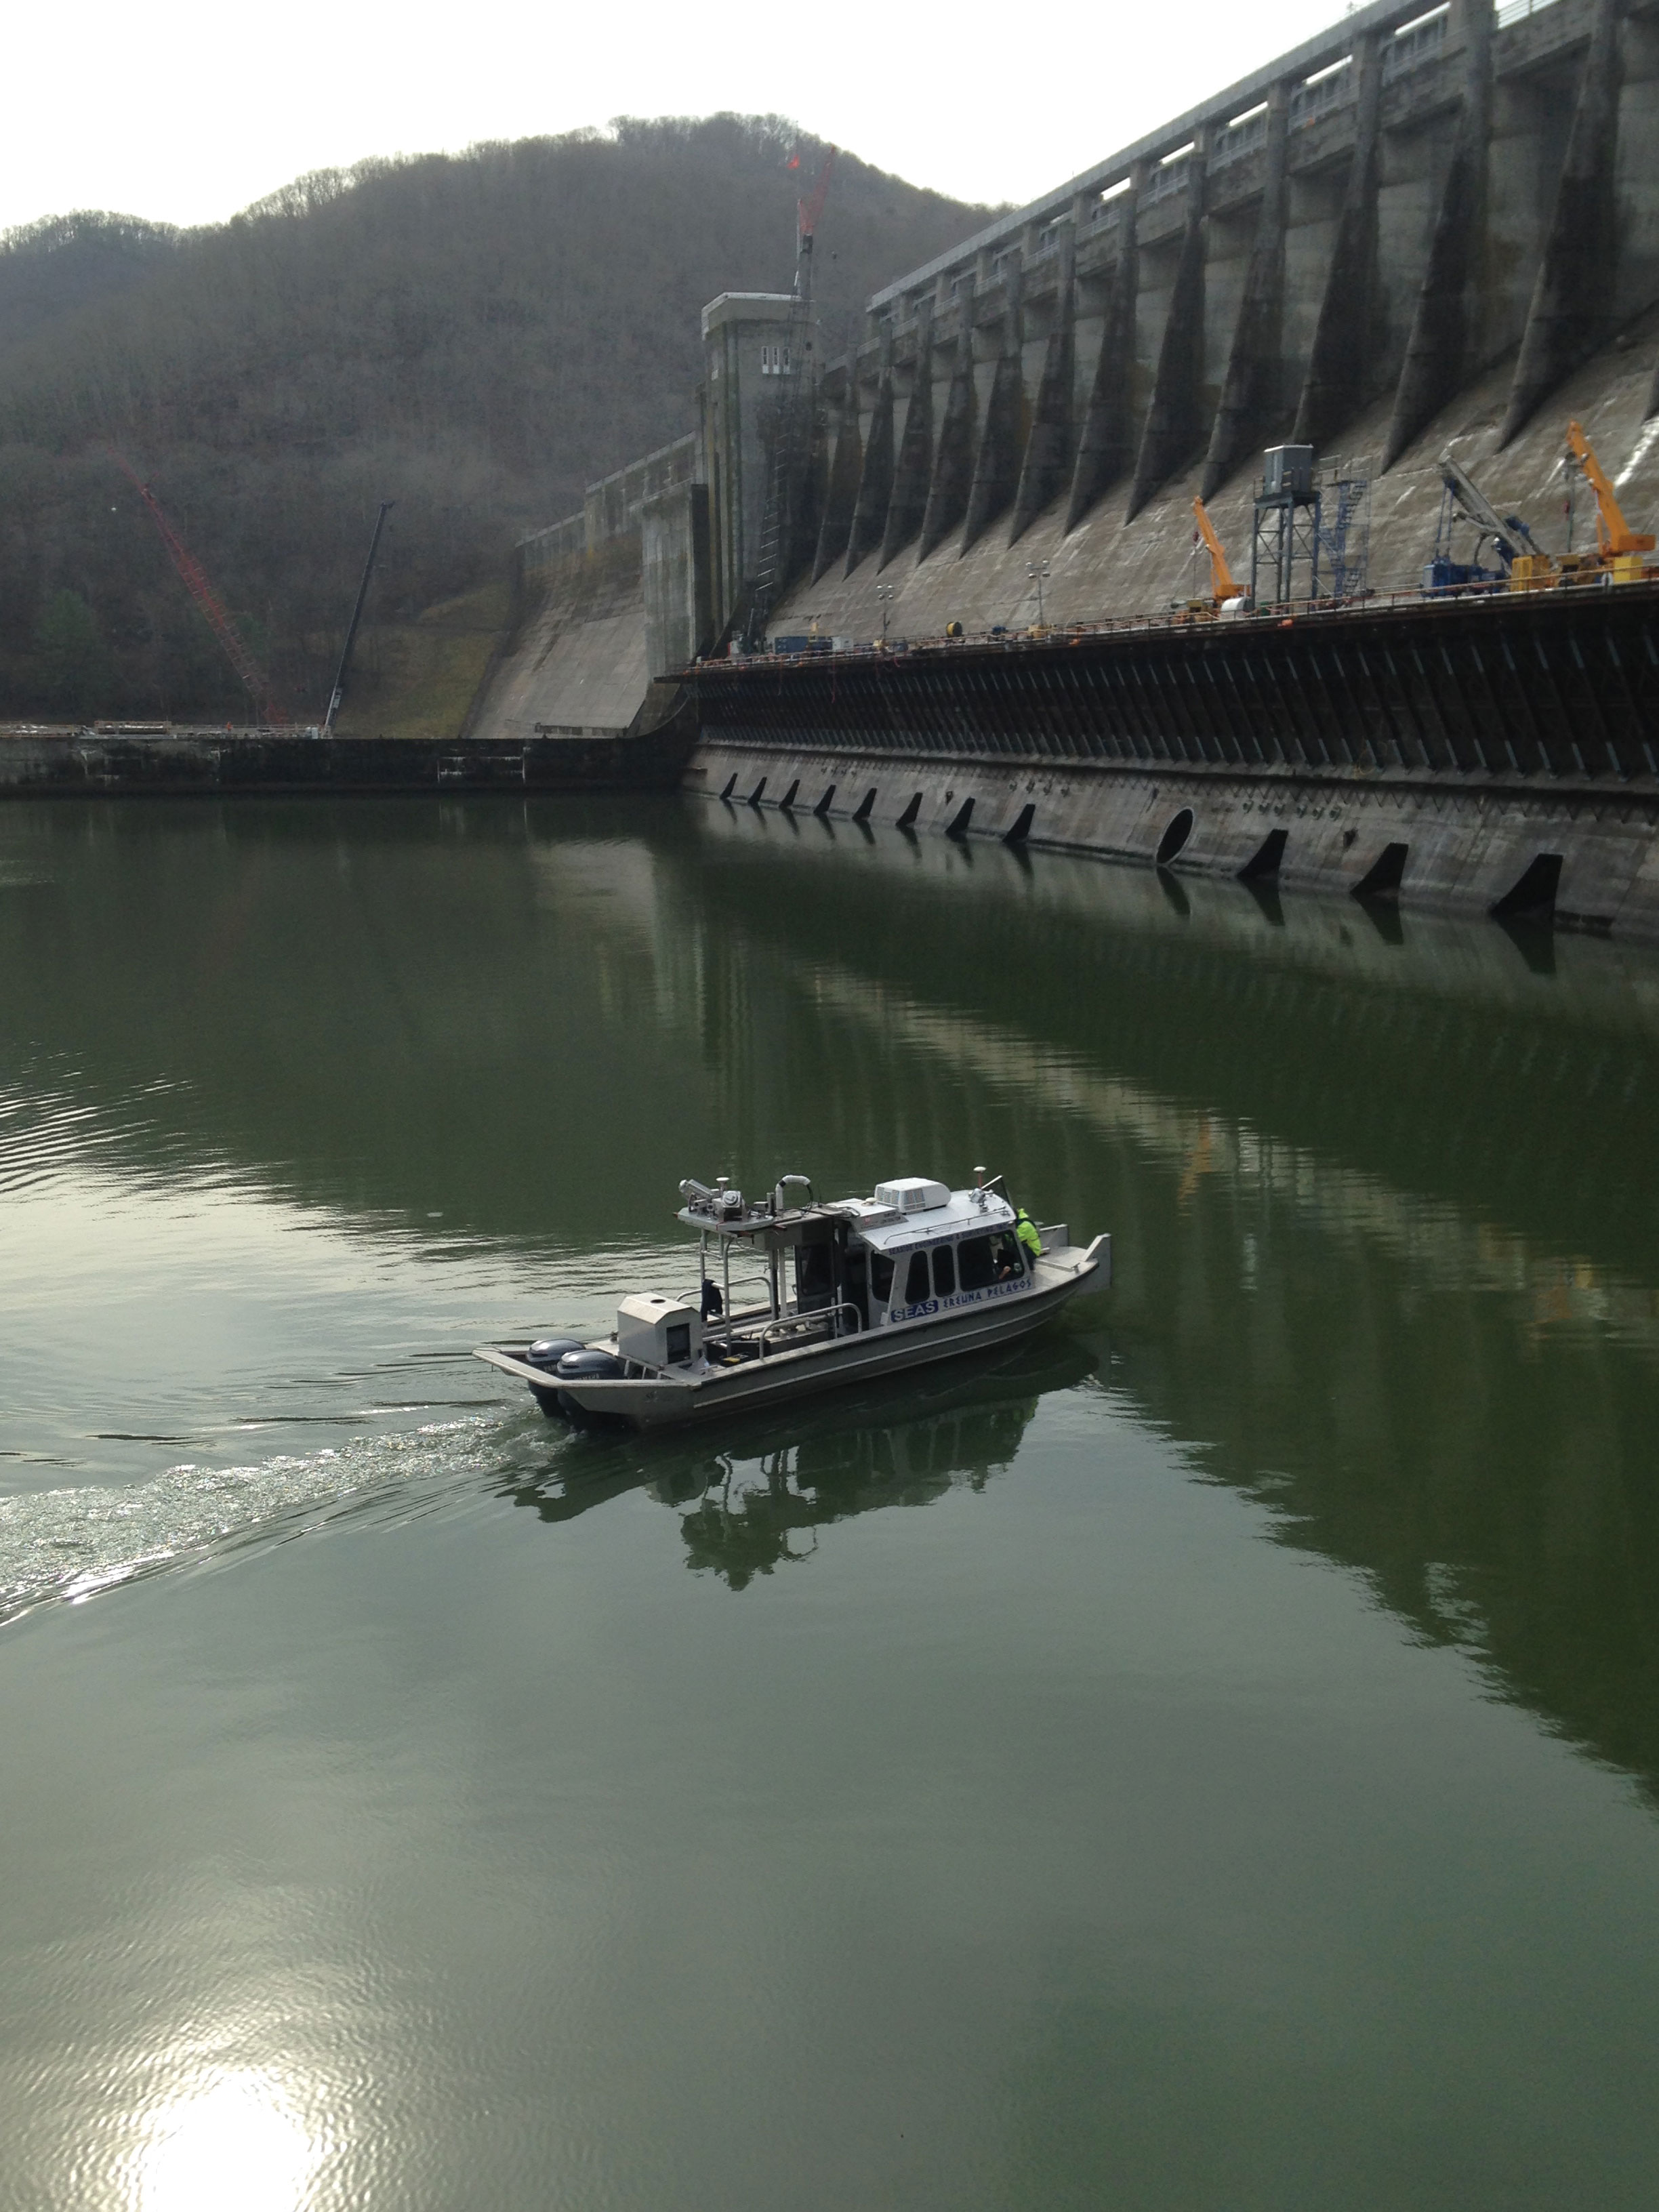
John Gustin, IV, president of SEAS, on his survey vessel.
Seaside Engineering and Surveying, LLC (SEAS)’s role in the Bluestone Dam project included providing detailed 3D scans and georeferenced imagery of the upstream face of the dam, the downstream face of the dam, and the structures such as training walls surrounding the stilling basin, with a minimum of 36 scan points per square foot of surface.
It also included detailed 3D scans and georeferenced imagery of the entire lake shoreline (about 24 miles), performed at the winter pool elevation of 1,406 feet, and a detailed 3D bathymetric and side-scan sonar survey of 3,000 feet of the lake immediately upstream of the dam, the upstream face of the dam, and the stilling basin, with a minimum of five points per square foot.
Mobile mapping
To achieve this, SEAS used a variety of tools. To collect the scan data on the upstream face of the dam, it installed a Lynx M1 mobile mapping system on its survey vessel. The M1 is a dual scanner configuration lidar system that greatly reduces shadowing and is capable of collecting one million points per second. It also includes four 5 MP cameras that collect georeferenced imagery at a rate of 1 to 2 seconds per frame, a GNSS receiver, and an Applanix POS LV 420 inertial measurement unit (IMU) and distance measurement indicator (DMI). SEAS processed the lidar data and imagery using Optech’s DASHMap software and edited it in MicroStation with TerraSolid TerraScan, TerraMatch, and TerraPhoto.
Bathymetry
To collect the bathymetric data, SEAS employed a RESON SeaBat 7125 SV multi-beam echo sounder, which is a high resolution dual frequency system with a maximum swath angle of 165° and 512 beams that can also be focused in a specific direction. It is capable of collecting 25,600 points per second and has a depth resolution of 6 mm. An Applanix POS MV Wavemaster integrated GNSS and IMU supplies the multibeam system’s position and attitude. SEAS collected and processed all the data using Hypack/Hysweep software.
To collect the underwater imagery, SEAS used an EdgeTech 4125-P high-resolution, dual-frequency sonar system, with internal sensors that measure the roll, pitch, heading, and depth, deployed on a fixed mount for the stilling basin and towed with a 50-meter cable in the area above the dam. It collected the data with EdgeTech DISCOVER software and processed it with Chesapeake Technology, Inc. SonarWiz Map software.
GNSS
SEAS had to
have operators on board to deploy the multi-beam side-scan sonar and the
mobile lidar
system and to collect the data.
For the entire survey, SEAS used a post-processed kinematic (PPK) system. It collected static observations with Topcon GR3 and Trimble R8 dual frequency GNSS receivers. It post-processed the base station data, logged at one-second intervals, with Applanix POSPac software data to create a smoothed best estimated trajectory.
“The Bluestone Lake and Dam survey was challenging on a number of fronts,” says professional surveyor John C. Gustin, IV, the president of SEAS. “Coordination of the survey effort with USACE was critical. The lake shoreline had to be scanned at the lowest possible pool elevation, which required a drawdown of the lake. The survey vessel had to be lifted into the stilling basin by crane, but first the dam gates had to be closed to completely stop the flow of water.”
The four hours that the survey crew had to complete the survey work in the stilling basin included the time required to lift the vessel into it. Therefore, in order to complete the survey in the available time, SEAS had to have operators on board to deploy the multi-beam side-scan sonar and the mobile lidar system and to collect the data. To board the survey boat in the stilling basin, the survey crew had to climb down a 30-foot ladder well in harnesses.
To produce the final product, SEAS had to merge the lidar data and the multi-beam bathymetry data, which was delivered in LAS and ASCII format. It delivered the georeferenced imagery as hyperlink files for CAD, Google Earth, and ArcGIS, together with a SEAS proprietary image viewer. It delivered the side scan-sonar imagery in individual-pass georeferenced TIFF images and mosaics. It published the survey control established during the survey as OPUS DB and delivered it in USMART format, together with a detailed survey report and a metadata file.
“The survey was completed on time, within budget, and without incident,” says Gustin. “Mack McCarty did an incredible job coordinating and making things happen when they needed to!”
Building the 3D Data Management Plan
The Huntington District will hire a contractor to build the 3D database and import into it the data gathered by the three teams. “Our goal is to build a 3D, geospatial-based data management plan,” says McCarty. “It will be a hybrid of a GIS (geographic information system), a BIM (building information model), and a CIM (civil information management). At some point in the future, someone will be able to click on one of these anchors that we are installing in a 3D view and find out when the anchor was drilled, the test results for the concrete or the grout that was used, and the results of the stress test on the steel inside the anchor.”