On Earth, photogrammetrists can normally use man-made objects in their frame—such as a road of known width or a curb of known height—as scales. When none is present, they can insert such “ground truth” as needed—for example, by placing onto surveyed locations targets that will be visible in their images. On other planets in our solar system, however, such human artifacts are not (yet) available to photogrammetrists—nor can they easily move cameras around to generate many images of the same spot from different angles.
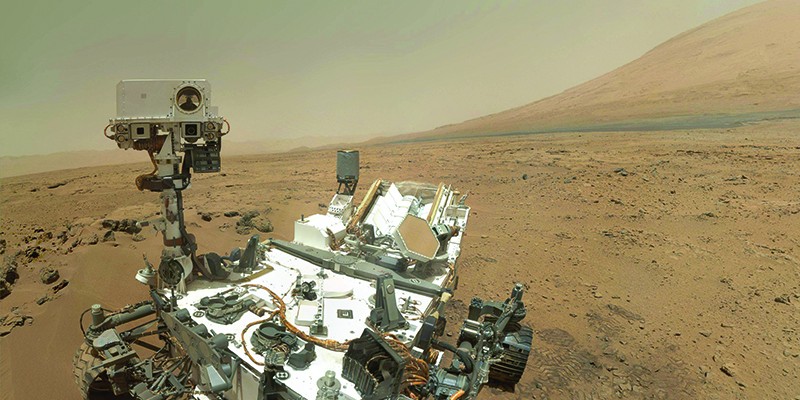
When NASA’s Marshall Space Flight Center wanted to measure the depth of the craters created by the Curiosity rover’s landing in Mars’ Gale crater from photographs taken by the rover’s two navigation cameras (navcams), the only high-precision scale information that photogrammetrists had was the distance between those cameras. The only other control data they had was the width of the rover tracks, which were visible in some of the imagery. To solve this puzzle, Cardinal Systems, a mapping software developer, created sophisticated new algorithms; these can now also be used to extract accurate measurements from photos taken with inexpensive consumer cameras and/or from unstable platforms, such as small unmanned aerial systems (UAS) in strong winds.
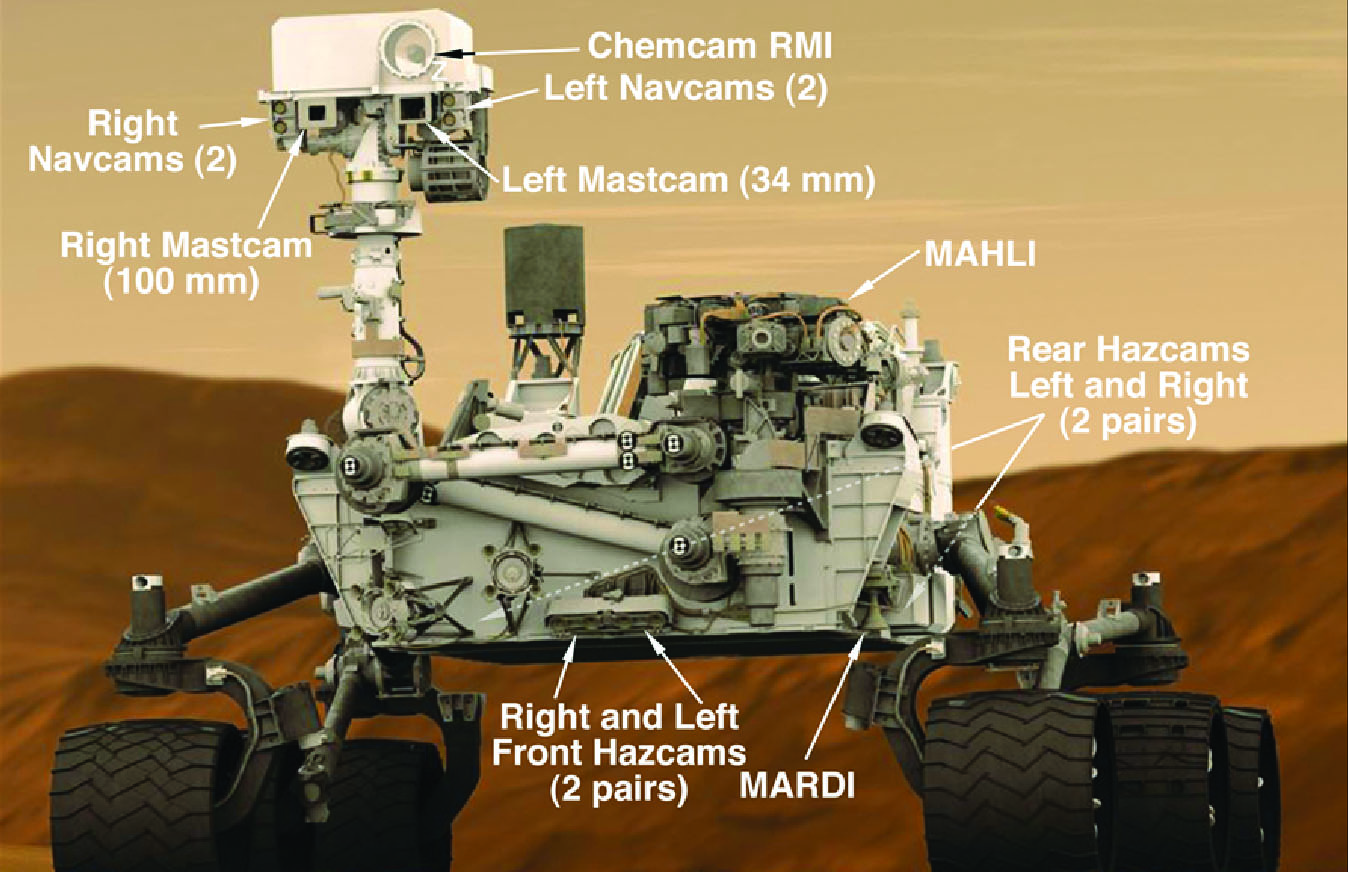
There are 17 cameras on NASA’s Curiosity rover, including seven on the mast and one at the end of a robotic arm that’s stowed in this graphic. Courtesy of NASA/JPL-Caltech.
NASA’s Goal
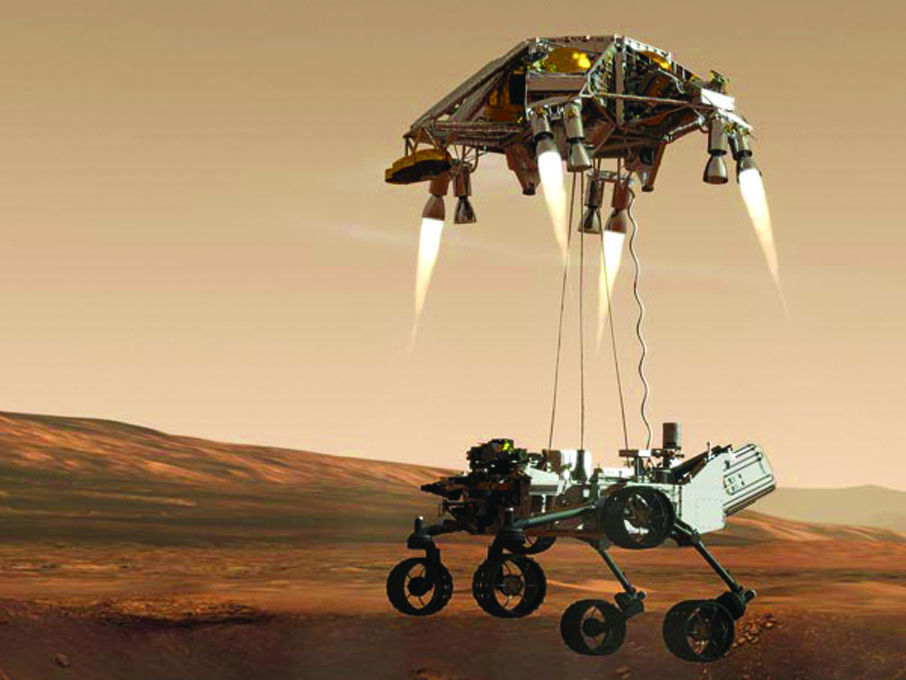
NASA designed the landing of the Mars Science Laboratory so as to minimize its impact on the planet’s surface and avoid kicking up materials that could end up on the Curiosity rover. To keep the rocket motors away from the surface, the final portion of the descent was performed using a sky crane that hovered at about 25 feet and lowered Curiosity down on cables (see sidebar, page 26). Nevertheless, the sky crane’s four rocket engines created four small craters. NASA wanted to know the depth of these craters, as well as the depth of the craters created by the Apollo Moon landings and by the Phoenix Mars Lander that landed in 2008 near the north pole of Mars.
“I have a feeling that they’re trying to put together a database of what types of rockets will kick up what type of material in these environments,” says Mike Kitaif, co-owner and manager of software development at Cardinal Systems. “Maybe it’s to help design future rockets or landing systems.”
Technical Challenges
When it took the photos, the rover was stationary. It rotated by 180° its remote sensing mast on which the navcams are mounted so as to take a panorama consisting of 10 divergent images in five stereo image pairs. The navcams have 15 millimeter focal lengths and CCDs—charge-coupled devices, the guts of digital cameras—with 1024×1024 pixels. The cameras’ base line—in this context, the vector between their perspective centers—was 42.4 centimeters. The length of the vector has a large impact on the effective range for mapping. The stereo image pairs were highly oblique (pointed 75° off nadir), and there were 45° of rotation between each pair.
“This does not present the best situation for photogrammetry, and we had to make the mathematics to handle this,” Kitaif explains. “Instead of convergent geometry, where the cameras tend to point toward an object, we had divergent geometry, where you have a central point and the angles are divergent from that central point. So, this part was challenging. Also, what you can see from the photography are highly oblique camera angles.” Items in the cameras’ fields of view range in distance from several centimeters all the way to the mountains on the horizon, and approximately half the field of view was behind the craters.
In the craters, the intersection angles of the tie points—measurements of the same object in multiple images that “tie” the images together—varied from 0.3° to 4.7°, and 30% to 40% of them had intersection angles of less than 1°. “Thus, even in the craters some of the mapping is on the edge of what is possible, and possibly ill advised,” explains Orrin Thomas, a photogrammetrist at Cardinal Systems. “However, NASA was interested in volumes which, because they are calculated from many points, are reasonably forgiving of large uncertainties in individual point coordinates.”
Sufficient knowledge of Curiosity’s shape and of its robotics telemetry data—encoder records of the rotations and positions of the mechanical actuators for a robot’s various parts—would have made it possible to directly calculate the approximate positions and pointing of the cameras. Thomas had used similar telemetry data from the Space Shuttle and Space Station robotics in his previous work. While in this case these data would not have alleviated the extremely poor point geometry of the images, had they been sufficiently accurate they may have made it possible to tackle the problem with existing software. However, those data were not available.
Extracting measurements from photographs taken at extreme angles, from unstable platforms, or without reliable initial values is a very complex task. “We’ve gotten away with doing a lot of aerial mapping and other processing in the past because we could make several simplifying assumptions about the geometry,” says Thomas. “The cameras were looking at the ground within about 3°, because if they were off nadir by more than 3° you flew it again. The cameras were lined up, and the overlaps were very predictable. All of these simplifying assumptions make a difficult 6-dimensional, non-linear problem much more tractable.” A robust solution, he explains, must be general enough to solve all of these problems in the same way.
Without man-made objects on the surface, it is also very hard to establish the exact attitude of the rover—that is, its orientation with respect to a frame of reference—and, therefore, the attitude of its cameras. Fortunately, that does not matter much. “We get the object space in which the images are scaled,” Thomas explains, “and then we can rotate it however we want to, to make it convenient.” Getting “up” in more or less the right direction makes it easier for humans to interpret the images.
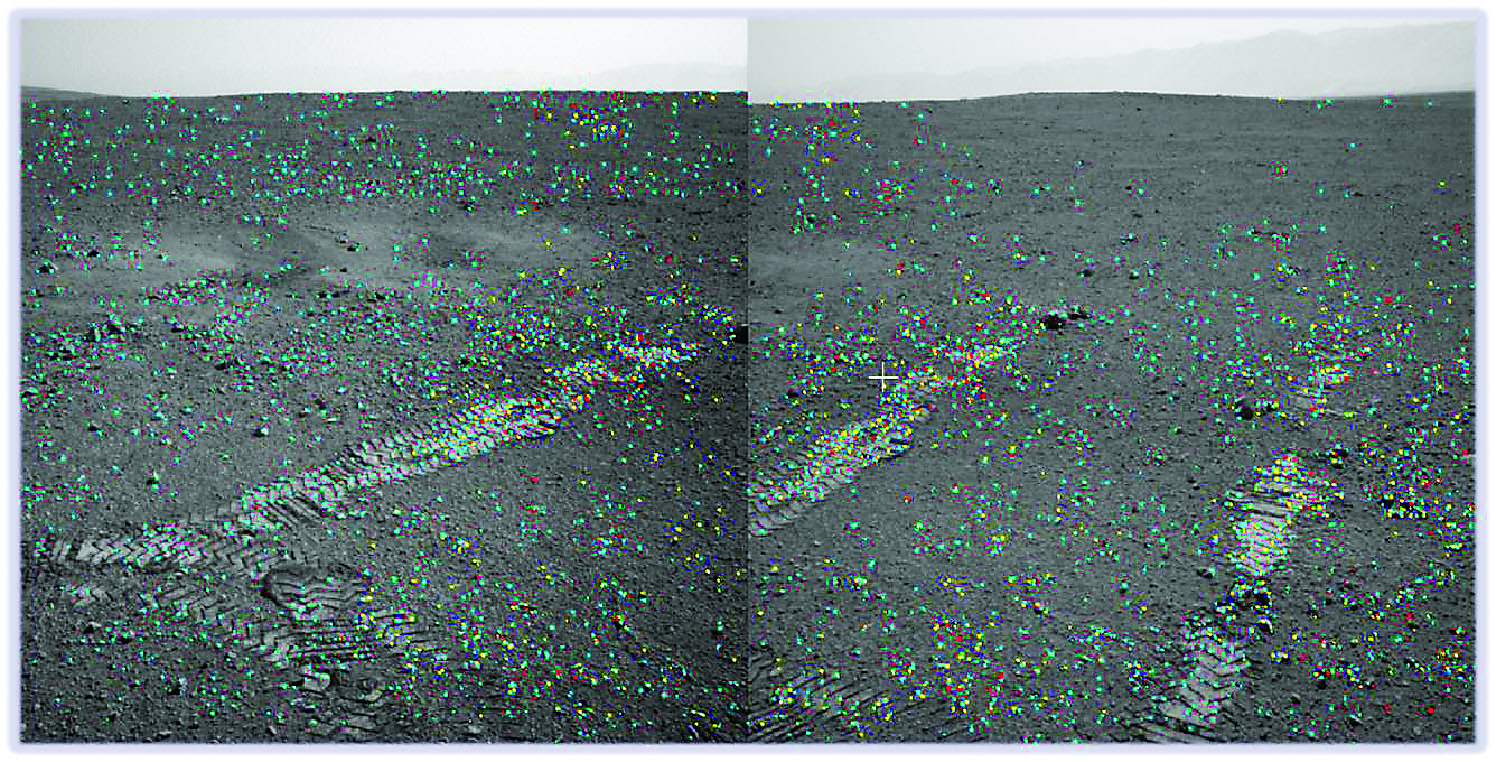
Automatically derived conjugate points on undisturbed ground around the craters and tracks were used to define an approximate level plane whose normal defines the depth axis. Cardinal Systems used the orb feature matcher for rough alignment and their Gruen-like least squares matcher for sub-pixel alignment.
The Solution
The task for Cardinal Systems was to bundle the images from the navcams, calibrate the cameras, produce scaled and leveled stereo models despite limited control data, and measure the volume of displaced Martian soil in each of the four erosion craters.
Cardinal Systems’ software automates the process that photogrammetrists call “tie bundle adjustment,” which is the process of solving for all the unknowns in the image system simultaneously. The term “bundle” refers to the groups of rays that converge at the camera perspective centers and at tie points observed in the images. Bundle adjustment attempts to force all of these bundles to intersect simultaneously, but in reality it is an optimization problem that minimizes the errors in their failures to intersect perfectly.
The first hurdle was getting sufficient tie point data that was dense, precise, and well distributed, covering as much of the image plane as practical. Manually measuring such data would have been a slow and expensive process. To address this, Cardinal Systems’ automatic tie-point measurement technology was adapted for use on the navcam images’ unusual geometry and small image format. It produced a set of 17,695 image measurements of 7,845 points with fewer than 15 “blunders” (photogrammetrists’ term for image features erroneously reported to be the same object), and an RMSE of 0.245 pixels. The photographs were tied together in an arbitrary coordinate system in centimeters. It was scaled on the basis of the distance between the cameras and checked using the distance between the rover tracks as a reference.
Using the reconstructed/calculated points on the surface, Cardinal Systems produced a digital terrain model (DTM) of the ground the way it is now. Relying on the assumption that it had previously been flat, they created a DTM of the ground as it was before Curiosity landed. By comparing these two surface models and using the distance between the navcams as the scale, they concluded that the deepest of the four craters was about 10 centimeters deep and computed the volume of the displaced ground. The rover drove between the four craters created by the landing, with two on one side and two on the other.
The photogrammetric analysis showed that one set of craters started 9 meters away from the rover and was 9 meters wide, and the other set of craters started 16 meters from the rover and was 12 meters wide.
There is nothing remarkable about combining multiple 2D images to create 3D images. “That technique is as old as two-eyed humans,” Thomas points out. What is remarkable is that Cardinal Systems is able to do it from pretty bizarre geometries. “We’ve received images with 67° convergence angles and have been able to get a human-interpretable 3D view out of them,” says Thomas. “That’s something like holding a penny on the bridge of your nose and focusing on it. Your mind has a lot more ability to process this 3D data than we typically take advantage of from our fixed-eyes stereo base.”
Working with NASA
Cardinal Systems began working with NASA nine years ago by using its mapping software to produce detailed 3D information of damage to the Space Shuttle and its external tank. The purpose was to help prevent a repeat of the Columbia Space Shuttle disaster, in which a piece of foam insulation broke off an external fuel tank during launch, causing the shuttle to break up during re-entry.
For the Mars mission, Cardinal Systems sold its software to NASA and worked closely with the agency to help it use the software and perform the calculations. “When you get a phone call from NASA and they want you to do mapping on another planet, and you have the right software to get that done, it’s going to be a good project,” Kitaif says. “I learned more about photogrammetry in the nine years that I’ve worked with NASA than in the previous 30 years I’ve been in photogrammetry.”
Cardinal Systems is trying to enable Marshall Space Flight Center to do this work by itself, but the center often still requires assistance because it’s doing “some of the most challenging photogrammetric work that anybody in the world is doing,” says Thomas. “Getting images prepared with the recommended data for where the cameras were, where they were pointed, maybe even preparing re-sampled imagery for 3D viewing, is all our field of expertise.” However, he points out, once photogrammetry yields to geological interpretation of where the craters begin and end, that is NASA’s area of expertise.
With Cardinal Systems’ software, in addition to measuring the dimensions of the landing craters, NASA also created beautiful 3D pictures. “The amount of additional interpretive ability you get from the 3D view as opposed to a 2D view is really quite remarkable,” Thomas points out.
“Touchdown Confirmed: We’re Safe on Mars!”
After an eight-month, 352,000,000-mile voyage, on August 6, 2012, the rover Curiosity spacecraft hurtled into the Martian atmosphere
at more than 13,000 mph. It deployed an enormous supersonic parachute to slow to about 200 mph, then it fired rockets to slow its descent to less than 2 mph.
The biggest challenge was the last 0.0000000013% of the voyage—the final 25 feet. Engineers had decided that neither of the previously used landing technologies (the landing legs of the Viking missions in 1976 nor the cocoons of air bags that cushioned the two rovers that NASA placed on Mars in 2004) would work for the one-ton Curiosity, a plutonium-powered rover the size of a small car. Instead, they devised an unprecedented maneuver: a rocket-powered sky crane winched Curiosity to the Martian surface on cables, then flew off and crash-landed intentionally a safe distance away after the rover’s six wheels hit the red dirt.
This ambitious maneuver capped a landing sequence that NASA officials dubbed the “seven minutes of terror.” At 1:32 a.m. Eastern Time, a mission controller announced, “Touchdown confirmed. We’re safe on Mars!” to deafening cheers at NASA’s Jet Propulsion Laboratory (JPL). Two minutes later, a grainy, 64×64-pixel black-and-white image on JPL’s monitors showed one of the rover’s wheels and the Martian horizon. A few minutes later, a clearer version appeared, then came another image from the other side of the rover.
Down-to-Earth Applications
The algorithms developed for NASA’s Mars mission are also useful for increasingly common applications. One is taking measurements from images taken from cameras on small UAS, which are very unstable platforms compared to the large fixed-wing aircraft that have traditionally been used for photogrammetry. This instability greatly increases the projections of their camera angles, to the point that traditional photogrammetric methods don’t work.
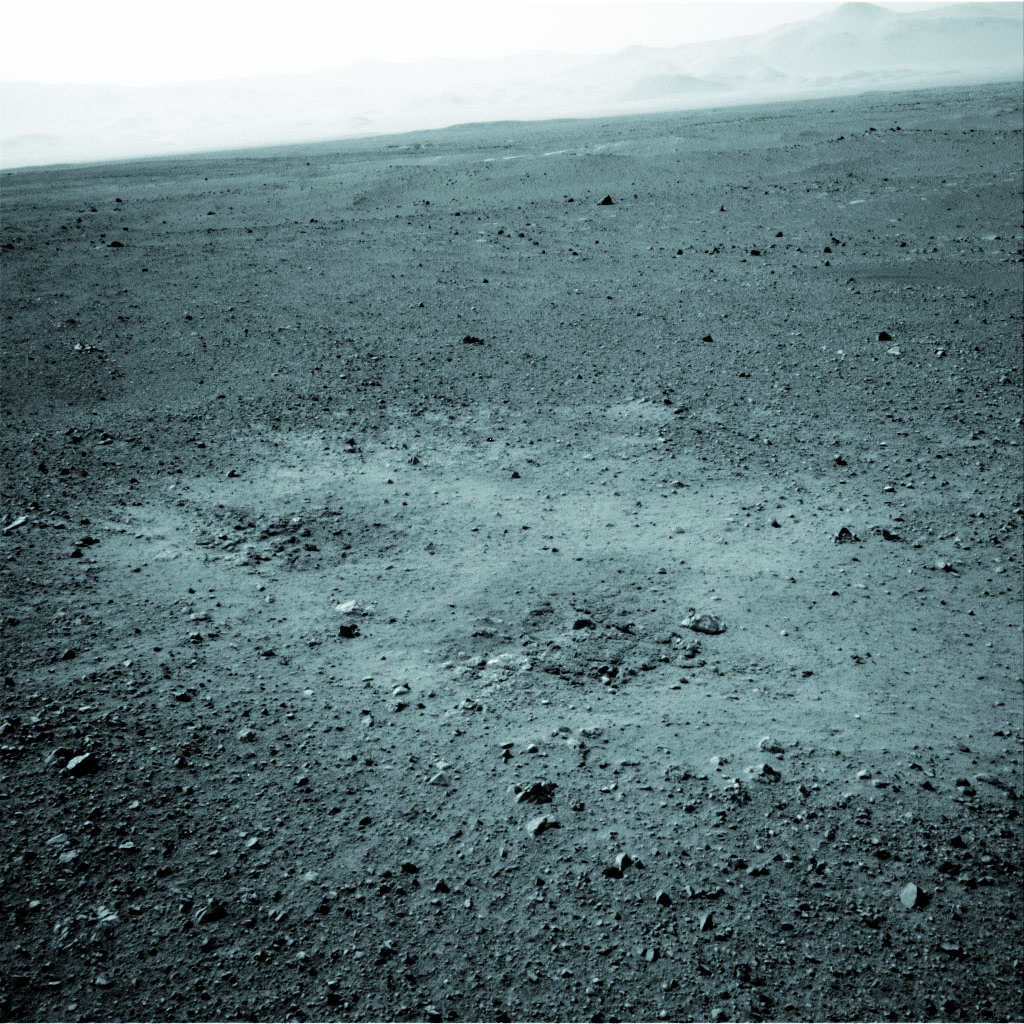
The mountains in the distance highlight the barren landscape devoid of any elements that could be used for ground truthing.
Another possible application for the new algorithms is to bundle photographs from close-range cameras on mobile lidar and indoor scanners so as to create 3D images. The key is the ability to tie together pictures taken at pretty much any angle.
Yet another potential practical application of automated tie bundle adjustment is to calibrate inexpensive consumer cameras so that they can be used to take accurate measurements. This process is increasingly important because photogrammetry is exploding in the commercial market, with myriads of applications. For example, in the new Mercedes Benz S Class a pair of stereo cameras feed images of the road ahead to a computer that analyzes them and changes the suspension as the vehicle reaches the road segment that it just measured.
“It’s more important today than it used to be,” Kitaif explains, “because in the past we had aerial cameras costing upwards of a half million dollars that were made for measurement and were calibrated. They had extremely accurate lenses without a lot of distortion. Nowadays, we’re using off-the-shelf cameras, even down to the small Nikon Coolpix cameras. The lenses on these cameras are good, but the distortions in them are higher. You have to model these distortions or you will not get back accurate measurements.”
In the foreseeable future, however, aerial photogrammetry will probably remain the largest area of application for these algorithms, according to Kitaif. “In the past, you might have a photogrammetry project with a couple of hundred photos. Nowadays, because the platforms are smaller and fly lower, you may have ten times that many photos. So it’s no longer feasible to have an operator join them together manually.”
“Measurement-quality photogrammetric software, where you are really trying to get engineering-level work, has not moved far beyond aerial imagery,” says Thomas. “Long distance, engineering-quality work is pretty limited to aerial, usually nadir-looking images, and that limitation is going away. We’ve shown that we can do almost arbitrary camera positions. It doesn’t mean that we can necessarily get the measurement quality that you want; the geometry of those images does affect the quality of your reconstruction. But it does mean that we can get something out of it and we can get as good as can be done. This interests a lot of people, because you do not always get to plan exactly such things as where your cameras are and exactly what kind of lens you will be using.”
Cardinal Systems’ work is part of a larger trend to use algorithms to extract more and better data from cheaper and smaller sensors. As the number of sensors deployed continues to grow exponentially and the number of platforms is poised to explode with the advent of small UAS, this capability is of growing importance.
For background on Cardinal Systems’ previous work with NASA, read Nancy Luse’s “New Heights for Photogrammetry,” Professional Surveyor, May 2011.
To read this article in print with accompanying art, see xyHt’s July 2014 print issue.