Laser scanning helps in building and troubleshooting weigh-in-motion stations for commercial trucks.
With advances in automated traffic systems and improvements to traffic flows now common along many interstate highways, virtual weigh stations (also known as weigh-in-motion stations, or WIM) for commercial truck traffic are a logical development. This new type of station is an automated system that allows greater flow of unimpeded commercial truck traffic on the highway, replacing lines of trucks sitting at traditional weigh stations.
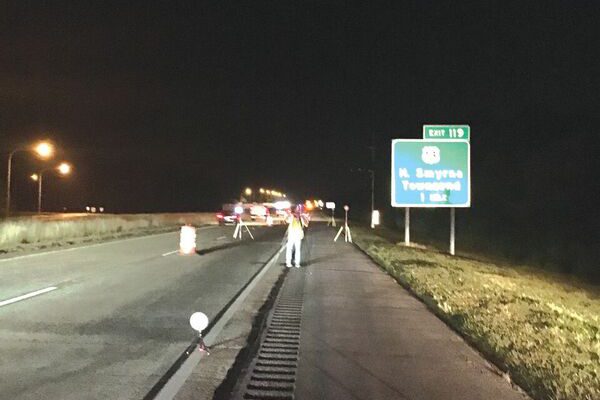
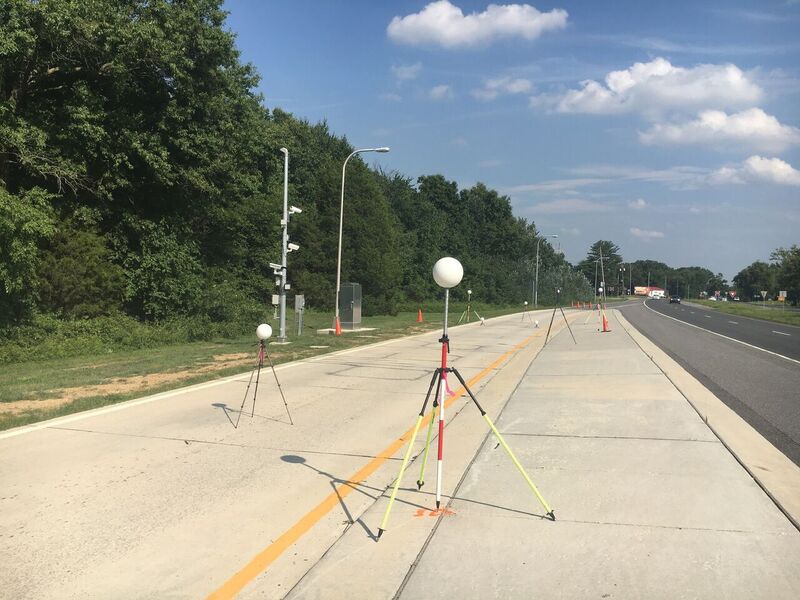
Pennoni conducts night scanning operations on Route 1 outside Smyrna, Delaware to identify slab locations for a weigh-in-motion station.
WIM stations scan trucks as they pass with a variety of sensors to identify if the trucks are over the highway weight limit. If the sensors detect a discrepancy in the weight of the truck, they send a message to a lighted message board alerting the driver to pull off to a traditional weigh station for further inspection.
These automated systems are so sensitive to truck vibration that they require stretches of roadway free from pavement deviations. If the roadway is not even where the truck passes through the sensor area, the sensors will show that the truck is heavier or lighter depending on how severe the truck is oscillating through the sensors. This causes delays in commercial truck traffic and increases unnecessary inspections.
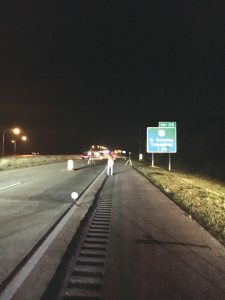
Scanning on the weigh station on Route 13 where trucks were all being flagged as overweight identified the reason for truck oscillations.
How do you identify a location that is suitable for a WIM station? The highway geometry of a specific area usually will dictate whether a location will be suitable. The other consideration is pavement type and condition.
Scanning Pavement
For a recent project in Delaware, Pennoni (the AEC firm I work for, based in Pennsylvania) was tasked with evaluating pavement surface conditions at two locations. The traditional method of using a long straight edge and calibrated shims to determine whether the concrete surface is flat enough was not practical in these locations because there were approximately 1,100 liner feet of pavement to evaluate on a major interstate with traffic speeds in excess of 65 miles per hour, plus 600 feet at an active weigh station.
The cost to do lane closures using traditional means would not have been feasible in this situation. Also, the amount of effort to measure and record the high and low areas using the strait-edged method and traditional survey topography would have delayed the project by weeks and increased the chances of having a safety incident (because the only safe time to work was late evening and early morning hours).
By using a high-definition laser scanner (we used a FARO), we reduced the time needed for closures, collected substantial amounts of data, and created a safer field environment.
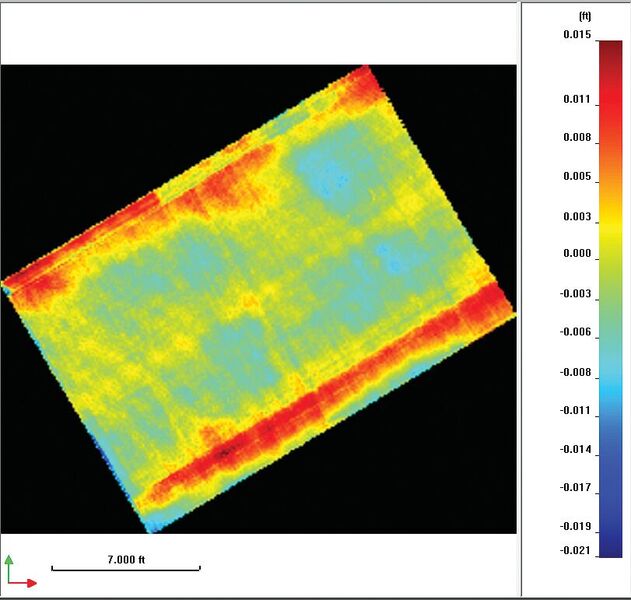
On this heat map of Route 1, the blue areas show traffic surface wear.
Scanning & Processing Site 1
At a location outside Smyrna, Delaware, on Route 1 North, Pennoni worked in the late evening hours, scanning 1,100 feet of the right travel lane. Once traffic control was in place and the area was deemed safe to work, data collection could begin.
Normally this would take two weeks using traditional survey methods, but PennoniÕs laser scanning crew was able to capture the surface conditions and the surrounding area in a few hours.
We used a laser scanner and traditional survey tools to geo-locate scanning control. The geo-reference control allowed the scans to be placed with sufficient accuracy and precision. Because we performed close overlapping scans, the point density was sufficient to pick up the majority of deviations in the pavement, which captured such details as texture and joint locations.
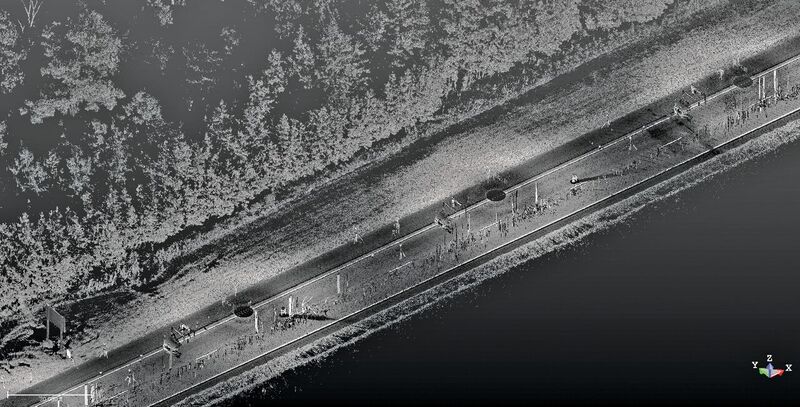
A point cloud view of Route 1.
Once we completed the fieldwork, we downloaded the point cloud data from the memory SD card and performed the initial scan registration in FARO Scene. We then exported the registered files so that further analysis could be completed in other software packages such as AutoCAD Civil3D, Bentley Microstation, and Trimble Realworks.
Using Realworks to process the elevation data, we generated heat maps of the overall roadway showing deviation by color. Processing the road as one continuous deviation map did not produce the resolution needed to see the existing conditions; therefore, a more localized heat map would need to be generated at a higher resolution.
We created a topographic survey plan for the project area using AutoCAD Civil3D with FARO Point Sense and Autodesk Recap showing individual slab locations. Once we identified the individual slabs, we generated individual heat maps showing the deviation in the concrete surface using Realworks and referenced to the topo survey plan.
As part of the heat map creation in Realworks, areas of deviation were outlined on the heat maps and then exported as a CAD drawing on a georeferenced coordinate base so that traditional field survey crews could locate and mark the areas in the field if necessary. This survey map was then used as a guide so that a surface grinder could be used to remove out-of-spec areas.
We collected and assembled all of the data into a report using the topo survey as a key map to identify specific slab locations.
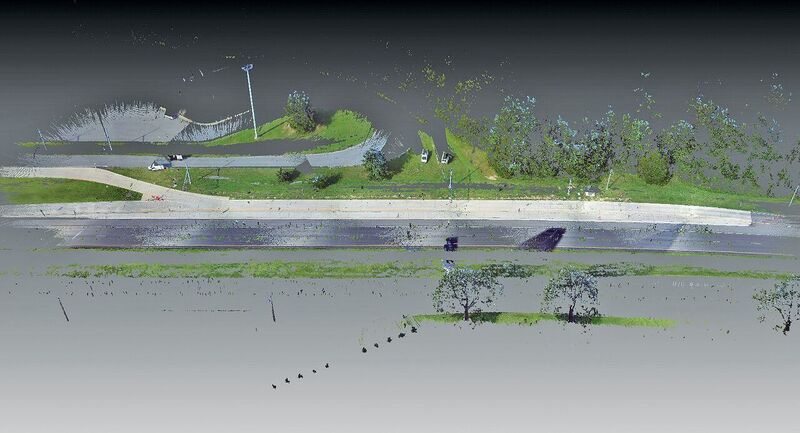
An over-all point cloud of Route 13.
Site 2 with a Surprise
Once the Route 1 site was accessed, the secondary screening site on Route 13 outside of Blackbird, Delaware, needed to be evaluated. This existing station is the final inspection site for trucks that are flagged as overweight on Route 1 North and had been recently upgraded with WIM sensors. After the sensors were installed, preliminary testing was begun to evaluate the system and the access road to the station.
Initial observations were showing that, as the tagged trucks were entering the station, they began to oscillate as they approached the WIM sensor. Once a truck passed the WIM sensor, it indicated the truck was overweight.
Traditional survey methods and video inspection were used to check the concrete approach slabs, which were found to be within tolerance at the specific location of the measurement. After numerous attempts to use traditional survey methods and videography to identify the source of the oscillation, we used laser scanning to survey the approach slabs.
Pennoni performed a laser scan with our FARO scanner, similar to the Route 1 scan. With the millions of points being collected on each slab, a detailed picture began to appear as to the cause of the oscillation.
It was determined that the oscillation was being generated by small depressions located on one side of the slabs. As vehicles approached at low speeds, the depressions acted like a washboard that caused the trucks to oscillate as they passed the WIM sensors.
These depressions were not detectable with the human eye or video. And using traditional topography of a 2-foot by 2-foot grid or a 1-foot by 1-foot grid method to survey the slabs still would not produce the detail needed to pick up the deviation in the slab surface.
However, close overlapping scans with a point cloud density on the slabs of 0.05 foot by 0.05 foot or less showed the locations of the depressions. Again, we generated heat maps of the overall and individual slabs to show the deviation locations using Realworks and Autocad.
As part of the heat map creation in Realworks, areas of deviation were outlined and then exported as CAD drawings on a georeferenced coordinate base. We generated a plan and report similar to the Route 1 report that identified the areas that needed to be resurfaced. The survey map and report were then used as a guide so that a surface grinder could remove out-of-spec areas.
With today’s GNSS, tobotic total stations, and laser scanners, Pennoni was able to greatly reduce field time and mobilization cost and create a safer working environment for all personnel involved on this project.
For a guest editorial involving Pennoni, read this previous issue’s opening article.
For more from this print issue, click on the cover, below.