As the severity of weather increases, so do the benefits of high-definition laser scanning for asset management and damage analysis.
Editor’s note: Improvements in, and availability of, tools and resources for precise change-detection are enhancing pre- and post-event analysis, making possible that which may have been otherwise impractical or cost-prohibitive only a decade ago. Monitoring now delivers on the promise of post-event analytics and forensics—and in detecting pre-event trends. This has improved safety and saved lives. Technology like scanning (as examined in this article by a surveyor) can enhance the profession: surveyors are uniquely positioned to provide authoritative change-detection data and should pursue such opportunities.As we in the California coastal communities are amid a severe drought, the forecasted El Niño suggests a long-awaited reprieve. However, danger lies in the prospect of this drought-easing weather. Shorelines and areas with coastal structures are at risk from forecasted storms, with the strong possibility of life-threatening damage.
As the drought has sapped the earth of moisture and soil adhesion, once it becomes over-saturated, swelling or expansion could lead to cliff faces becoming unstable, or, in the worst case, structural failure and collapse. There is also danger to the structural integrity of piers and storm walls along the shoreline from increased surf, combined with the natural winter regression of the supporting beach sand.
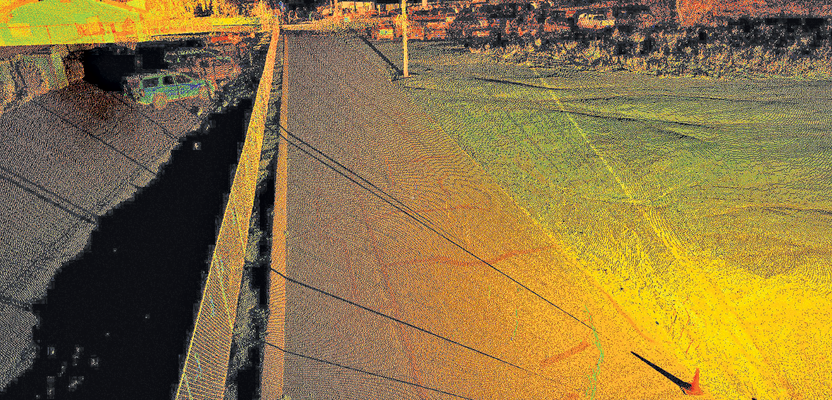
This damage will not be isolated to the communities along our coastlines; the inland drainage structures, bridges, and dams will also be vulnerable to a rapid increase in water flow and potential flash flooding, as we saw here in Southern California with the collapse of the “Tex Wash” bridge on interstate 10 on July 19, 2015.
This bridge was host to more than 20,000 cars per day, and since its collapse drivers now have to travel hundreds of miles around this route. This specific bridge was listed as being functionally obsolete in 2014; however, no structural defects were known.
Systematically scanning vital structures like this would provide a comprehensive review, with the ability to perform more diligent inspections so that risks can be identified proactively.
Safer for Workers
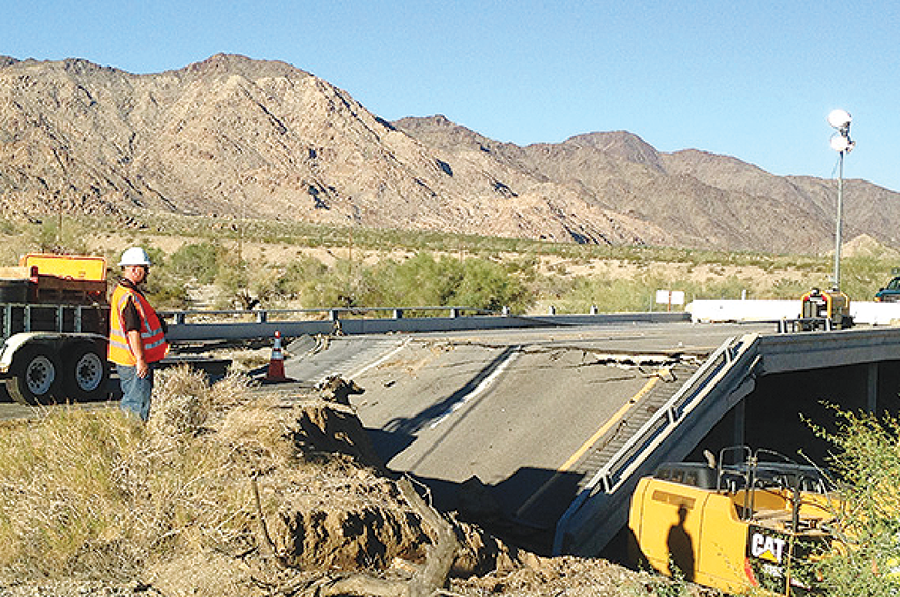
This damage to the “Tex Wash” bridge was caused by flash flooding.
Scanning also provides design-quality as-built data while not impeding traffic needs, along with keeping field crews safe by greatly reducing the need for them to be in potentially dangerous areas. With the current advancement of mobile laser scanning, roadways can now be scanned from within the safety of a vehicle, all while traveling at freeway speeds.
Laser scanning is a helpful tool in monitoring the natural and built environment. It can be used to efficiently create a baseline of existing conditions for successive monitoring campaigns. Modern scanners are able to obtain accuracies to within +/-2mm, providing phenomenal resolution for monitoring and change detection. An added benefit is that once data has been collected, you have a complete as-built report, so in the case of a failure you have the ability to precisely recreate the pre-failure conditions.
Safer for the Environment
Scanning is a non-intrusive means of collecting data without disturbing the local environment. This allows the user to document sensitive areas without causing any harm to the local ecosystem. Vernal pools are an excellent example of this, where even foot traffic can be harmful to the wellbeing of sensitive habitat.
Laser scanning allows us to capture the whole area in question while remaining safely outside the endangered area. Once data has been collected in the field, project-specific measurements can be made from the office where workers analyze the resulting point cloud.
Again, as we are expecting to have one of the wettest winters in the last 20 years, this weather may permanently alter the sizes of local vernal pools.
More Efficient
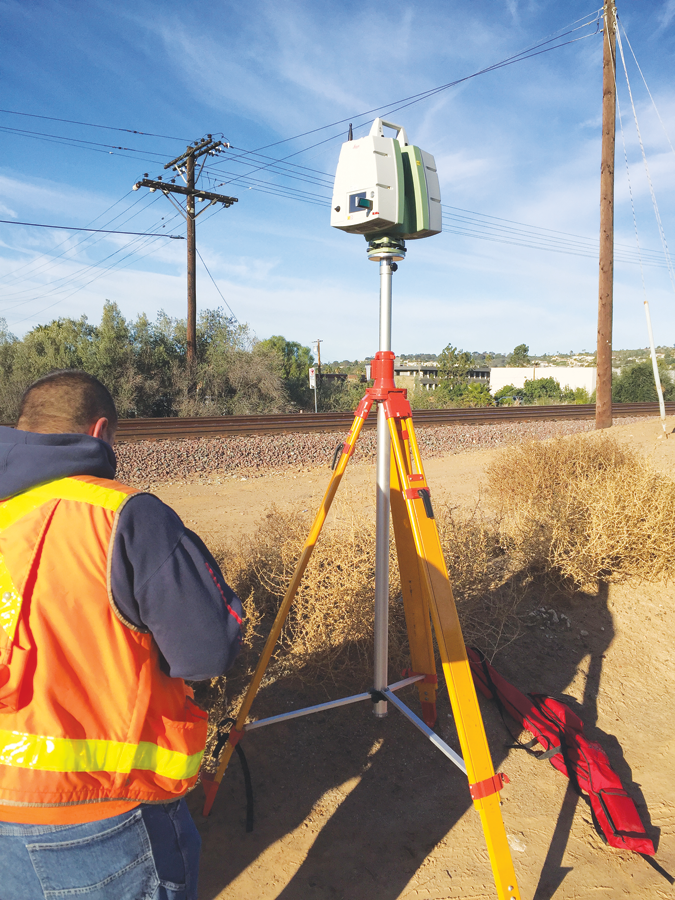
A team of surveyors use a Leica C10 scanner to archive data to be used in future analysis.
Scanning can be superior to conventional surveying methods such as aerial photogrammetry, conventional spot topography, and GNSS topography. When you use those conventional methods, the amount of data you are collecting is limited to having to take each individual shot in order to obtain the coordinates for that specific location. A laser scanner, however, is capable of obtaining upwards of 100,000 shots per second, which allows for a much denser and richer point cloud model to be built.
Riprap, for example, is very difficult to measure accurately and even more so cost-effectively, but not so for a laser scanner, which can capture anything you can see. Once the scan is complete, that data can be saved, then compared year-to-year to accurately measure and track sediment build-up.
As data collection and analysis continues to move into the three-dimensional realm, the true benefit of working with point clouds obtained by laser scanning methods becomes ever more apparent. Especially given the advances in computer technology, is it becoming easier to process and work inside these large point cloud files.
Most versions of AutoCAD, as with MicroStation, have begun to add point cloud manipulation into their software, thus allowing for a more uniformed use of the collected data. Once the data has been collected and processed into an acceptable format, the end user can generate precise as-built drawings, which can then be used in structural stress tests, thus furthering the use of the captured data across many different fields.