One collect, multiple uses.
A mobile mapping system (MMS) is a versatile tool capable of creating both GIS asset inventories and design-level mapping products that require an extraordinary level of detail and accuracy. The MMS allows you to collect rich geospatial data from an extensive coverage area and increasingly allows that same dataset to be applied across multiple projects for myriad uses.
This was the case in late 2012 when Ohio-based Woolpert was awarded a contract to perform a 3,200-mile sign inventory and physical database repository for the Indianapolis Department of Public Works (DPW). It was the largest city asset inventory project in the U.S. at that time. In an effort to catalog 129,949 signs across 400 square miles of Marion County, mobile mapping technology was deemed to be a more effective route than the traditional boots-on-the-ground approach.
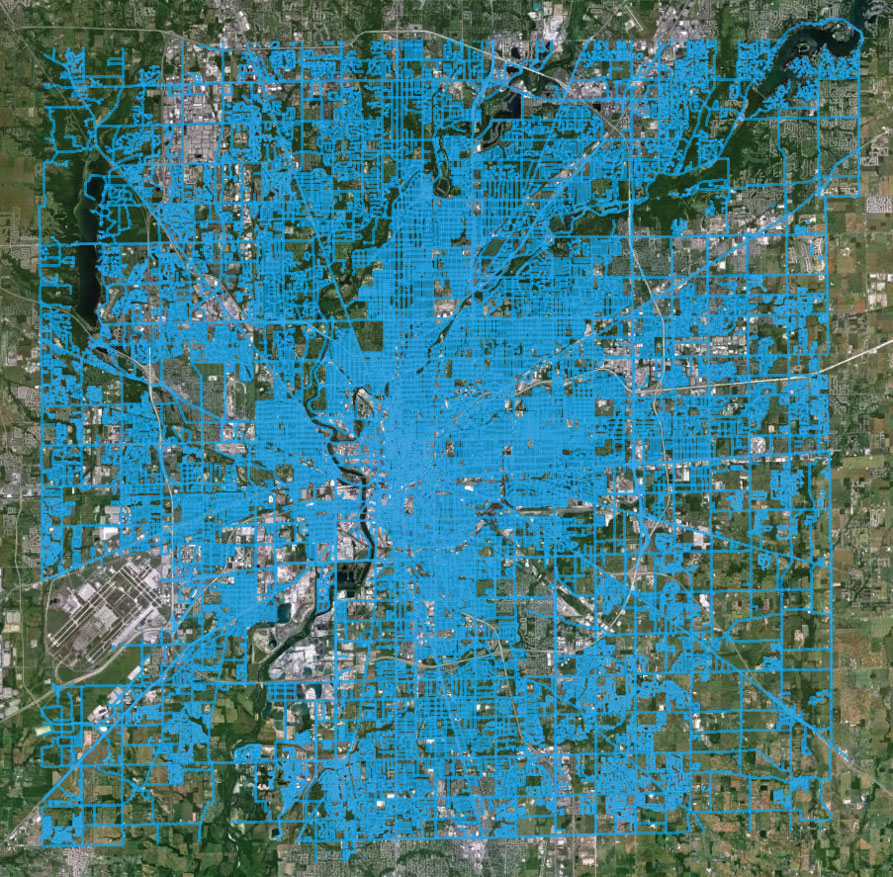
3,410 centerline miles provided by the city helped Woolpert develop a data collection plan.
For this project, Woolpert deployed the Optech M1 MMS to acquire approximately 3,410 linear miles of the city’s streets and to collect data to support the citywide sign inventory. This system uses state-of-the art lidar sensors that can measure 1,000,000 points per second, multiple high-definition cameras that provide 360-degree coverage and precision positional/navigational equipment. For this project, lidar and digital photographs were used to support automated methods to extract signs, sign attribute information, and the sign location per Federal Highway Administration Manual on Uniform Traffic Control Devices (MUTCD) specifications.
“Our team has the ability to capture highly accurate datasets to allow for a semi-automated asset inventory solution to include signs, utilities, street lights, fire hydrants, parking meters, traffic signals, and many other assets that can be later extracted through future mining of the data,” said Joe Cantz, Woolpert’s lidar discipline leader. “We can use any portion of a citywide asset collect and, if required, we can add additional ground control points to provide a final product worthy of design-level mapping.”
Cantz added that, with many municipalities facing limited funding, the leveraging of dense, feature-rich data across departments is essential. “It’s all about one collection and multiple uses,” he said.
Survey Control
Based on the accuracy requirements for the project, we determined that the MMS’ GPS positioning system would be sufficient to support the collection. No control was established except for quality control check shots. During the data acquisition, Woolpert set GPS base stations within the project collection area to support accurate triangulation of the van’s position during collection.
The team also used existing Marion County airborne lidar and imagery that had been collected by Woolpert for the Indiana Statewide Imagery Program to constrain the MMS data both vertically and horizontally. The team then used proprietary software to analyze the MMS dataset and determine where adjustments were needed to meet the accuracy specifications of the project. Using these techniques was essential to our goal of eliminating the need for extensive ground control for this large-area collection while meeting the intended 1.0-foot positional accuracy.
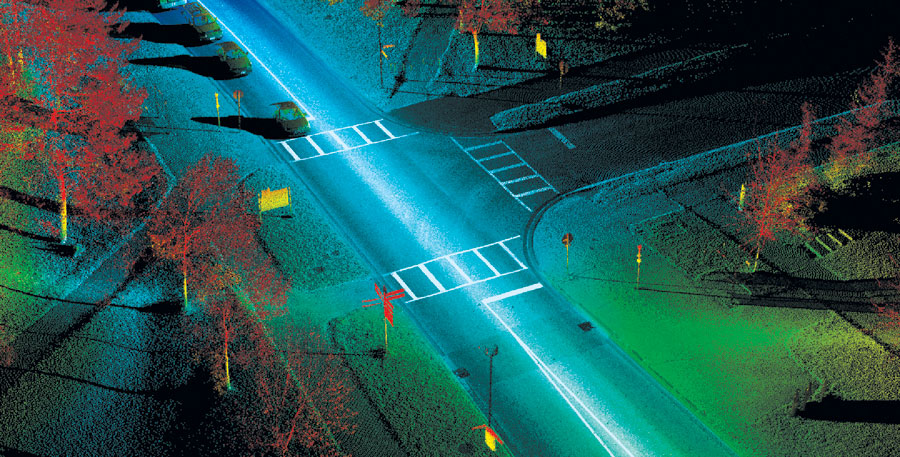
This lidar point-cloud data contains billions of x, y, z points, where you can identify multiple assets including signs, light poles, curbs/sidewalks, catch basins, and paint markings.
Data Acquisition
Street centerlines provided by the city helped Woolpert develop a data collection plan. With such a large collection area, a real-time drive log that color-coded collected roads served as a valuable project management tool. Data acquisition occurred during the day, using similar sun angle best practices as seen with aerial mapping, to ensure for adequate lighting conditions for current and future map products.
As part of each day’s data collection effort, the lidar and imagery data were initially processed in the field to verify that there were no problems with the collection along each corridor. If problems were identified, the corridor was scheduled for re-collection.
Data Processing
Upon completion of mobile lidar and imagery collection, processing technicians used existing aerial imagery and aerial lidar to ensure that the horizontal and vertical alignment of the data met the required 1.0-foot positional accuracy.
Lidar was matched and processed in combination with the geo-referenced imagery, which allowed for a suitable dataset for feature extraction techniques to begin. Lidar/imagery processing was achieved by performing the following steps.
Sign recognition tool: Woolpert Labs, the firm’s applied research and development group, created an automated sign recognition tool that uses multiple computers and proprietary algorithms to perform the complex mathematical computations necessary to identify and classify individual signs from lidar and imagery data.
To accomplish this, Woolpert’s sign recognition tool used methods of deep learning and computer vision to recognize the city’s supplied MUTCD sign types from the collected lidar and imagery. Once the lidar and imagery were fed through what became known as “the cluster,” the result revealed not only the type of sign but also its related attributes, including its location, size, height, position, orientation, and sign text.
This complex system identified specific MUTCD signs and calculated and automatically placed 13 attributes of the sign in the database. The tool allowed Woolpert to integrate very large volumes of lidar and imagery data to extract specific features of interest, automatically. Automation allowed technicians to QC the sign in under one minute rather than manually extracting and entering attributes, which would have taken three to four minutes per sign.
This feature recognition process allows Woolpert to turn trillions of pieces of seemingly irrelevant data into a manageable, relevant source of information for our clients, ensuring that complex projects similar to this sign inventory can be completed quickly and cost-effectively.
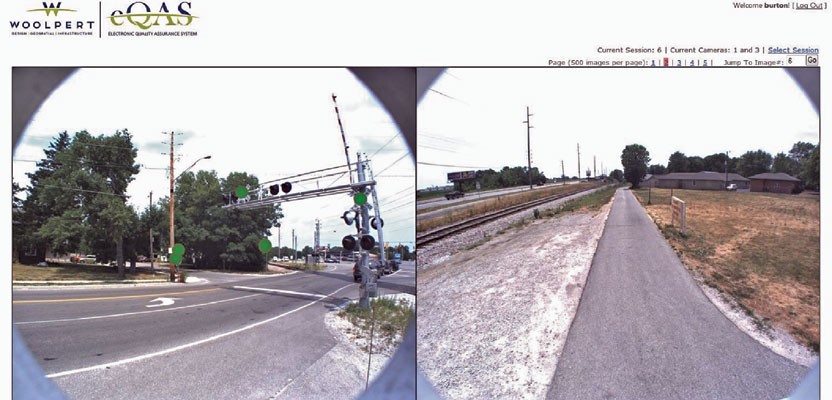
Sign QC tool: Once we processed the data through the cluster workflow, we imported it into another Woolpert proprietary software, eQAS, which offered the Woolpert team a web-based, hosted solution that allowed the production teams, including subconsultants, the ability to work in a seamless environment for visual and other, related quality-control tasks. Operators verified extracted signs and were able to identify any missing or damaged signs as well as add client specific attribution to each sign.
A Google Earth KMZ of the area was linked to the web application to provide the QC expert further analysis. The online QC tool revealed that Woolpert’s semi-automated feature extraction process successfully extracted approximately 75% of all signs and their associated attributes.
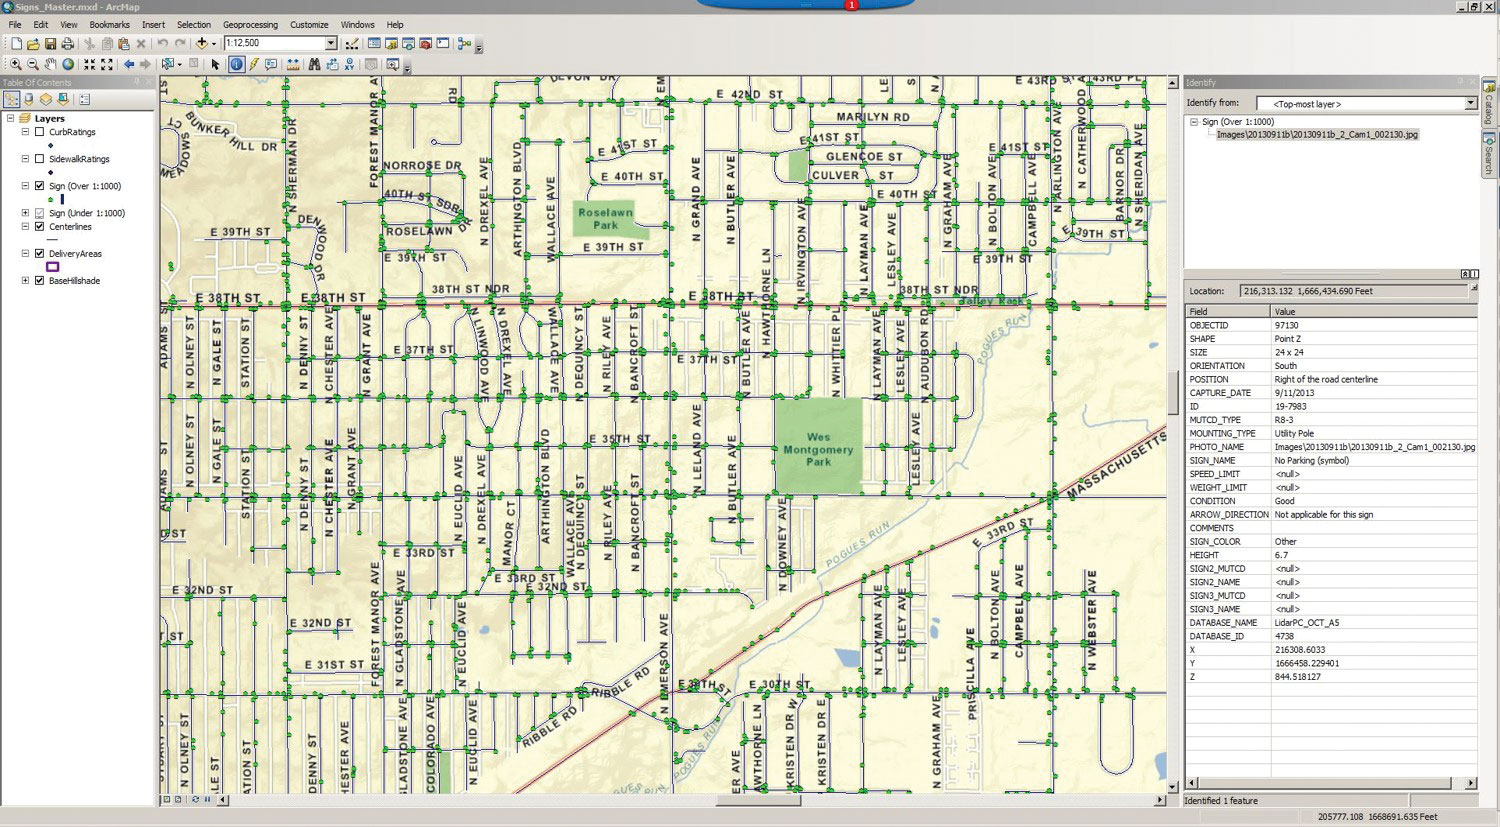
This ArcGIS Geodatabase was delivered to the Indianapolis DPW.
Delivery of Data
Woolpert worked with the city to determine a block/tile delivery system. By delivering the massive project in small groups of blocks to the city, it allowed the GIS department a more manageable and efficient review of the data. Once all 51 blocks were accepted by the city, a final seamless geo-database consisting of hundreds of MUTCD sign types was delivered, along with the images and lidar used to derive the sign inventory.
Woolpert estimated that the final datasets were approximately 90 terabytes, which far exceeded the city’s data storage capability. Purdue University was recruited to store the dataset on its servers, and Purdue students have performed additional research and analysis of the data.
How the Client Is Using the Data
The Indianapolis DPW imported the final geo-database into their Hansen Asset Management software to develop a sign replacement plan. The city also procured a multifaceted geo-database that can perform other queries based on any combination of attributes.
“Completion of the sign inventory has allowed for the inventory and assessment of all traffic-related signs in Marion County,” said Nathan Sheets, DPW project manager. “Prior to the completion of the inventory, there was no accurate inventory of the placement, number, or condition of these traffic-related signs that the department was ultimately responsible to maintain. Having an accurate inventory has allowed the department to make better decisions on the replacement of signs due to their age and condition and will increase the efficiency in responding to the citizens of Marion County.”
Since completing this project, the Woolpert Labs group has performed additional research and development to provide solutions for any linear or point-based asset: ADA ramp compliance, pavement assessments, utility inventories, and other solutions for state and local government entities.
This project and the exponential applications of the data generated signal a bright future for efficient, cost-effective asset management and utilization of MMS data for any municipality.