Surveyors in parched California measure sedimentation levels in a reservoir using a small, remote-controlled boat integrated with a survey-grade RTK.
 Before they even start taking measurements, surveyors often have to deal with such practical challenges as how to access and move around in their survey area—which may be rocky, filled with dense vegetation, or obstructed by construction. In the case of hydrographic surveys of lakes, ponds, reservoirs, rivers, and streams, the depth of the water, rocks, and strong currents may make it impossible or too dangerous for surveyors to wade in, while insufficient overhead clearance, very shallow spots, and other obstructions may make it impractical for them to use a boat. That is when a small, remote-controlled (RC) boat can be a very valuable tool.
Of course, an RC boat bought at a toy store would typically be too small and underpowered to carry the required instruments. For more than a decade, Oceanscience, a company based in Carlsbad, California, has supplied the oceanographic community with deployment platforms for environmental monitoring instrumentation. It designed one of its products, the Z-Boat 1800 remotely operated survey boat, specifically for surveying inland water bodies with poor access or unsafe conditions.
Teñell Matlovsky, survey supervisor for the County of Santa Barbara, California, used this boat to survey an area of Lake Cachuma, in the Santa Ynez Valley. Located on the west side of a coastal mountain range, his project is a reservoir that has been one of the main water bodies serving the city of Santa Barbara and the Goleta area.
Project Requirements
Recent water shortages in California have brought increased attention to the problem of sedimentation within reservoirs. At Lake Cachuma, sediment has been accumulating over the gates at its intake tower. Therefore, the county’s Public Works Department’s Water Resources Division asked the department’s Surveyor Division to perform a hydrographic survey of an area with a 200-foot radius around the tower and provide a topographic surface model. Water Resources wanted the model to be relative to their as-built model of the tower so that they could determine the sediment levels relative to those intake gates. Matlovsky’s office does not usually have or operate boats. It’s a land survey operation that would typically have field surveyors survey terrain up to the edge of water bodies and/or wade partway in to acquire some aspect of the terrain covered by water. However, that has limited its capabilities to represent the terrain under wide water bodies or narrow, deep ones. It wanted a boat that it could use for shallow water surveys, thereby extending the capability of its equipment and crew without having to wade into a water body or go through the logistics of owning or renting a full-sized boat.
 Previously, the office has been doing cross-section surveys of drainage ways that it has been monitoring in the flood plains around Santa Barbara County’s coastline. It routinely conducts inspections before and after storm events to try to determine sedimentation levels in the shallow water creeks. “It was very time-consuming to put the manpower out on the water in hip-waders and try to control poles or deal with conventional survey systems,” Matlovsky says. “We had tried a couple of things with RTK and thought that if we could integrate that with a little radio-control boat, it would be way more efficient for the time spent on site.”
Matlovsky and his team considered buying a boat with sophisticated multi-beam sounding equipment, but they opted instead for one that they could use, essentially, as a digital tape measure or sounding pole and that could also capture its coordinates at regular intervals as provided by a GPS receiver.
RC Boat and Software
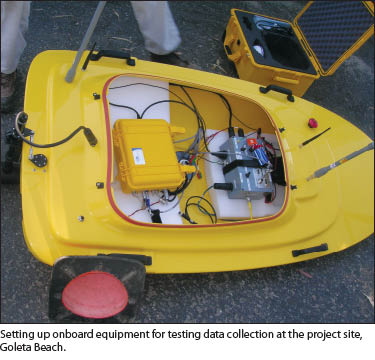
They chose the Z-Boat 1800 because of its size, its price, the power of its single prop, and the easy integration its single-frequency depth sounder afforded with their existing RTK setup. They used it as delivered, except for replacing its stock L-1 frequency GPS receiver with a Trimble R-8 GPS receiver running as an RTK rover and providing an NMEA data stream output through its serial communication port.
The Z-Boat allows them to put their GPS rover receiver from the survey rod onto a center mounting post on the boat and rove the water to survey the underwater terrain. When they follow planned survey lines, controlling the boat from the shore gives the surveyors a better perspective than they would have from aboard a manned boat and does not require one person onboard with the sole task of driving it. Additionally, a manned boat would typically sit deeper in the water and be less maneuverable, posing a greater problem when encountering obstacles. “In this survey there were not many obstacles,” Matlovsky says, “but we wanted to be able to get in close to the tower and needed to be able to make tight turns.”
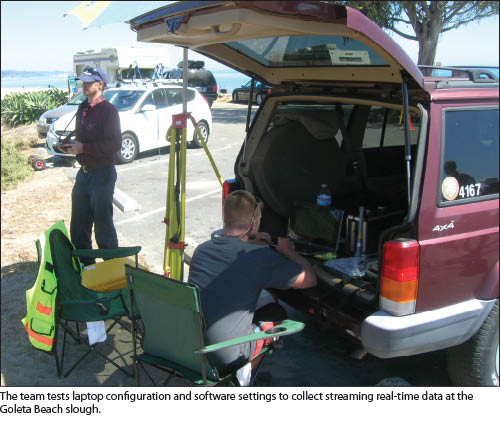
In the field, Matlovsky and his team used a laptop running the Windows 8 operating system with the HYPACK 2013 software package. They used a Trimble utility to configure the NMEA data stream output for the RTK rover and the Tera Term open source communications program to verify the Z-Boat telemetry data stream that they received on the laptop through a wireless network connection. At the office they used workstations running Windows XP with HYPACK 2013 and Windows 7 with AutoCAD Civil 3D 2012.
Testing
Matlovsky and his team tested the system over the summer of 2013. Initially, they tested the performance of the Z-Boat itself—such as steering, the range of the radio controller, and battery life—using it on a few survey sites where they otherwise would have waded in the water and where it would be relatively easy to retrieve it if necessary.
They also tried post-processing the data using HYPACK. They found that the Z-Boat when used with HYPACK is a fairly sophisticated system and that the more they were able to pre-configure it the easier it would be to post-process the data that they collected.
They set up the planned survey lines, configured the laptop, and got the radio telemetry to work properly. Testing the equipment and entering the correct software settings proved to be challenging, but once that was done the rest of the process was smooth, and the team was pleased with the results.
“We were able to get real-time elevations of the survey from our RTK before we put the GPS receiver on the boat, and then we were able to get the sounding values coming from the boat to correspond to those elevations, which made a lot of sense to me,” Matlovsky recalls. “I wanted to try to minimize the number of alterations that we would have to perform after collecting the data so that we could have everything verified in near real-time while we were on site and mitigate any need to return and re-collect data. Once we got all that figured out, we were really ready to rock and roll with the system.”
Planning
At the beginning of October 2013, soon after they had tested the Z-Boat with the intent to offer hydrographic topographic (“hydrotopo”) surveys to their colleagues in Water Resources, Matlovsky and his team were invited to perform the test project at Lake Cachuma.
Because the reservoir was significantly depleted, most of the typical access routes to the shore were extremely steep and rocky. However, a boat ramp a couple of miles away from the survey site was available, as well as a large boat that was already in use on the lake to transport personnel.
After setting up their RTK equipment high on the banks above the tower, which gave them a clear line of sight to the RC boat throughout the project, Matlovsky and his team launched the large transport boat and used it to take one team member and the Z-Boat 1800 to the survey site. A “spotter” on the transport boat was ready to intervene in case the radio connection was lost or the RC boat got stuck.
Given the need to produce deliverables quickly and the difficulty of accessing the lake, they wanted to make sure to get the survey right the first time and not have to return to the site. They spent a day at the lake to plan where to locate the record control points and where to establish a local control point from which they would be able to set up their GPS RTK base within lines of sight of the entire survey area.
Setting up the Survey
The first step in the survey was to establish control at the site, so the team researched nearby control monuments. They set up on those monuments, checked into corresponding ones, and made sure to have a good control network in the area from which to establish their initial control values. “Once we had control established, we needed to do some planning on the software side, setting up the site in HYPACK to make sure that we had the datum and some planned survey lines,” says Matlovsky.
They loaded onto the laptop an aerial photo of the survey area, offset a few lines about 20 feet apart, and set up about ten of them in a grid so as to form a 200-foot grid around the intake tower. Those grid lines were the pathways along which they would run the boat to sample the data.
Next, they set up the RTK equipment again, set up the boat, calibrated the depth sounder (as described below), and verified that the values that they were getting in real-time on the software on the laptop were correct and that they were receiving the complete echogram.
Calibration
The moment of truth, Matlovsky says, came when the survey team went on site after having laid out the basic planned survey lines and superimposed them on a georeferenced background air photo of the survey area. “We needed to calibrate the Z-Boat at a location where we could establish the existing water level—and a corresponding underwater surface point to verify the GPS and sounding signals and to make sure that all of that was corresponding through the wireless network to our laptop.”
HYPACK includes many settings for determining what project datum to use and to account for tidal influences. Matlovsky and his team were able to set up a basic geodetic configuration relative to a geoid model, set up their RTK system locally, establish their datum in a state plane coordinate system, and then go to the water’s edge of the feature that they wanted to survey and take a water-level shot that they could use as an orthometric offset.
They tied up the RC survey boat at a boat launch ramp where the water was only two or three feet deep and shot the bottom of the water beneath it with their RTK rod to get an orthometric offset of the ground elevation at that point. Then they put the RTK receiver on the boat, applied the orthometric offsets in HYPACK to the data from the GPS receiver and the depth sounder from the edge of the water level, and they made sure that the elevation values that they were getting in HYPACK from the Z-boat’s depth sounder matched the values from the RTK rod.
Only after all of this did they put the survey boat out to do its work.
Collecting the Data
Driving the survey boat “was a lot like driving a remote-controlled car,” says Matlovsky. It was easy to turn, reverse, and maneuver around obstacles, such as rocks near the shore. When the boat occasionally did hit a rock, the team member on the larger boat was able to retrieve it, readjust the prop position, and clamp it back down. The team was able to follow the planned survey lines on the laptop’s screen, where the position of an icon representing the survey boat was updated in real time, overlaid on the aerial photo.
Part of the value of the planning, Matlovsky explains, is that it makes it possible to stop the survey at the end of each line and re-start it after positioning the boat at the start of the next line. The software automatically assigns the data collected to the active line so that during processing it is clear which dataset corresponds to which planned line. Therefore, it is not necessary to make tight and precise turns from one line to the next or to download a single huge survey file for the entire day and manually sort it out.
The system receives the full echogram from the sounder synced with the GPS position at the time of the sounding. This is useful for quality control—for instance, to distinguish returns from the bottom from those caused by obstructions such as bubbles or algal plumes. Likewise, the GPS receiver on the boat provides a full NMEA-compliant data stream, enabling the surveyor to monitor whether it has lost the lock from the base receiver and is giving autonomous values.
The Z-Boat is able to store data on board, and the team used that as a backup in case, for any reason, they should not be able to get the telemetry to the laptop, even though that would require more laborious manual post-processing after the survey. “With the data collection storing on board and being sent in real-time to the laptop, we would then do the data collection relative to the planned survey lines in HYPACK, end the survey, shut everything down, come back to the office, scrub and process the data, and try to distill the larger echogram down to more refined x, y, z soundings from the survey,” Matlovsky explains.
The Deliverables
HYPACK provides both a plan and profile view and an elevation view, showing the position of the boat for every elevation or depth and making it easier to edit the data. The system also allows the operator to set the data collection intervals by time or distance and to filter the data set to create a smaller file.
“Initially, I wanted to have my GPS receiver sending signals at the same interval as the sounder so that everything would sync up with a relatively high resolution,” says Matlovsky. “However, when I was looking at the relative crossing lines of the grid and some of the minor aberrations in the surface of the bottom of the water body, I was able to sort the data to come up with a more generalized representation by sampling at a lesser interval and come up with a distilled x, y, z sounding file to export for modeling.”
Ultimately, Matlovsky and his team were looking for a terrain model TIN with contours that they could give to engineering firms in a standard AutoCAD Civil 3D drawing file. So they exported the points out of HYPACK, imported them into Civil 3D, and generated a terrain surface that they contoured and were able to annotate. They were also able to produce notes and some vicinity mapping.
Another advantage of using Civil 3D was that it enabled them to relate their survey to the existing as-built information for the intake tower. “We had taken shots on top of the intake tower and the access bridge to it and were able to correlate those to the as-built information. We got everything adjusted so that the as-built datum was completely in synch with all the data that we had collected,” says Matlovsky. Modeling everything in Civil 3D also enabled him to provide, in addition to the planimetric contour map, an isometric view of the tower and the access bridge.
New Process
The whole process was brand-new for Matlovsky and his team. The boat’s manufacturer, Oceanscience, told them that they were the first customers to fully integrate it with survey-grade RTK, and in consultation with Matlovsky, they began to develop that process to make it available to other customers. Matlovsky says, “It was a professional challenge for me to be able to bring all of this to fruition with little time and money. Ultimately, we had the sense that this was groundbreaking, and that if we could make it a doable process we’d be doing more of it in the future.”