An interactive exercise merging the topo-graphical and the topo-logical
Editor’s note: Just about any interaction we have with the digital world is enabled through the power of database technology: our smartphone apps, the web, shopping, work, and play. A lot of this is behind the scenes and taken for granted. Data-collection software for surveying is becoming increasingly database-driven, as is the surveyor’s office and CAD suites; many of us may only be starting to tap into the full power of such capabilities. In this article, the first in a series, we invite you to help shape an exercise in bringing the power of the topo-“logical” to the familiar topo-“graphical” world of surveying. Be sure to submit feedback through the poll linked near the end of this installment.
Most of my surveying training was in college, during summer session field labs. In one of those labs, we used plane tables and alidades to develop a small topo map. I suspected that the real reason we had to use such a cumbersome device was so that we would appreciate not only historical surveying methods but also proper fundamentals. The rest of the time, we recorded measurement data into field notebooks and then transcribed those notes into manually drafted maps. Oddly enough, once I graduated from college I never did any further “old school” mapping: my professional career has been spent in developing data that can produce maps. To that end, I’ve always been personally focused on the issue of “databased mapping.”
I suspect that most surveyors would find the term “databased mapping” redundant. After all, you need data to produce a map, right? Well, that depends on what your definition of “data” is. That might be a good starting point—just what is “mapping data” anyway? Let’s go to what some consider to be the “ultimate” source: Google. You might be surprised to learn that most of the returned hits to the quote-qualified keywords “mapping data” were linked to sites that treat “mapping data” as a verb phrase: that is, to map (transform) data from one type or format to another. A secondary usage was visualizing non-geographic data (such as financial trends, etc.). A distant third was the use of mapping data in a geographic context.
Well, who cares what the rest of the world thinks? As surveyors, we have long held that the most useful definition of mapping is a visual representation of geography (natural and manmade). Better than that, it’s a scaled visual representation of geography: mapped features are depicted in accurate positions, not in some schematic semblance of reality. At this point we’ve successfully caught our tail and all agree that “mapping data” is data that can produce a geographic map. Okay, but how exactly do we store this data? As poor old Hamlet lamented, “there’s the rub.” I contend that, most of the time, we’re storing mapping data as a map, and that’s a big rub, indeed.
A recent thread in a popular online surveyors’ forum titled “What should be in a CAD digital copy?” spurred my thinking on this issue. The topic was what should be removed from a CAD drawing file (AutoCAD .dwg format was assumed, although the same observations would be applicable to MicroStation design files as well) in a client-delivered form.
What is interesting from the ensuing comments is that many surveyors understand that there is both explicit and implicit data content in mapping stored in CAD files. The explicit content is the results of survey map rendering itself—the presentation of collected data that visualizes what the client requested. Strip away all that deliverable-specific linework, labeling, and detailing and you’re left with the “implicit” content: primarily the context-neutral surveyed points that many commenters recommended be stripped from the CAD file upon client delivery … and never subsequently shared, except possibly with other measurement data experts. The point I fixated on is not what should or should not be shared in a CAD file delivery (although that is a darned good discussion topic), but what mapping data should be stored digitally—and how.
I’ve always been fascinated by maps. Square inch for square inch, maps are the highest-bandwidth visual content provision mechanism available. But they can’t always explicitly deliver the exact answers you’re looking for, because they’re inevitably crafted for a specific set of representation goals. An example is my “here’s how your instructor got into GIS” speech I inflict on students in my opening lectures in graduate-level GIS. When I was in high school, I had a 23-mile-long paper route that I was always trying to minimize in terms of distance traveled. Try as I might from my beautiful map, I could never arrive at a route that traveled through street intersections only once, didn’t travel back on already-delivered street segments, and so forth.
In college, I stumbled upon graph theory and one of its topologic axioms that proved that it’s impossible to traverse a graph’s intersections only once unless there are no dead-ends and only two three-way intersections. That’s over-simplifying Leonard Euler’s topology of networks’ theorem (see sidebar), but the light bulb that went on for me was that there was meaning and information that could be derived from raw geographic data. Shazam! That (and my lack of artistic cartographic rendering skills) hooked me on mapping as a database science from that point on. Plus, it told me there wasn’t a non-redundant, minimal-circuit path for my paper route.
Maps as Data
Surveyors typically store a map in its analog form as a CAD file. That’s our thing: collection, interpretation, and presentation of geographic facts tailored for a particular purpose. GIS folks, on the other hand, like to store data that can make maps. In other words, a good (geo)database is worth a thousand maps.
Here’s the $64K question: How can we build the ultimate surveying database that not only stores surveying project data but structures it to be able to produce accurate reports, analyses, and visualizations that do not depend on the way the data itself is stored? That is the ideal definition of a database for me: a minimal amount of subject-related data stored in such a way that meaning is derived from the context in which the data is being used.
Surveyors already have a head start and have been eased into this realm of databased mapping through such things as data collection codes. These codes entered in the field for each topo shot get paired with entries in very rudimentary database tables of feature codes to shots, symbols, and stringed linear features into the resultant CAD map on the fly. The CAD drawing itself is derived from another rudimentary database.
As an exercise, export a common exchange file format (like DXF) for one of your finished CAD files and open that “.dxf” in Notepad. You’ll see thousands of classified entries, sometimes dozens of entries defining the graphical display properties of elements in the drawing, and in some cases data field attributes. But that is an example of one database file controlling one drawing; a powerful and well defined database could yield any number of drawings or maps in endless variations, customized for many uses and on the fly.
In a way, this is the general theme of web mapping in that you typically want to view “maps on the fly” that combine pre-symbolized feature layers together. However, right-of-way lines are not necessarily presented in heavier line weights—specifically worded labels aren’t present, registrant certifications aren’t displayed, etc.—but that doesn’t mean that they couldn’t be. Given the right query (e.g., “display a map that shows purported land boundaries and their corner markers”), a map could be dynamically composed that portrayed corner locations as error ellipses and lines as having a “fuzzed-out” width according to their accuracies controlled by endpoint nodes and surveyor reliability. Now there’s a map that would start a multi-post rant on a surveyors’ online forum, for sure.
However, that’s not the path we want to go down in this series. My intent is much less lofty. I’d like to discuss:
- What data needs to be stored, and how, to automatically produce a complete plat map of a new subdivision?
- How can metadata be reliably conveyed in databased maps?
- How can custom labeling be derived for databased maps (human-understandable corner descriptions, bounding calls, etc.)?
I Need Your Insights
This is by no means a complete list; there are a host of other practical issues. The goal is to store a database that can produce a variety of maps, not just digitally storing the map analogs themselves. To do that, I need some feedback. I’ve put together a poll that should take less than ten minutes of your time (scan the code or visit the website below). Among other things, the feedback will guide future articles on this particular topic. It will also indicate the level of interest in the general subject of survey data management—something my editor seems to occasionally ask me about, as well.
Visit: www.surveymonkey.com/s/88HFB6M
SIDEBAR
 The Seven Bridges of Konigsberg Conundrum
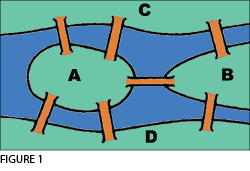
To get used to topologiocal concepts, geography educators often employ the following famous exercise. In 18th-century Konigsberg, Prussia, people walking through the city found there was no way to traverse all seven bridges connecting the landmasses around the Pregel River without going over a previously-travelled bridge. The mathematician Leonhard Euler showed that the possibility of a walk through such a network (or graph), traversing each segment only once, depended on the number of segments that enter/exit each terminus point of the segments. Euler abstracted the layout of the Konigsberg bridges into Figure 2.
Specifically (get ready for some new terminology here), Euler proved that a connected graph must have exactly zero or two nodes of odd degree (“degree” in topological context means the number of lines [edges] meeting at a point) in order for a minimal path to exist through it. In simpler terms, it must be a graph (think of a street network, not an open traverse with one way in and one way out of each point) that cannot have any dead ends but needs to contain only two three-way or five-way (or other odd numbered) “degree” intersections. A layman’s explanation of Euler’s proof is contained in James Newman’s World of Mathematics, ISBN-10: 0486432688.  In this type of spatial problem, it is not the angles and distances that are being examined, but rather the inter-relationships between the nodes (destinations) and connection paths (in this case bridges). This type of mathematics is called topology. Solving such rules of topology has opened an entire field of “rules-based” mapping for resolving connectivity of mapping features (like in solving routes in a car navigation GPS). These types of spatial data rules can be applied on the fly as database elements form maps, and this is widely used for managing utility and road networks, addressing, digital cadastres, and more.