This month we provide the history behind the theory and practice usually presented here by Dr. Charles Ghilani. This is an explanation of the first national horizontal datum used by the NGS (back then called the U.S. Coast and Geodetic Survey) in the late 1800s. In the 1970s when NGS created its database, the data developed on that datum had not been automated and were available only if you knew someone at NGS who knew how to interpret them (the author and one or our editors, Dave Doyle, we’re told). Their history reveals the evolution of NADCON grids that can be used to shift positions on the old datum to NAD 83(86).
Good maps of the coastline of the United States were few and far between in 1807, when shipwrecks were too common for a young country that depended on water for travel, commerce, foreign trade, and commercial fishing. Thus, president Thomas Jefferson established the Survey of the Coast: “… the President of the United States … is hereby authorized … to cause a survey to be taken … for completing an accurate chart of every part of the coasts …”
Evolution of Survey of the Coast
As the country grew, so did its mapping needs. The Survey of the Coast, the first of the nation’s scientific agencies, was dedicated to fulfilling those needs. Over time, its duties expanded into most of the physical sciences, and it underwent various name changes: the Coast Survey in 1836 and the U.S. Coast and Geodetic Survey (USC&GS) in 1878. The agency became part of the National Oceanic and Atmospheric Administration (NOAA) in 1970. Today the core of the agency’s high accuracy surveying and survey network maintenance, as embodied by the network of Continuously Operating Reference Stations (CORS), is carried on by the National Geodetic Survey (NGS).
A great many of the maps created by the Survey of the Coast were of coastal topography, or, as they came to be known, “t-sheets.” These maps, meticulously compiled by plane table observations, contained details of shoreline features as well as buildings and other cultural constructions on or near the shore.
For many years, Coast Survey computations and charts were created based on local or regional datums. Eventually, enough projects were completed to create a more unified datum in the northeast region of the county. By 1879 the New England Datum, based on the Clarke Ellipsoid of 1866 and defined by station PRINCIPIO (JV4790) and an azimuth to station TURKEY POINT (JV6081), both in Maryland, was completed for use in the New England states.
The great transcontinental arc of surveying along the 39th parallel further connected the New England Datum withother projects. A readjustment was done, and a new datum referenced to station MEADES RANCH (KG0640) in Kansas was defined and designated United States Standard Datum (USSD). The datum was officially adopted in 1901, with a name change to North American Datum (NAD) in 1913 when Canada and Mexico also adopted the datum. It remained the official datum of the agency until the North American Datum of 1927 (NAD 27) was created. From 1901 to 1927, thousands of charts and maps, including t-sheets, were created by the Coast Survey and referenced to the USSD/NAD.
Transforming T-sheets to NAD 83(86)
In 2005, NOAA’s Coastal Services Center (CSC) asked the NGS for assistance with a major project. They wished to translate thousands of t-sheets, based on the USSD/NAD, to the North American Datum of 1983(86) [NAD 83(86)]. The translation would require an update to NGS’ datum transformation program, NADCON, which did not, at that time, support USSD/NAD transformation information.The original NAD 83(86) adjustment involved digitizing millions of positions and observations into what was, at the time, the new world of a computer database. The focus, however, was moving from NAD 27 to the NAD 83(86) datum. With the exception of a few island datums, positions outside of the conterminous 48 states and Alaska or on older datums were not dealt with. NADCON was initially developed to transform positions between NAD 27 and NAD 83(86). Eventually, as NAD 83(86) was replaced with various state-by-state high accuracy, or HARN, adjustments, NADCON also expanded to include those new realizations of NAD 83. For each new type of transformation, a set of transformation grids needed to be created.
The first step to supporting the CSC request was to identify points that had both USSD/NAD coordinates as well as published coordinates on NAD 27 and/or NAD 83(86). USSD/NAD coordinates are scattered through old, hand-written volumes and indexes, special publications, superintendent reports, and other miscellaneous documents that had to be retrieved and studied. There is no central database or reference dedicated to the publication of USSD/NAD coordinates. Documents were pulled from storage and publications checked. Often, coordinates based on local datums had to be sorted from those based on the USSD.
Once located, the coordinates had to be keyed by hand into *80* computer records as defined in Input and Specifications of the National Geodetic Survey Database, also known as the NGS “Blue Book”(see example at left).
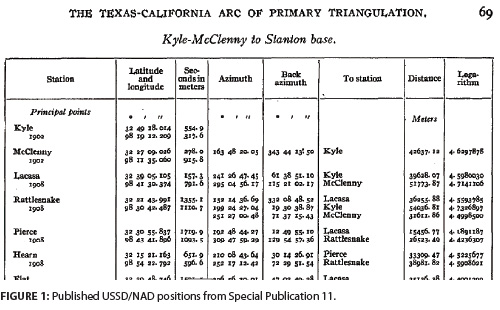
Several years were spent at this laborious data entry task. In some cases, the USSD/NAD coordinates were found in a document that was relatively easy to read (Figure 1). Often, however, values had to be deciphered from handwritten records (Figure 2).
After keying, coordinates had to be checked and then matched to coordinates in the NGS database for which published positions existed. The “designation” (name given to the mark) and the mark’s relationship with other stations were analyzed for each coordinate. This was a painstaking process that utilized a program (called Cluster) that takes an input file of positions and matches the positions to the database within a given distance. Sometimes the Cluster matches were relatively easy to see, with a match of designations combined with shifts appropriate to an area giving reasonable assurance of a station match (Figure 3).
At other times the station designations did not match closely and research was required. Each geodetic control point in the NGS database has a unique point identification number (or “PID”), which alleviates the difficulty of non-unique “designations” of points. Once a match was identified between a USSD/NAD point and a point in the database, the same PID could then be assigned to the USSD/NAD station. Of the more than 40,000 USSD/NAD stations keyed by hand, approximately 24,000 matches were initially made.
Historically, NADCON grids have been made “step wise”: NAD 27 to NAD 83(86), then NAD 83(86) to individual state readjustments. That process reflected only the availability of station data, however, not a necessity in grid creation. All that is required for NADCON grid creation is a pair of coordinates for each station. The grid programs then use the latitude and longitude differences in the pair to create NADCON grids.
Although the USSD/NAD was originally adjusted to NAD 27, and NAD 27 was then adjusted to NAD 83(86), CSC wished to transform maps directly from USSD/NAD to NAD 83(86). Therefore, these were the coordinate pairs focused on in the project.
Problems Discovered
Analysis of the datum shifts between USSD/NAD and NAD 83(86) was begun on a state-by-state basis, using the suite of internal NGS programs that support the creation and analysis of NAD-
CON grids. This allowed NGS to identify anomalous shifts between USSD/NAD and the datums, which helped identify mispunches, misidentifications, and new matches that could be corrected before trying to process all of the lower 48 states at once.
Most of the problems discovered involved intersection stations. Because of their visibility, these stations served as important control during the era of classical survey observations, particularly along coasts. Analysis and determination of solutions for this project often required retrieval of the hard copy of the original observations; the teasing out of answers for a single station could take several days. Some of the original work from that era has been sent to the National Archives and unfortunately is no longer accessible without physically going to the National Archives building.
Lighthouses in particular had often been misidentified during the NAD 83(86) project. At that time the internet did not exist for research (now, nearly every old lighthouse has a fan base with a web page documenting its history). Many lighthouses were moved or rebuilt over the years, but the same position was erroneously used for every year of observation when later adjustments were done, seriously skewing the NAD 83(86) position and therefore the USSD/NAD – NAD 83(86) grid shifts for both that station and any nearby stations adjusted with it.
Another source of difficulty was poor geometry. Occasionally, triangulation projects would cross each other or be physically close but never share common adjusted positions in the USSD/NAD. Position shifts between the datums could then be very different in direction and magnitude, which in turn caused such large shift discrepancies in those areas that the grids would be seriously skewed as the grid creation programs tried to process the divergent shift information. In these situations it was necessary to delete stations flagged by the grid processing programs as having the highest level of discrepancies between actual and NADCON-created coordinates in order to lessen the impact on the area as a whole. This left some areas weak in data.
There have been several agencies setting monuments over the years. It was not unusual for a mountain top to have several monuments, each set by a different agency—U.S. Forest Service, Coast Survey, and U.S. Geological Survey, for instance—yet all with the same “designation.” These are sometimes clustered within a meter of each other. They might also be under a positioned fire tower and/or on a positioned mountain top bearing the same name as the marks. Sorting out which position went to which station and understanding the relationships between the positions was sometimes very time-consuming.
Gaps in data available for the grids seriously impacted their potential accuracy in many areas. Approximately 24,000 data points were used for this project. In contrast, the CONUS grids for NAD 27 to NAD 83(86) datum were developed from approximately 200,000 positions (Figures 4 and 5).
Modern Solutions
As with lighthouses, many town and church histories are now available online, complete with pictures that can help sort out confusing areas of clusters of stacks and spires. For example, an online history and pictures of Stamford, Connecticut, combined with a topographic digital raster graphic, provided enough information about a dye works that repeated observations to different smoke stacks over the years could be sorted out.
Local naming conventions for physical features were not always consistent, and that occasionally showed up in survey records, making proper identification a challenge. Again, the web and online records proved invaluable. An online image of an 1860 newspaper article about a California gold mine helped prove that the points with designations “SIERRA BUTTE” and “DOWNIEVILLE PEAK” are the same, allowing USSD/NAD and NAD 83(86) positions to be matched.
Old postcards, sketches, photographs, current maps and addresses, and sometimes Google Earth also aided in matching, separating, and analyzing station positions and their relationships to other positions in the same area. Church pastors and staffs generally were happy to respond to questions concerning the history of their buildings, which often helped with understanding issues with spires and crosses on old buildings.
GIS was also very useful in understanding relationships. Often, a picture tells much more than a list of numbers generated by a program. Although NAD 27 coordinates were not used in creating the grids, plotting all available coordinates and visually reviewing their relationships facilitated new identifications and correction of misidentifications.
The triangles in Figure 6 show how coordinates on different datums related to each other in a particular area. The NAD 83(86) coordinate for SHAG ROCK BEACON (PID = PE2281) does not fall where it should if it were actually that beacon. Instead, it plots where the NAD 83(86) coordinate for a newer beacon with the same designation and PID = CU6260 should be. A problem of anomalous shifts was corrected by assigning the NAD 83(86) coordinate to the correct beacon. The SHAG ROCK BEACON carrying the PID PE2281 had never been adjusted to NAD 83(86).
Grid Creation
Months of analysis and corrections were followed by a final retrieval of all stations in the lower 48 states that had been positively identified as being a match between USSD/NAD and NAD 83(86).
Finally, grid creation began. This is a multi-step process that led to more winnowing, research, and corrections. In the end, USSD-NAD 83(86) grids were created using 23,296 matched positions. A comparison of actual positions to positions created by NAD-CON using the new grids concluded that the newly developed USSD/NAD 83(86) transformation grids of NADCON are accurate to better than 5 meters.
The USSD/NAD project was a massive undertaking, considerably more than was originally anticipated. Work on locating, keying, and loading positions that were computed on old datums still continues, adding new resources to NGS’ database for use by historians, cartographers, and researchers. The U.S. Standard Datum to NAD 83(86) transformation grids will prove invaluable in future analysis of historical coastal change, allowing more than a century of mapping to be based on a common reference system.