To create and share interactive 3D building models, Oregon adopts SmarterBetterCities.
To help formulate a 10-year strategic capital investment plan for the State of Oregon, the state’s Chief Financial Office (CFO) wanted to develop a dynamic, immersive, and collaborative visual platform that would illuminate key issues often lost in a tabular summary. Its audience was the public and the state’s legislature, and its goal was to visualize the plan in the form of a dynamic 3D web-mapping platform accessible from consumer devices.
In a radical departure from government style, CFO decided to pursue cheap, easy, and perhaps open-source technology, even if unproven. When a group of agency leadership saw the initial version—a 3D visual of a 100-year flood plain consuming state-owned office buildings—and immediately began to collaboratively discuss the issues it raised, CFO staff knew that they had met their goal.
While CFO started with a pilot area of the state capital, its intent is to visualize the state’s entire portfolio, as well as such external factors as natural hazards. However, web-based 3D runtime technology is still an evolving technology. To solve some of challenges it poses, CFO partnered with SmarterBetter-Cities, using their CloudCities platform (which was in beta at the time but has since been launched). This enabled CFO to accomplish tasks not yet possible with their underlying GIS technology.
The Planner with the Vision
As a kid, Daniel Christensen developed video games. As a planner working on economic development for a city government, he created textured models in Google Earth. They helped him sell the concept of dense urban housing in a suburb. Later, when he was working for Oregon’s state university system, it drove him crazy that all the information about building space and occupancy on its seven campuses was kept by a few people in spreadsheets on their computers. He envisioned a web-based map that would allow anyone to click on a building and see what was going on inside it.
“I thought that was a great idea,” he says, “and I knew that it was possible, but I didn’t realize how difficult that would be to implement at the time.”
He began to learn about building information modeling (BIM) and bringing BIM models together to create smart cities. “I can understand what’s going on in a context because all of those discrete features that make up a building have data behind them,” he explains. “It’s just a matter of packaging the data, querying it, and then having that query be delivered somehow, dynamically.”
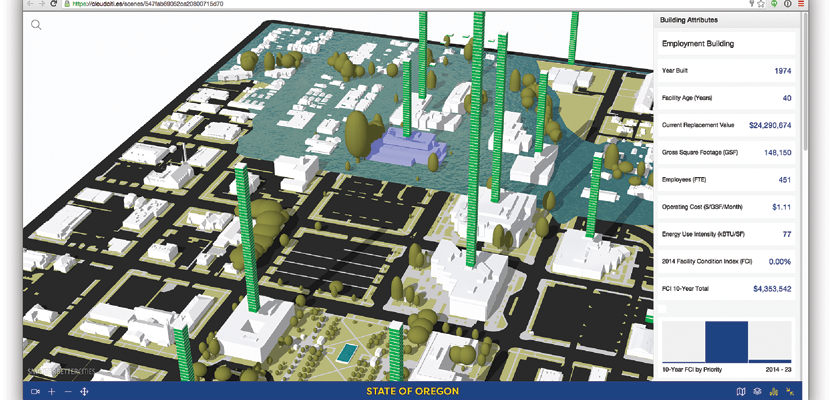
Now, as senior planner for CFO, Christensen is implementing his vision for an interactive, immersive 3D model of state-owned buildings that allows users to spatially access information about them—such as square feet, occupancy, current replacement value, and maintenance requirements. His proof of concept focused on the Capitol Mall in Salem, the state capital, because that one-square-kilometer area contains the majority of the state’s key office buildings. The state already had skin textured models of the buildings on the mall based on oblique aerial photography.

The Capitol Mall in Salem. Credit: M.O. Stevens.
SmarterBetterCities
At first, Christensen worked with Esri’s professional services division and used Esri CityEngine. Soon, however, he wanted to go beyond what he could create with that platform. “I wanted to create an interactive experience where people could have a tangible representation of data,” he recalls. Esri referred him to SmarterBetterCities, a startup founded in 2012 with the goal to develop easy-to-use business-developer tools for urban planning and management. Within five minutes of seeing what it could do, he was hooked. He says, “You’re looking at a building to query building information.”
SmarterBetterCities took the initial scene developed in CityEngine and packaged it into a demo. Next, the state signed an enterprise-level license agreement with the company, which provided the platform. Christensen only had to export his model from CityEngine as a 3ws file and upload it to CloudCities, the SmarterBetterCities SaaS platform.
What the Platform Does

Daniel Christensen, senior planner for Oregon’s Chief Financial Office, had always wanted a web-based map that would allow anyone to click on a building and see what was going on inside it.
When CloudCities reads a 3ws file, it separates and lists all the layers, which a user can then combine in new ways. One of Christensen’s favorite features enables a user to instantly see the inside of a floor of a building, without having to peel away one layer at a time. CloudCities models are not only visible on a desktop; they can be opened on any iOS mobile device so that team members can share them.
One metric that was relevant for CFO was each building’s facility condition index (FCI), which represents the amount of maintenance relative to the replacement cost of that building. State engineers assess buildings, determine the amount of maintenance required over ten years, and estimate the replacement value of the facility. Using CloudCities, Christensen color-coded buildings based on their FCI. He also experimented with doing extrusions to represent the FCI, in effect using building footprints to create a 3D bar chart.
The Future of the Project
The purpose of the proof of concept was to obtain support for the larger project because precise building models derived from photogrammetry and lidar data and stored on a server are expensive. Next, Christensen plans to expand its geographic extent and move to a more scalable, cloud-based approach.
Ultimately, Christensen thinks of his 3D model as a public service that would make information about state buildings easily accessible. For example, he points out, journalists and the public could use the model to easily find the information they need.
Additionally, the model would demonstrate the ability of the public sector to develop and implement advanced information systems and help educate the public about issues about which he is passionate as a planner. “We’re just trying to take information and package it in such a way that allows people to interact with it and creates a conversation that leverages outcomes,” he says.