How the AT was brought into GIS via a collaboration among ATC staff, NSP professionals, and dedicated volunteers.
Part 1 of this article (May 2015) reveals the history of the trail, particularly how the land that comprises it was surveyed. Read here about how the trail was brought into GIS.In 1998, the Appalachian Trail Conservancy (ATC) began its GIS program. Its first two challenges were to map the trail’s centerline as accurately as possible and to digitize the land tracks by scanning the “segment maps” that had been created by the Land Acquisition Office (LAO) of the National Park Service (NPS).
In 1999, Dr. Vernon Vernier, known on the trail as DelDoc because he was a retired doctor from Delaware, volunteered to walk the entire trail with a GPS receiver. “We took him up on his offer and planned out the type of information he should collect,” recalls Matt Robinson, a GIS specialist in the Appalachian Trail Park Office of NPS. “NPS acquired a GPS unit for him to use, and he walked the entire trail.”
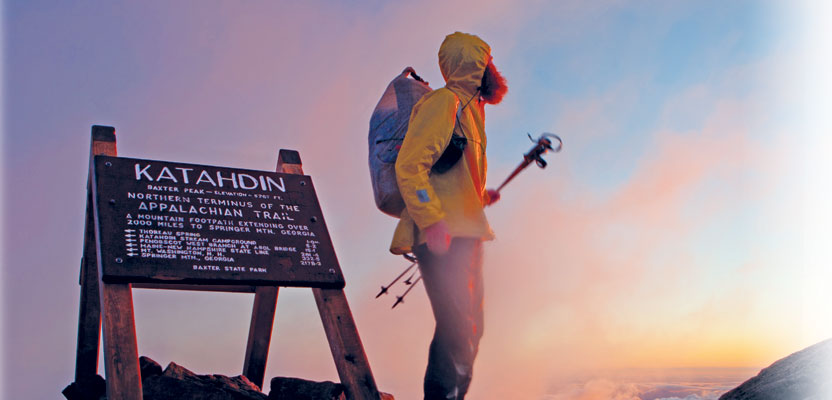
A hiker stands above the clouds at the Appalachian Trail’s northern terminus: the summit of Katahdin in
Baxter State Park, Maine. Courtesy of Jeffrey Stylos.
The centerline DelDoc collected had some errors, however, mostly due to the limitations of the type of GPS unit that he carried, so the ATC decided to repeat the process. In 2002, DelDoc set out again, “with a much better GPS unit that was able to hold on a lot better to satellite signals under canopy and had a much more complex data dictionary to collect feature information on the trail,” says Robinson, who helped extensively in preparing him for that project.
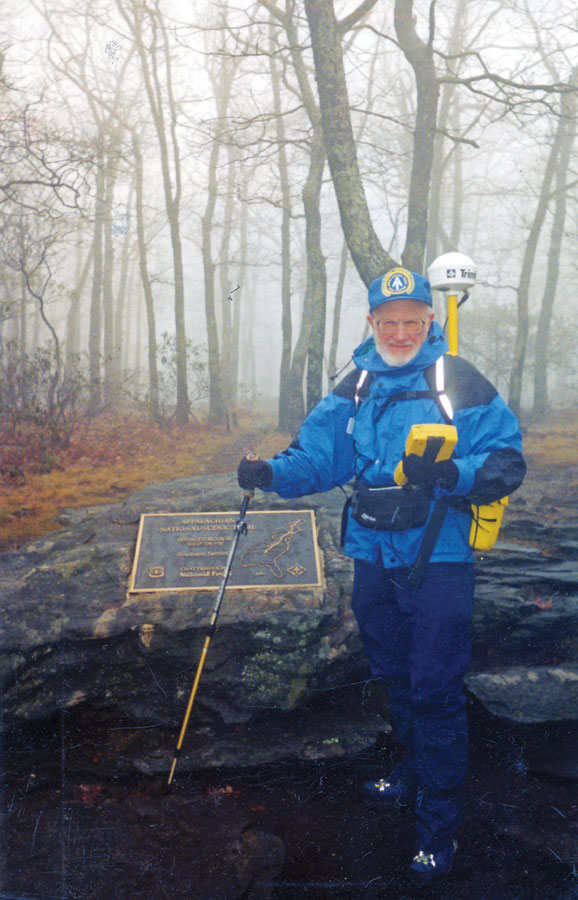
DelDoc stands at the trail’s southern terminus, Springer Mountain in northern Georgia, with Trimble GPS equipment that he used to record the location of trail’s centerline. This was in 2002 on the first day of his second GPS “thru-hike” of the AT.
DelDoc almost finished the trail in 2003, before quitting due to a twisted ankle. He was in his 80s and passed away a year later.
Another volunteer completed the trail in 2005 by walking Maine and a little bit of New Hampshire. “That gave us a much more accurate centerline, but also a baseline of shelters, parking areas, bridges, pretty extensive trail features,” says Robinson. “Those efforts provided our baseline for everything—at least core AT-related data that nobody else was collecting.”
Robinson helped to process some of that data and put it all together for the first digital centerline of the trail, which had previously been recorded on Mylar sheets. “This was actually the first digital representation of the trail,” he says. “It was also the first national scenic trail to ever be digitized like that.”
Robinson then began compiling other GIS data, such as state boundaries, county boundaries, and townships, and transitioning from the segment maps to a digital product. He scanned all the segment maps, georeferenced them, placed them in a GIS, and started digitizing.
“We started out using a digitizing table,” he says, “but technology was changing, so we moved to on-screen digitization and digitized all the lands.”
Keeping Track of Changes
In 2004, the ATC launched a trail assessment program for which staff walk and inventory the trail. They try to do 20% every year, so that within five years they have a full set of complete data for the entire trail. “We try to mark all the shelters and parking areas and all of those features, but, specifically, we’re looking for their conditions and any problems that need to be addressed,” says Robinson.
The ATC has now assessed the trail completely twice. “We use that information every year to update the baseline piece that volunteers help us collect. Today, I think we have a pretty accurate GIS, with features, with the trail centerline, with our lands, and a ton of base data that we’ve collected over the years, from everything from federal agencies to other nonprofits, such as the Nature Conservancy, which has a lot of protected land near the trail.”
The whole land acquisition process, Robinson points out, was very complicated and continues to be, because it is not complete. “Tracks are exchanged, different rights of way or easements are issued, so there are constantly changes to the land’s layer. As we acquire more lands and establish a more permanent location for the trail—the optimal location—we will not move it as much, but we still haven’t established that everywhere. We are still actively working on it 15 years later.”
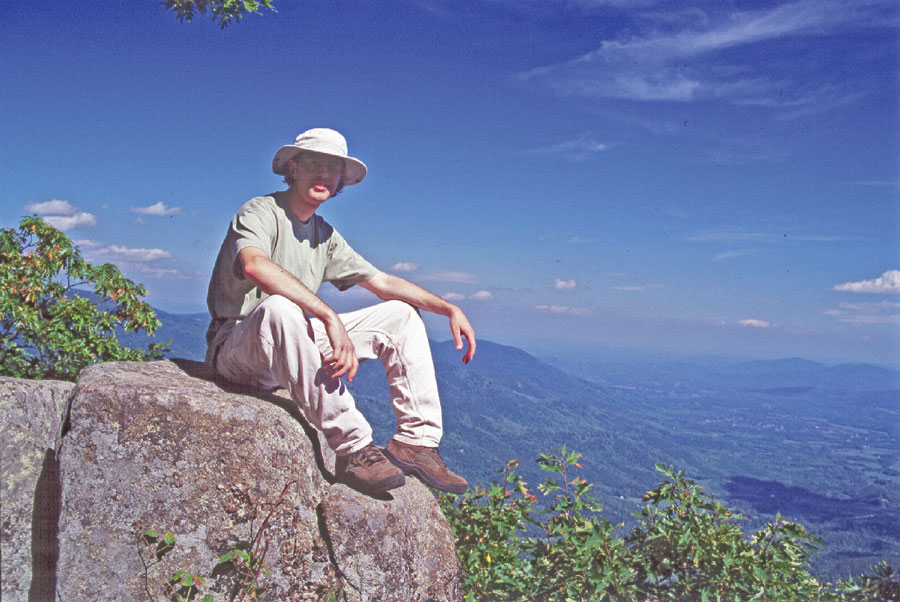
Matt Robinson, a GIS specialist in the Appalachian Trail park office of NSPS, sits on a rock outcrop on the top of Three Ridges, a mountain in central Virginia in George Washington National Forest, just off the AT.
In addition to the land acquisitions, every year many small changes are made that need to be mapped. “ATC field staff will typically go out there and map that for us and send us the data.”
While some areas of the trail are still less accurate than others, the centerline is generally accurate to between one and five meters, says Robinson. “Now, we are confirming a lot of that with aerial photography.”
A Unique Collaboration
Robinson began working on the AT in 2000 for the ATC. “I’ve been here since the start and built up the program. I was the first full-time GIS specialist with the ATC and with the AT,” he recalls. “I served for the ATC for 11 years and then, four years ago, transitioned over to NPS. Now, I am still doing GIS for the trail, but on the NPS side of things.” Even when he was employed by the ATC, however, he worked very closely with the NPS and was actually stationed at the federal agency’s AT office. “It is a really interesting dynamic. Even though I was a partner, I actively worked on a daily basis with NPS staff. So, it is a unique collaboration.”
The NPS staff dedicated to the AT, currently at ten full-time employees, has always been small compared to that of the ATC, which has about 50 employees, scattered over four regional offices up and down the trail and several home offices. “The model has always been for the ATC to do as much as they possibly can,” says Robinson. “NPS works to get funding and transfer it to the ATC to carry out a lot of the work as an NPS service contractor.”
In addition, there are 31 affiliated trail-maintaining clubs. “The ATC is like an umbrella over all these individual trail clubs that are each assigned a certain section of the trail to take care of,” says Kirk Norton, the current NPS land surveyor for the AT. “If I’m ever in an area—say, in New York or Pennsylvania—where I’m going to look at some new land or at an encroachment that might have occurred or something like that, all I have to do is call one of those local clubs and I will have three or four volunteers out there in a heartbeat to help me out. Many of them are attorneys or college professors, pretty skilled professionals on their own. I teach them the basics. I cannot say enough about the volunteers on the AT who are willing to take time out of their own lives and come out and help.”
The Hikers
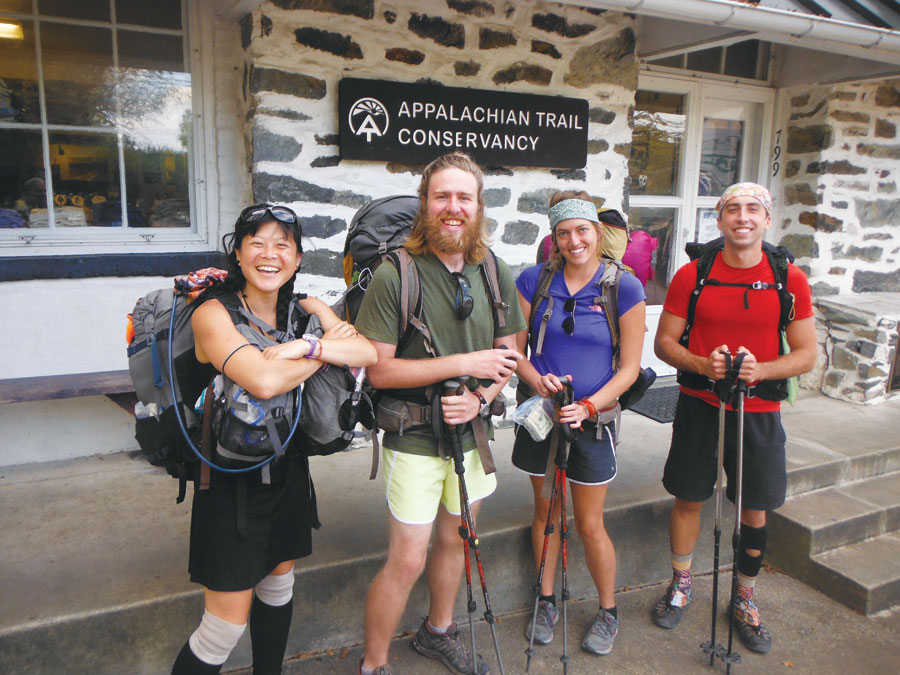
Thru-hikers pose at the ATC in Harpers Ferry, WV, known as the mid-point of the trail. Photo courtesy of ATC.
During the summer, there’s a culture of hikers along the AT. According to Bill Orsinger, director of survey at GPI/Greenman-Pedersen, Inc., an engineering and construction services company, most of these hikers fall into four categories:
-
the through hikers, who normally start down in Georgia as early as they can when it is still cold out then try to get the whole trail done before winter hits Maine; they usually end up getting to know each other,
-
people who hike the trail in segments, perhaps for a week each year,
-
hikers who backpack and camp for up to a few nights, as he does and,
-
people who just go out for a day hike, especially on the parts of the trail near populated areas.
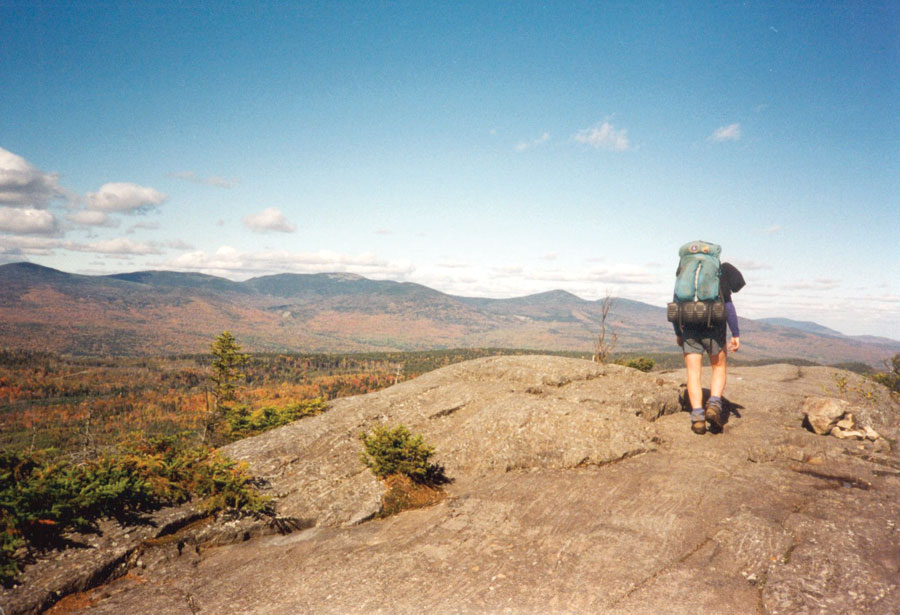
An experienced thru-hiker on Chairback Mountain in Maine; he has hiked the trail at least four times. Photo courtesy of ATC.
Bringing All the Data into A GIS
As the ATC began to increase its reliance on GIS, it began to use it for a wide array of projects and programs. Therefore, the challenges of bringing the entire trail into a GIS “have built over the years,” says Robinson. The main one, however, continues to be its length. “Physically visiting the whole trail is a huge task, as is getting additional data from all of our more than 100 partners. All that data may be collected at different scales, from different sources, and attributed differently. Trying to take all that and push it all together in a way that makes sense for the whole trail is a monumental task.”
The second challenge is the constant changes. “There are always new parcels,” says Robinson, “whether they are acquired by federal agencies or private individuals getting conservation easements on their land. There are constantly lands that are being protected, and we want to know about that. There are constantly new threats to the trail, such as different types of external developments—pipelines are a really big issue right now, power lines, new road crossings, new highways, and so on. Because of the trail’s length and the fact that it runs basically southwest to northeast along the East Coast, everybody needs to cross it.”
Nowadays, NPS mostly manages the AT—for example, evaluating the tracts that a pipeline will cross, its impacts, and from where it will be visible. “Therefore, we do a lot of viewshed analysis, 3D modeling, and things like that to evaluate the impacts,” says Robinson. “We also have many land management responsibilities and special use permits where we allow farming on our lands and different agricultural practices.”
“The surveys are, for the most part, good surveys for the time they were done,” says Norton. “Could we do them better now with better technology? Sure. Do they need to be redone? No, they’re mostly good surveys. They may not fit together perfectly in a GIS, but they weren’t meant to. When the exterior corridor boundaries surveys were started in 1982, GIS as we know it today didn’t even exist.”

NSP land surveyor David Hurst surveys part of the trail in Vermont in 1981.
Other Challenges
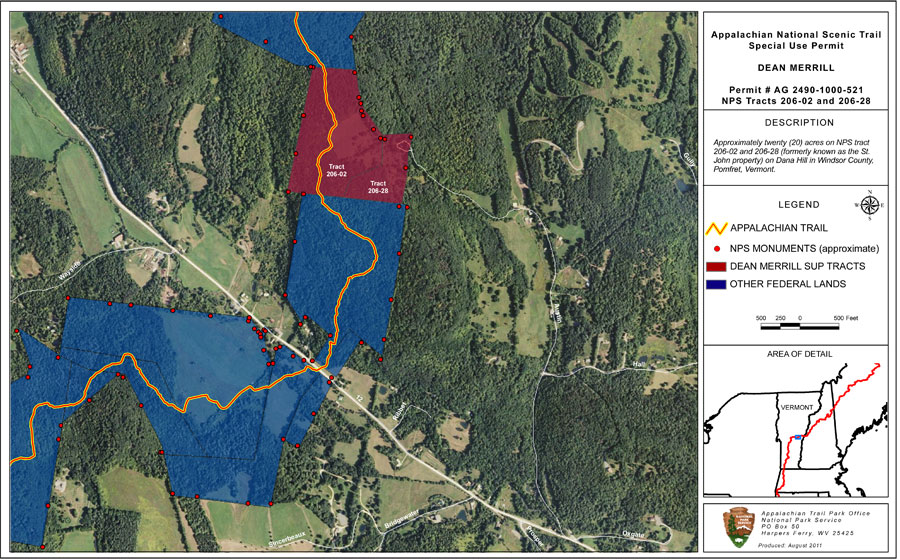
A 2011 aerial map of another Vermont section, used in conjunction with a request for a special use permit that is required for commercial activities and large groups of hikers.
When NPS hired land surveyors David Hurst in 1977 and Chuck Sager in 1984 to survey the AT, the biggest challenge they faced was getting access to the project sites. “In the Northeast,” Hurst recalls, “we would hike in from the sides of mountains to get into the center of it or where it goes across along ranges.”
There were places where the only access to the AT was through logging roads, Sager points out. “At a section in Maine, it took us three hours of driving just to get to where we had to start inspecting boundaries, so we spent six hours a day in the truck just getting to and from the job site. Of course, terrain up there is rough, too. It’s a wonder I was able to do that for 20 years because physically it was a challenge, especially if we were doing an in-house survey on one of these remote properties.”
The field crews for most of the contractors lodged at motels for three to six months. However, “in the more remote areas—such as Maine, Vermont, and New Hampshire—where the boundaries were a long way away from towns and access roads, contractors would actually run base camps,” says Sager.
While their survey crews always included a surveyor, Sager says, they would have somebody who would run the instrument and a second person who would help out. “We had to carry all of the equipment into the job site. The survey equipment was bulky and probably weighed about 60 pounds, plus we had to have enough food and water to last us through the day, too.”
Another problem was that, for the first five or six years, Hurst’s team was required to hire the surveying company that submitted the lowest bid. “We had a section of trail in Maine to be done and this group out of New York City got the job, because they were the low bidders, so we had to accept them even though they had no experience working in the mountains. They were low bidders and they were surveyors. They got stuck on this one stretch. They were all city guys and did not know how to live in the woods. They were fighting. They had a limited supply of drinking water and were getting sick from drinking from the streams and small ponds. Two guys on the team were fighting over who was using the most peanut butter on their bread, because they were getting short on it. That was a fiasco.”
Unfortunately, neither Hurst nor Sager took photos of their work on the AT. “If I had been smart at the beginning of the program I would have taken pictures as we went along, but when you start out you don’t think of things like that, you don’t think that 30 years down the road you wish you had. With all the equipment we had to carry, I think a camera was something else that we did not want to fool with!”
Over its 3/4-century history, the trail has continued to change, as have the technologies used to survey it and map it—from Avery’s wheel, to the first centerline survey begun in 1978 before GPS was available, to the latest online interactive map. Yet the centerline is generally accurate to between one and five meters over a length of nearly 2,200 miles. This remarkable feat says as much about the collaboration among volunteers, ATC staff, and NPS professionals as it does about the technologies they have employed over the years.