Thank you to all of you who commented and discussed my last QGIS v ArcGIS article. Many of you pointed at some of the perspective taken with the article, for example, there was mention that it wasn’t fair as ArcServer wasn’t tested or that the 3D tools weren’t compared. Yes, you are correct, it would be unfair to compare tool to tool. QGIS is far superior in some areas and ArcGIS superior in others, but aren’t those the reasons why we choose the software?
This comparison is based on basic “GIS” functionality. The best way to see it is, “What would my 8 year old daughter use?” It is easy to get too technical and start tearing apart the extensions or plug-ins, but in an everyday-use situation our lives are going to be wasted in the amount of time it takes to export a map or load a file.
This time around I will be comparing QGIS 2.8 (on Windows) and ArcGIS 10.3 (on Windows) and new boy on the block ArcGIS Pro. These software were tested on identical Dell Xeon E5 1620 CPU workstations with 32GB of RAM and using Windows 7 Enterprise with no customization and on fresh installs.
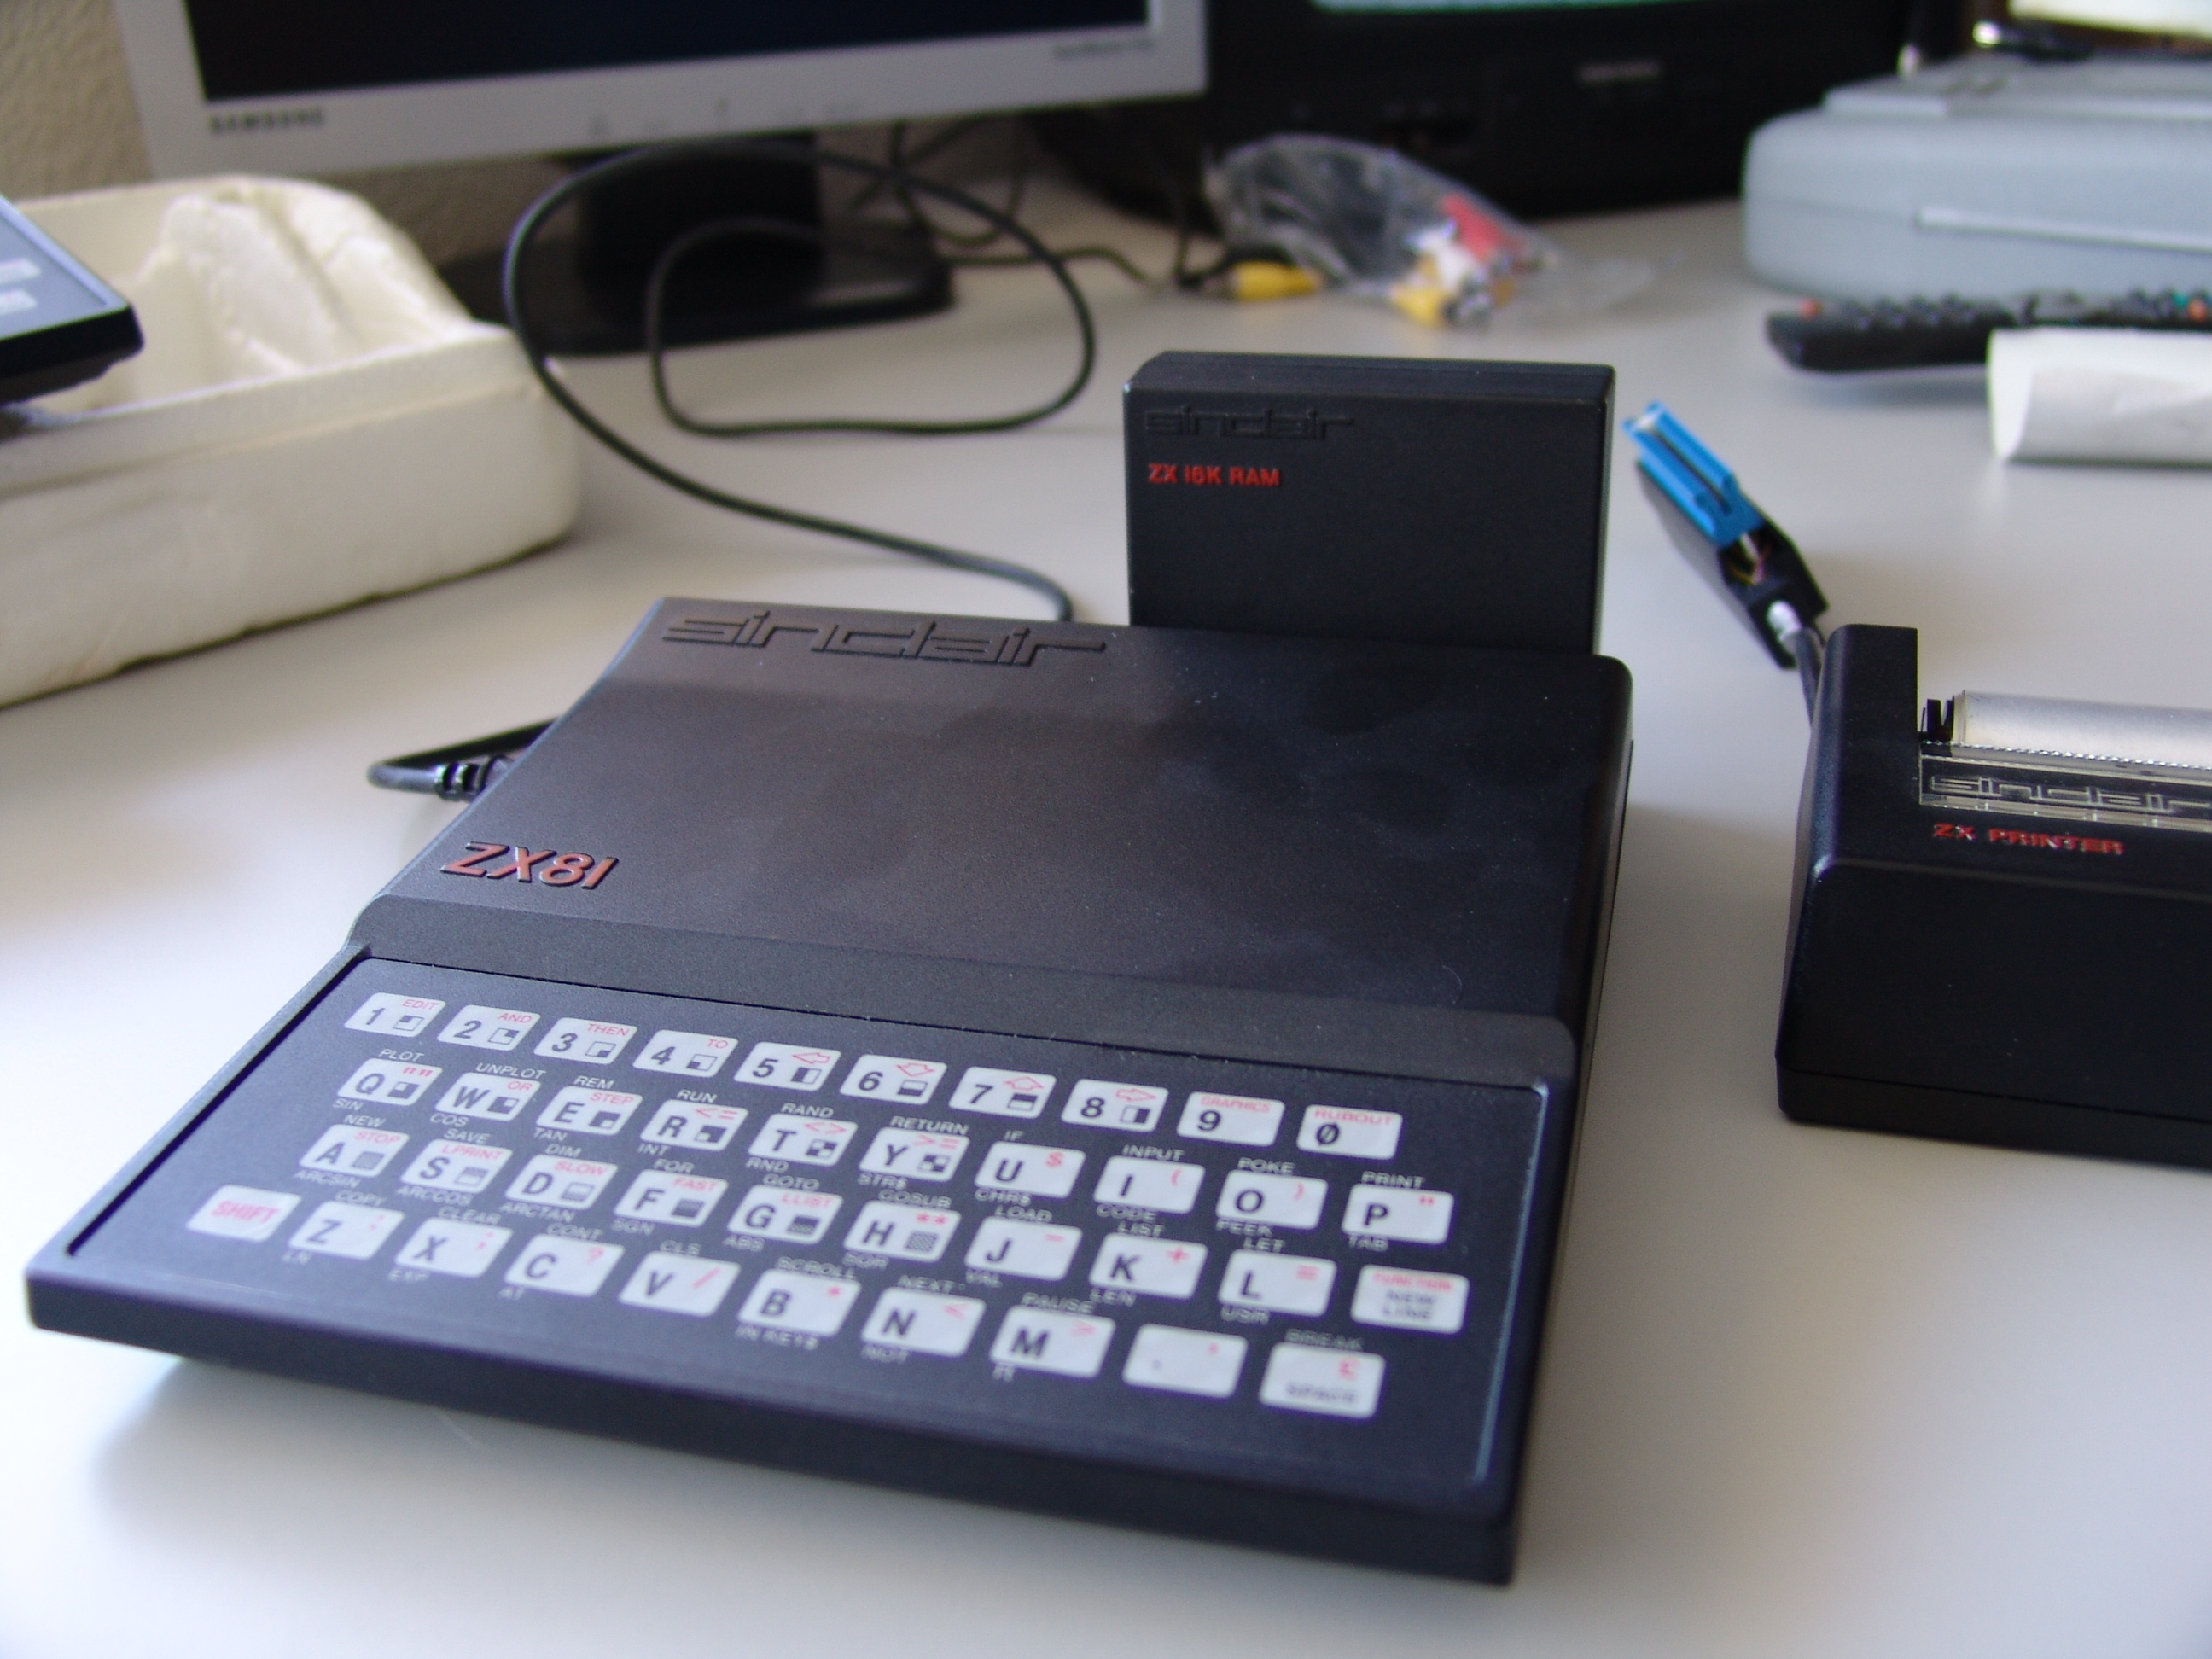
My last machine
1. Price
Price hasn’t changed for either product. QGIS is still open source and ArcGIS is still proprietary. for more information see the original article.
2. New Features
New in QGIS 2.8:
- Advanced Digitizing – Provides tools like parallel, perpendicular, locked angels etc.
- Map frame rotation – Not just limited to the Layout/Composer
- Embedded Heat Map Style
- Group Layer Styles (QLR) – Save groups of layers and their styles
- PostGIS performance improvements – BIG improvements!
- Updated legend styling – More options for expressions and display
- New function editor – Create your OWN functions!
New in ArcGIS 10.3
- Buffer tool – Now has planar AND geodesic options
- Spatial Join – Now has geodesic options
- Conversion Toolbox has “From PDF” – Currently only supports from PDF to Tiff
- Data Management Toolbox, Create Raster Type
- Data Management Toolbox, Diagnose Version Metadata
- Data Management Toolbox, Diagnose Version Tables
- Data Management Toolbox, Repair Version Metadata
- Raster Mosaic Toolbox, Apply Block Adjustment
- Raster Mosaic Toolbox, Analyse Control Points
- Raster Mosaic Toolbox, Append Control Points
- Raster Mosaic Toolbox, Compute Control Points
- Raster Mosaic Toolbox, Compute Tie Points
- Spatial Analyst Toolbox, Viewshed 2 – uses geodesic methods
- Server gets mxd to WebMap – Although this listing is “like for like” I had to add this in. It is pretty cool and a nod to how far we have come in the industry.
2. Interface
Between the last versions of both software there have been no interface changes, with the exception of the introduction of ArcGIS Pro (this needs discussion separately). For more information about the two interfaces, see the original article.
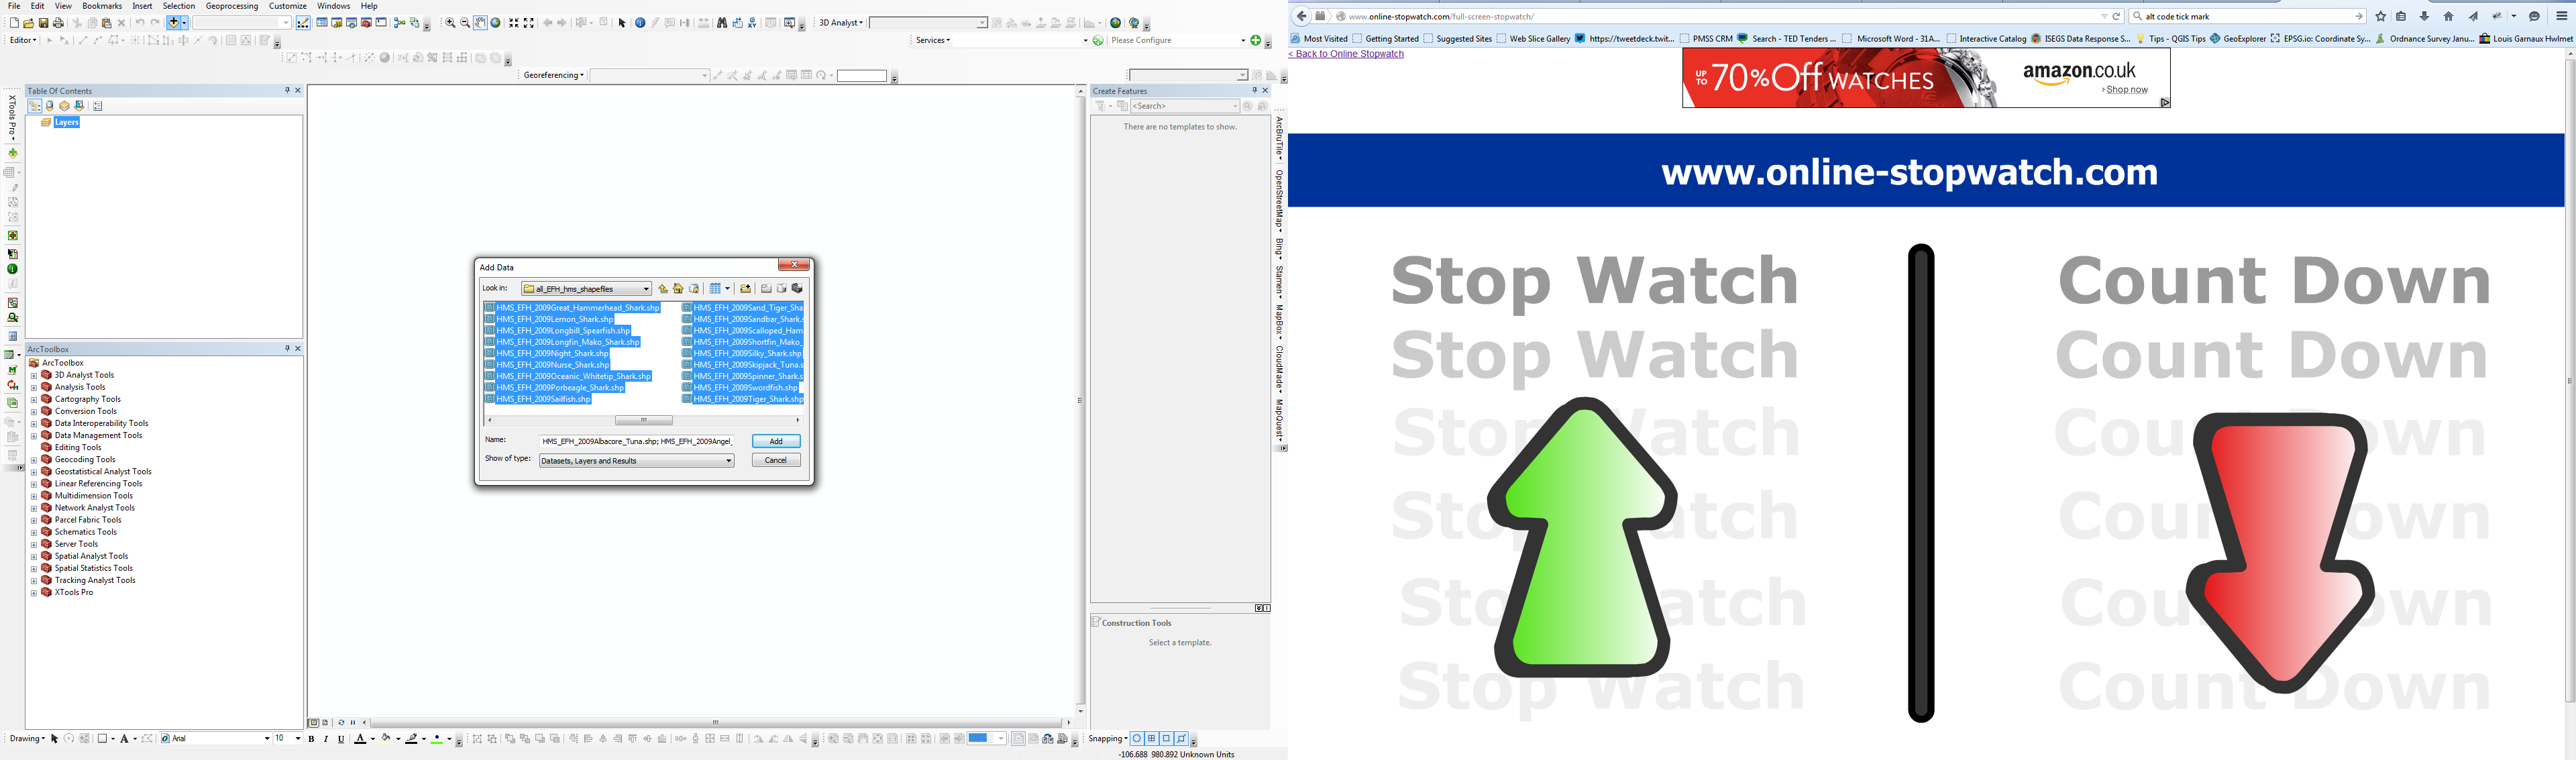
Testing ArcGIS 10.2 in Dualscreen
3. Testing – Load Time
As this is a comparison of the two new updates. Rather that witter on about my personal views, I thought it better to provide some test results. To make the test equal, the method I used was to start up the software being tested, leave it for 10 minutes (to ensure all elements have loaded), and the add ALL the EFH shapefiles and 2010 AIS from a folder in the root – C:\GIS\.
If you wish to test the data yourself, it can be downloaded from here. The timer was started from the moment that the data is added to the data frame (through the add data button). The timer is stopped when all data has finished loaded, indicated in ArcGIS by the globe in the bottom right not spinning and in QGIS by watching the windows processes and seeing when the CPU demand dropped to zero again.
The time given is the average of the five runs which were made.
Results:
ArcGIS 10.2 = 27.27 seconds
ArcGIS 10.3 = 38.5 seconds
QGIS 2.6 = 9.103 seconds
QGIS 2.8 = 8.201 seconds
On average QGIS was 20 seconds faster to load the data. Furthermore, there was a slight speed increase for QGIS from 2.6 to the newer 2.8
4. Testing – Analysis
What use is your software if you spend your days waiting for it to finish a process? One test that I always run is a viewshed test. I put a single point down, in this test, a shapefile at 526451, 78576 (OSGB36 BNG). Then, using standard settings, I run a viewshed (ensuring the output raster resolutions are identical)
ArcGIS 10.2 = 42 minutes
ArcGIS 10.3 = 4 failed attempts & gave up*
QGIS 2.6 = 58 minutes
QGIS 2.8 = 1hr 16min
*To eradicate any issues with the data input or user error, the ArcGIS 10.2 map was saved and then opened in 10.3. The exact same parameters were used with no success.

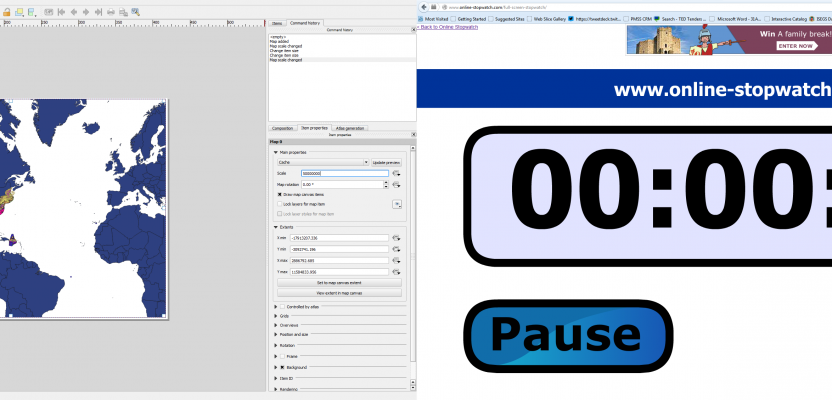
Testing QGIS 2.8 in dualscreen
5. Testing – Map Export
I seem to lose days exporting PDF files from GIS, so for me, this test is one of the most relevant so that I can compare the amount of time consumed by the simple “PDF Export.”
For this test, the same EFH shapefiles used previously were loaded, no styles applied, then the bathymetric contours (also from the Marine Cadastre website) and the Esri world countries shapefile. I then opened the layout/composer and set the orientation to landscape and the size to A3. Scale was set to 1:50000,000 then centered on the EFH data.
Once loaded and left to settle for10 minutes, I set the PDF export to 500dpi and then made sure that both the QGIS and ArcGIS settings were the same (no layers, no georeferencing etc). This is the average times for five runs.
The results were as follows:
ArcGIS 10.2 = 3mins 18s – File size 795MB
ArcGIS 10.3 = 3mins 30s – File size 903MB
QGIS 2.6 = 37.4s – File size 72MB
QGIS 2.8 = 35.5s – File size 69MB
6. Review of Niggles & Life savers
Although not entirely consistent with the rest of the test, I think it useful to keep track of the “niggles” to see whether they get addressed. My aim is to keep this open to readers to provide their own, and as long as they are sensible, I’ll add them to the list. I would like to keep this to a maximum of 10 items per software.
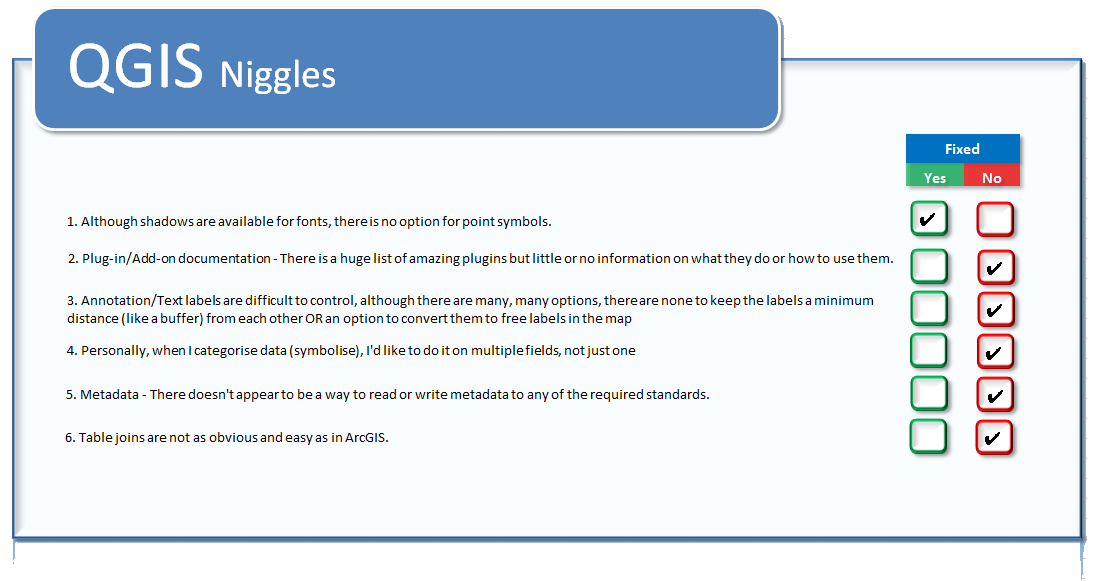
QGIS Niggles
Note: With reference to point 5, although there is a metadata plugin, there is not a metadata engine or facility in the core. To be a fair comparison, I therefore have to dismiss this even though it is quite good.
Note: With reference to point 6, there are some great methods for table joins outside of the core of QGIS, as above this cannot be taken into consideration, unfortunately.
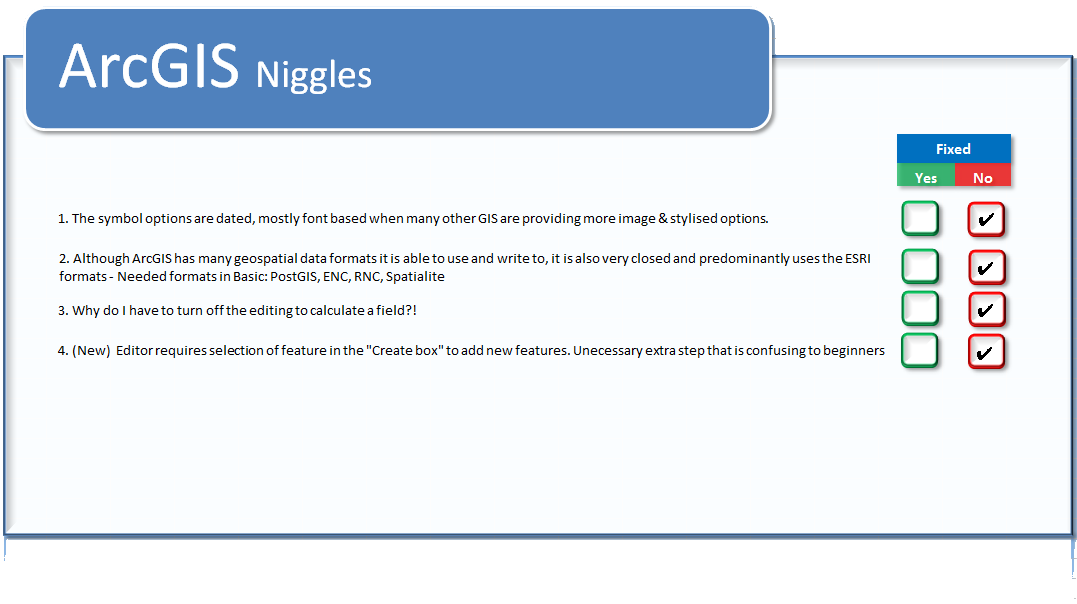
ArcGIS Niggles
7. Conclusion
As well as comparing the times above, I also check both software by opening a list of tools that are used within the office on a regular basis to ensure that the software is safe to be used.
As stated previously, it would be unfair to compare the tools as some tools are unique or paid-for plugins. Needless to say, I found no issues in my testing.
In this comparison, I think that, although ArcGIS 10.3 has released a HUGE number of new tools and updates, they are in large for specialists. These tools are unlikely to get used on a regular basis by people like you and me.
QGIS has shown some muscle and has, in this testing, shown itself much faster for the more everyday tasks. Furthermore, one of my “niggles” from the last article has been dealt with: the shadows for points and fonts. Although there are only a handful of updates and new features, the new tools (for me) are more likely to be used.
Again, as stated in the original article, there is no clear winner as they are both great systems and suited to different professionals in different ways. For basic use or an introduction to the world of GIS, you wouldn’t go wrong whichever you choose. They will both provide you with far and beyond what you would expect.
UPDATE
QGIS Niggle 4 is resolved!
Late last night I spoke with QGIS developer, Nathan Woodrow, the man behind the categorisation interface in QGIS core, and he was quite quick to point out that there are a couple of options in creating multiple categories, the most straightforward being using the basic categorisation and then using an expression to append further fields.
I think this is partly my fault for not noticing the option in my blind rage and also partly the fault of QGIS for being far too clever and not having a big red button which says “press here.”
Nonethe ess, QIS niggle 4 is resolved …. I’m now running out of issues with QGIS!!