The holy grail for many (UK) map users is the Ordnance Survey 1:25,000 scale “Explorer” map. Not only are they easy to read due to the fantastic cartography used, but they also have information which is hard to source such as public rights of way, National Trust & Woodland Trust sites, even wind farms. To the casual rambler the map provides everything they need. To a business user, the map provides enough detail to undertake high-level scoping exercises and basic site analysis. It really is a great product; unfortunately, it is only available as a raster dataset at a cost. Around 10km² is currently around £50 at best.

So what if there were a way of recreating the Explorer map for free?
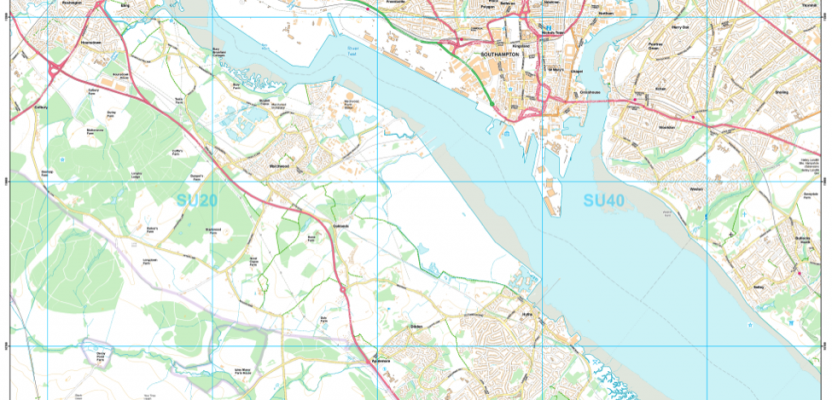
With the recent release of the OS OpenMap (free) product it has become possible to get pretty close using data available in the public domain. Here is a map I created for a British Cartographic Society competition:
 Yes, there are public rights of way, contours, even heritage sites. Let’s go through where this data came from and how it was all compiled. The data can be downloaded from here:
- OS OpenMap
- Public Rights of Way – From Councils or the rather amazing site ‘ROWMaps‘ by Barry Cornelius
- Woodland Trust Sites – From the Woodland Trust
- National Trails: Natural England
- Contours – From the OS Terrain 50 dataset
- Spot Height – From the OS Vectormap District dataset
- Heritage Sites – From the OS Vectormap District dataset
- Tourism Points – From the OS Strategi dataset
- Wind Farms/Renewable Energy Projects – From the Restats monthly extract
I’m not going to teach you to suck eggs; if you have got this far you obviously know what you are doing and how to manage the data. Therefore, I am going to skip the steps on merging data and/or tiling data.
Instead we’ll move on to the styling of the OS OpenMap. Until recently OS would not provide styles for their digital data—I have heard legend of users being told that it is up to the user to style the open data. Times have changed, and OS have not only started to provide styles in both QGIS and ESRI formats but also advice on cartographic principles!
The public rights of way are provided in several different formats, GML, KML, Shapefile & MapInfo. To get this to work I used QGIS and the modeller to get one single set of data. The styles for them were based entirely on the OS 1:25,000 legend (here) – Thank you (again) to QGIS and the colour picker tool!
Woodland Trust sites & Heritage sites were relatively easy to symbolise; colouring them is a synch, but the only way I could render the icon (well) was to create a point datated from the polygons. Tourism Points were something else. I wanted to ensure that I had the symbols relatively close to the originals and started out drawing them up as icons, until I came across a font set in my ArcGIS called “Strategi”. Yes, it turns out that Ordnance Survey released most of the tourism symbols with their Strategi release. You can obtain them here.
Like the public rights of way, the renewable energy projects require a bit of work. If you obtained the CSV file, then creating some points of the locations isn’t hard using the Eastings and Northings provided and then removing or correcting any which may land in “Null Island”.
Its at this point I had to make a cartographic decision. It would be quite easy to go further and add the MOD danger sites (available from navigation charts), Cycle Routes (from Sustrans), and Youth Hostels (from YHA), though the purpose of the map (for me) is as a base layer to put other data on top of, to understand how my information relates to real-world features and those on the OS Map.
Styles can be obtained here for both ArcGIS 10.3 & QGIS 2.10