Using GIS for utility asset management: the Water Supply Asset Management System
The cost of maintaining water system utilities is a concern of all responsible administrative authorities. And utilities are assets that need to be sustained rather than replaced again and again to provide people with quality service.
Therefore, better asset management is needed; without it, you have incomplete, inaccurate, and unreliable asset records. With improved asset management, it is possible to reduce overall infrastructure costs instead of waiting until the assets fail, incurring higher than necessary costs.
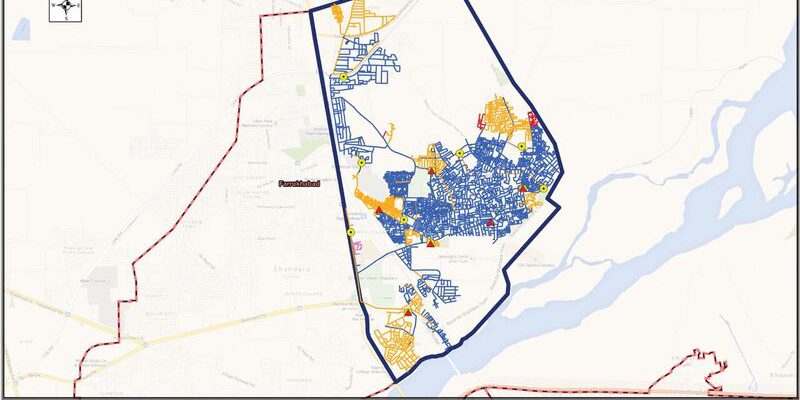
In our system map, the existing situation of the water supply network is shown as aligned with a city boundary.
Water Supply Asset Management System (SWAMS) is an approach to develop a GIS- based asset management system for water supply through spatial and non-spatial data integration, field verification, and analysis.
It is the combination of data, software, processes, field verification, analysis, and output—such as risk-level and cost identification and maps’ condition assessment and required renewal time. The process of schematic mapping and data conversion using paper records, CAD maps, and information entered in a GIS-based asset-management solution ensures accurate and sufficient information for effective management.
The results of this system will be in the form of maps that will be shared with all stakeholders such as asset-management authorities and policy-making departments. This project was implemented initially for the water-supply system of Shahdara, a northern subdivision of Lahore, in Punjab Province, Pakistan.
SWAMS was created for:
- timely, conditional assessment mapping,
- timely risk-level identification, and
- mapping to learn the renewal time required for any water supply.
Why GIS?
Land-use patterns significantly change over time depending on factors such as unregulated management actions, social pressure, and demographic movements. Therefore, location is the most important information for studying water supply systems. GIS integration with water supply leads to better visualization of our data and can keep check on the performance of utility systems and services.
Spatial location of water assets produces information that can be used in decision-making support for redevelopment. GIS positions for water-supply utility assets can be exactly located, analyzed, and visualized with the help of maps.
Performance of an asset-management system can be improved by integrating GIS with supporting spatial analysis and locating spatially dispersed water facilities. Developments in GIS technology offer new options to realize fast and cost-effective management of water-supply infrastructure.
GIS use with a water supply system will help authorities overcome the challenges of data integration and management for effective decision making for future planning. It can help remove poor strategic policies and strengthen long-term planning.
Why Lahore?
Lahore is a major city of Pakistan and the capital of Punjab province, with a population of 5.143 million. In Lahore, the Water Supply and Sanitation Agency (WASA) is responsible for providing water supply services for a 17-hour continual supply.
Most of the population has access to water facilities, and the demand for water changes with the seasons. High population growth has increased water use, and poor water supply services and sanitation lead to water-borne diseases such as dengue and Hepatitis C. Each year millions of Pakistanis suffer from these diseases.
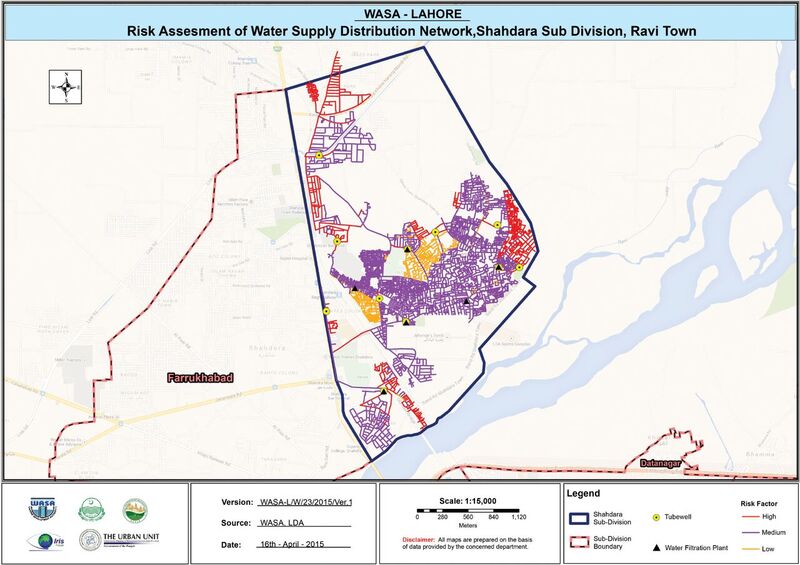
This risk map shows which water lines urgently require replacement or serious decisions
Many challenges exist to WASA’s work, and plenty of improvements are required to achieve successful asset management. Decision-making regarding infrastructure maintenance requires large amounts of diverse information such as what assets are to be installed, when to replace them, and when to carry out maintenance work on a continuing basis. Information from different resources can be integrated into one manageable system by using GIS.
Performance of an asset-management system can be improved by integrating GIS with supporting spatial analysis and locating spatially dispersed water facilities.
In this study, an inventory of utility assets was created by using paper records, maps, and staff knowledge of the WASA Lahore sub-division, Shahdara. Through field verification, an asset management program will enable the community to have a record of its capital assets.
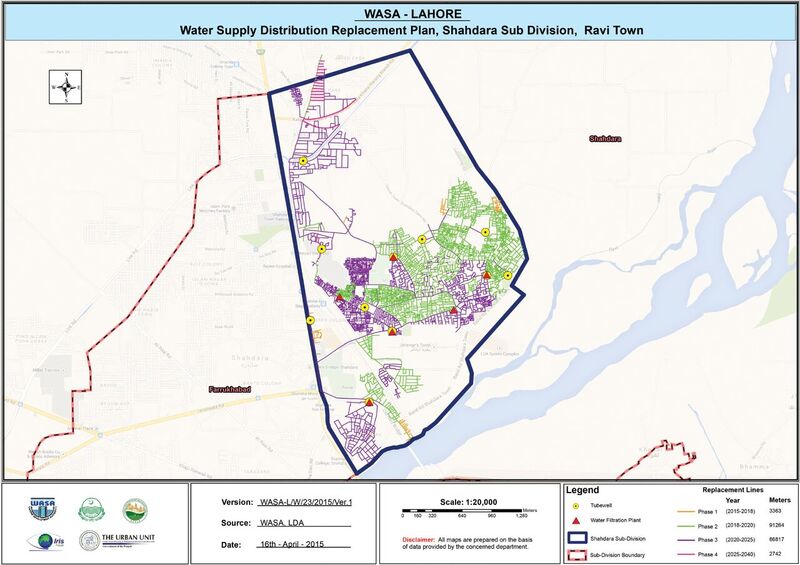
This phase map shows which assets must be replaced in five years, in the next five years, and so on. Peri- odically systemized data helps make long-term management possible.
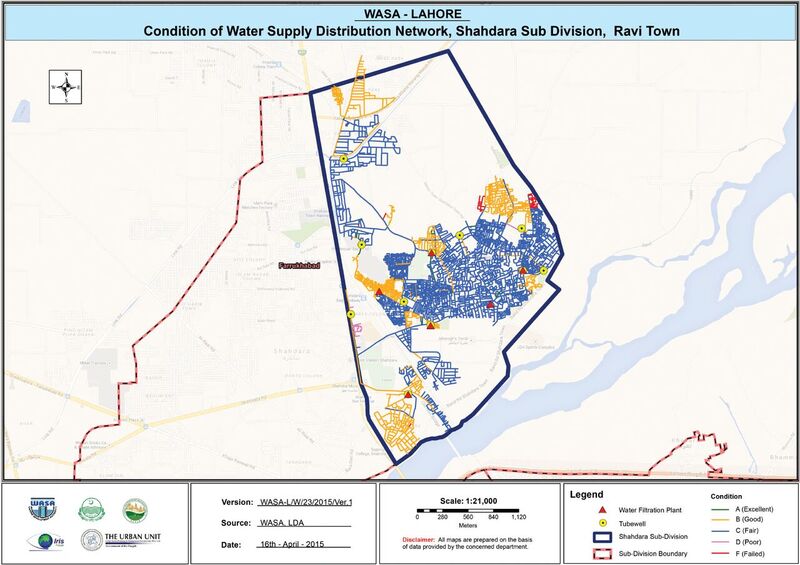
Inventory of water supply infrastructure includes water distribution pipelines, tube wells, valves, water filtration plants, and overhead reservoirs, while sanitation infrastructure consists of sewerage pipes, manholes, disposal stations, wastewater treatment plants, and lift stations. The current status of assets and level of service provided is investigated and evaluated by performing spatial analysis. All asset maps in SWAMS are classified based on their condition, useful life, and risk level.
The SWAMS system ensures the health and safety of the Shahdara people, contractors, and anyone who enters the WASA working areas; they are not compromised by WASA development activities. This asset-management system ensures health and safety accountabilities and provides appropriate information and education about the water supply system.
The author is one of xyHt’s 2017 Outlook 40 under 40 geospatial professionals. See her profile, here.
To read the rest of the articles in this print issue, click on the issue cover, below.