It’s been almost a year since the web mapping series I did. Hopefully, by now, you’ve had a chance to have a little play with some of the options. If not, don’t worry, I have a sneaky confession to make… I held back on one option, QGIS2WEB, which is a wysiwyg plugin for QGIS.
Why did I miss QGIS2WEB off the list last year? Well, I had blogged about it before, and at the time it was still a little unstable. Not any longer. Tom Chadwin has devoted a LOT of time to improving it, and the results are worthy of a blog on its own. For now, Tom will have to do with a virtual pat on the back, as we need to get on with the good stuff.
QGIS2WEB is a QGIS plugin that enables the user to export his or her map to a Leaflet or OpenLayers web map. By ‘web map’ I mean a fully built html page with the relevant data all in a single folder. This enables you to then run the map using the localhost or through the web by embedding it or adding it as one of your website pages.
Here is an example of one I did earlier: Southampton_Noir. Pretty impressive huh?
With QGIS2WEB, this was about 1 hr of styling and manipulating the data, then 10 minutes of copy and pasting the html to the “QGIS2WEB” folder on my website. Really, it is THAT easy! If you have a Github site, it’s all free too!
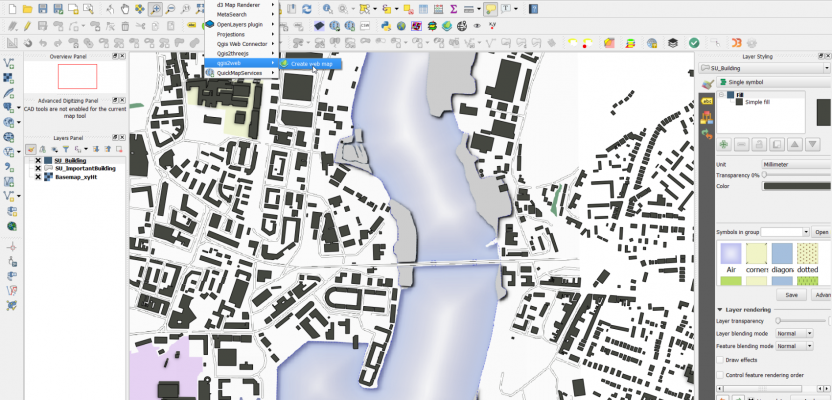
Open up QGIS 2.18 and, if you don’t have the QGIS2WEB plugin, navigate to the plugins tab (top left) and install (it is free!). When you navigate to the web tab, you will see there is a new option for QGIS2WEB.
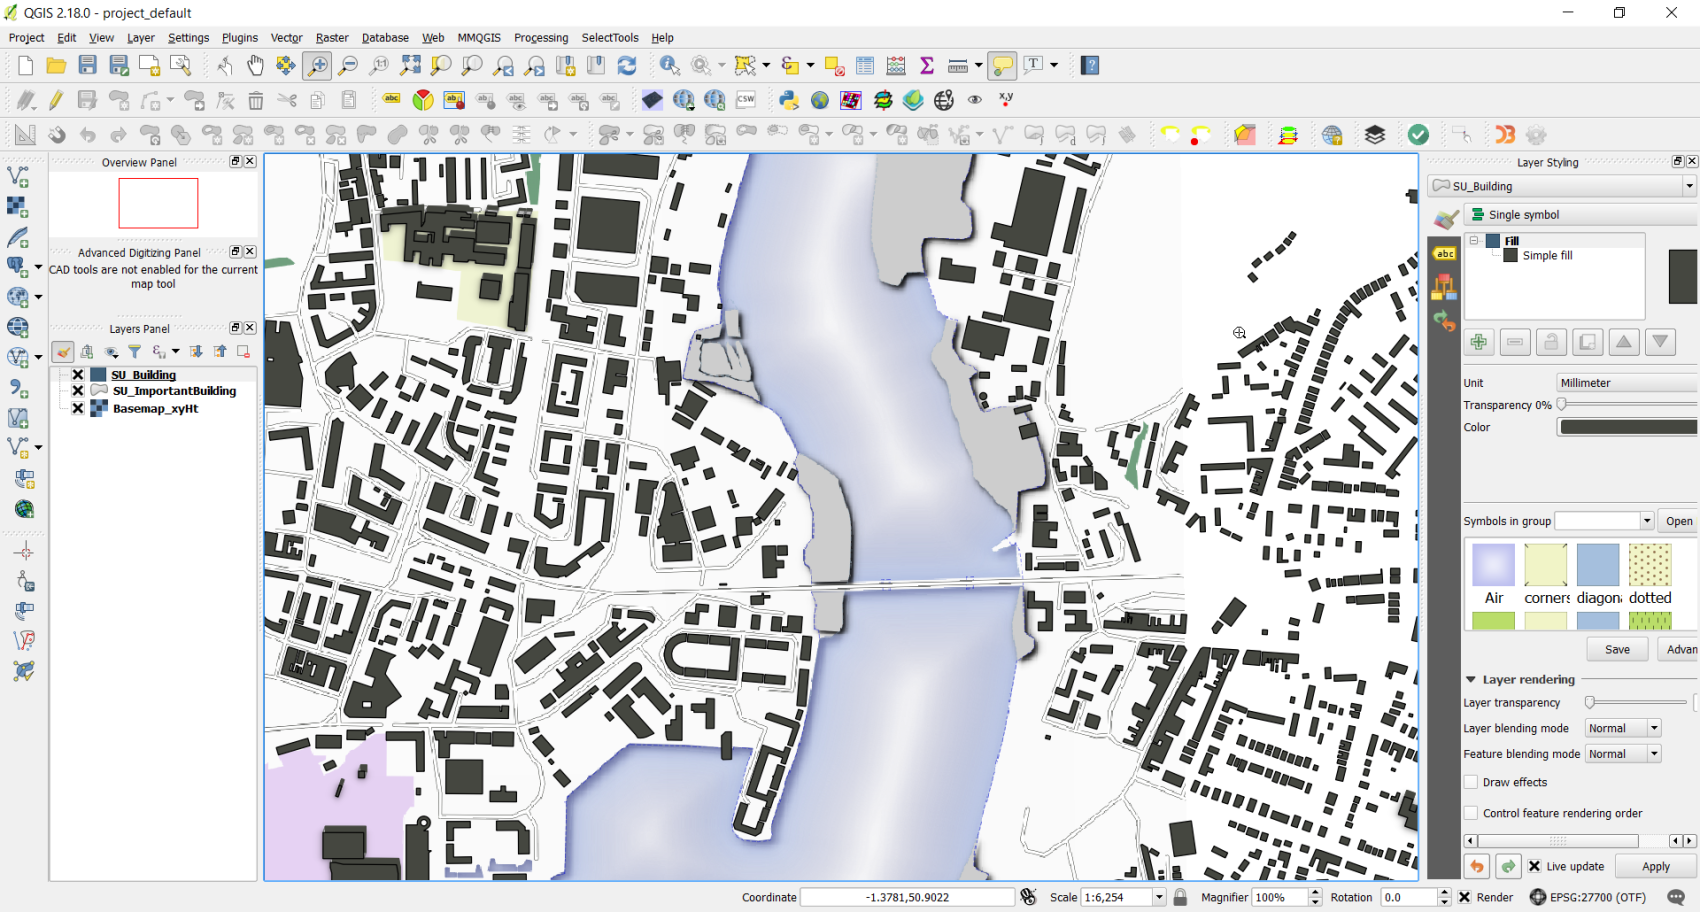
Now, make a map! Obviously huge amounts of data will make for a slower map, but don’t feel restricted by the coordinate system or style as QGIS2WEB supports the 2.5D renderer as well as most of the other style options.
Click to view
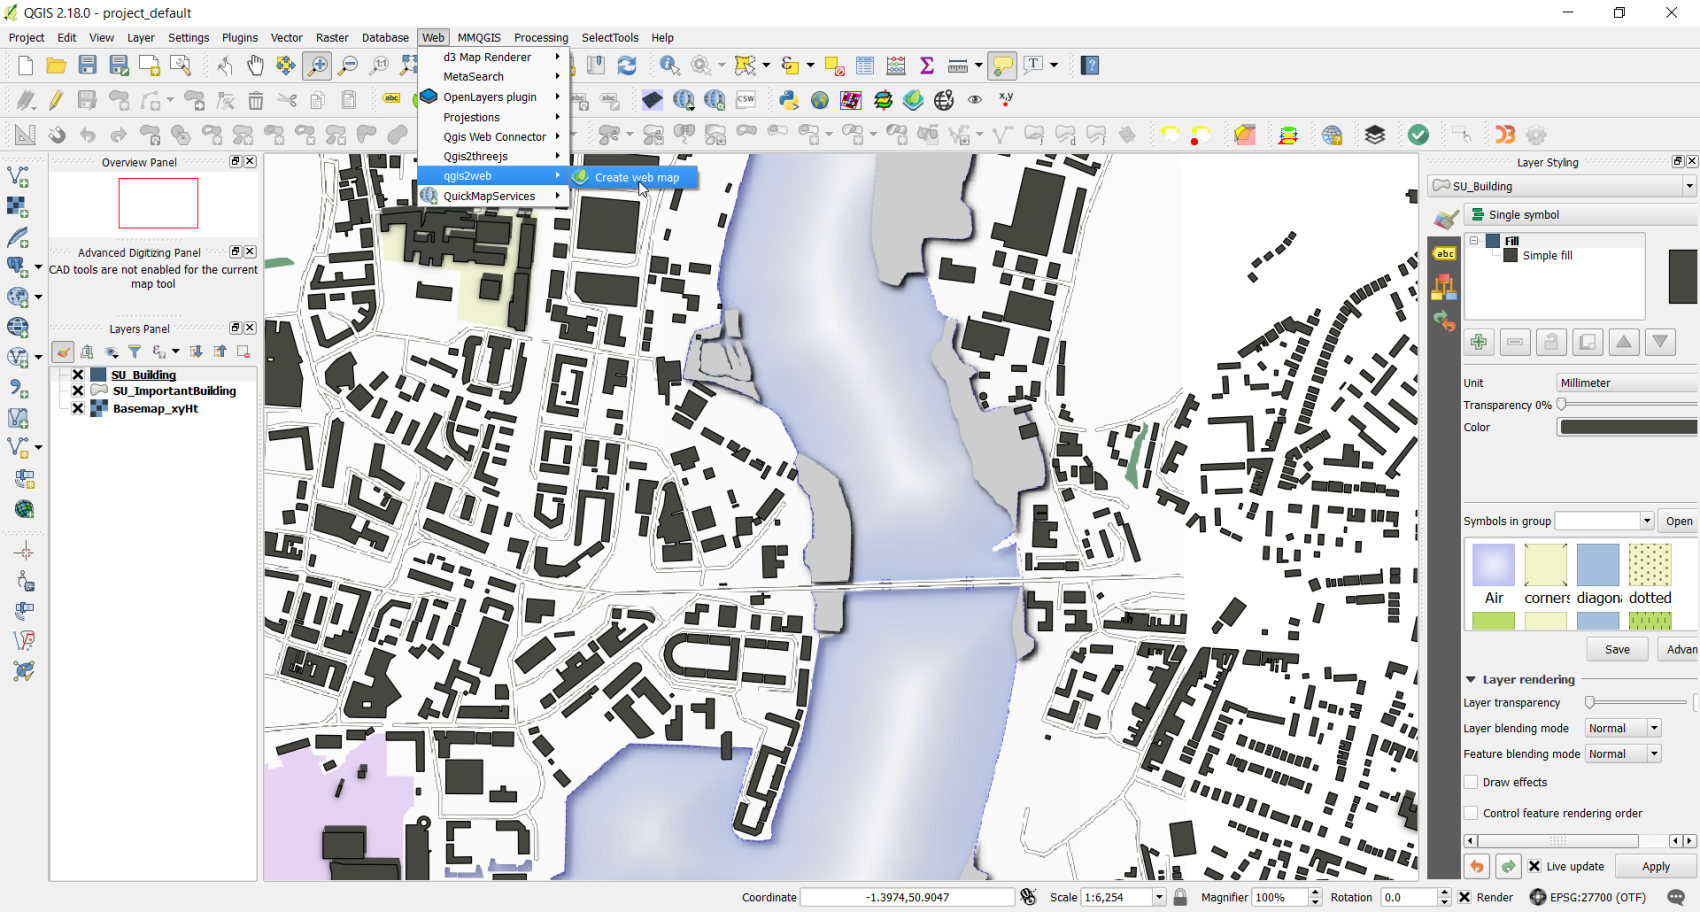
To now produce this as a web map, I simply go to the web tab and select the QGIS2WEB option (see image below).
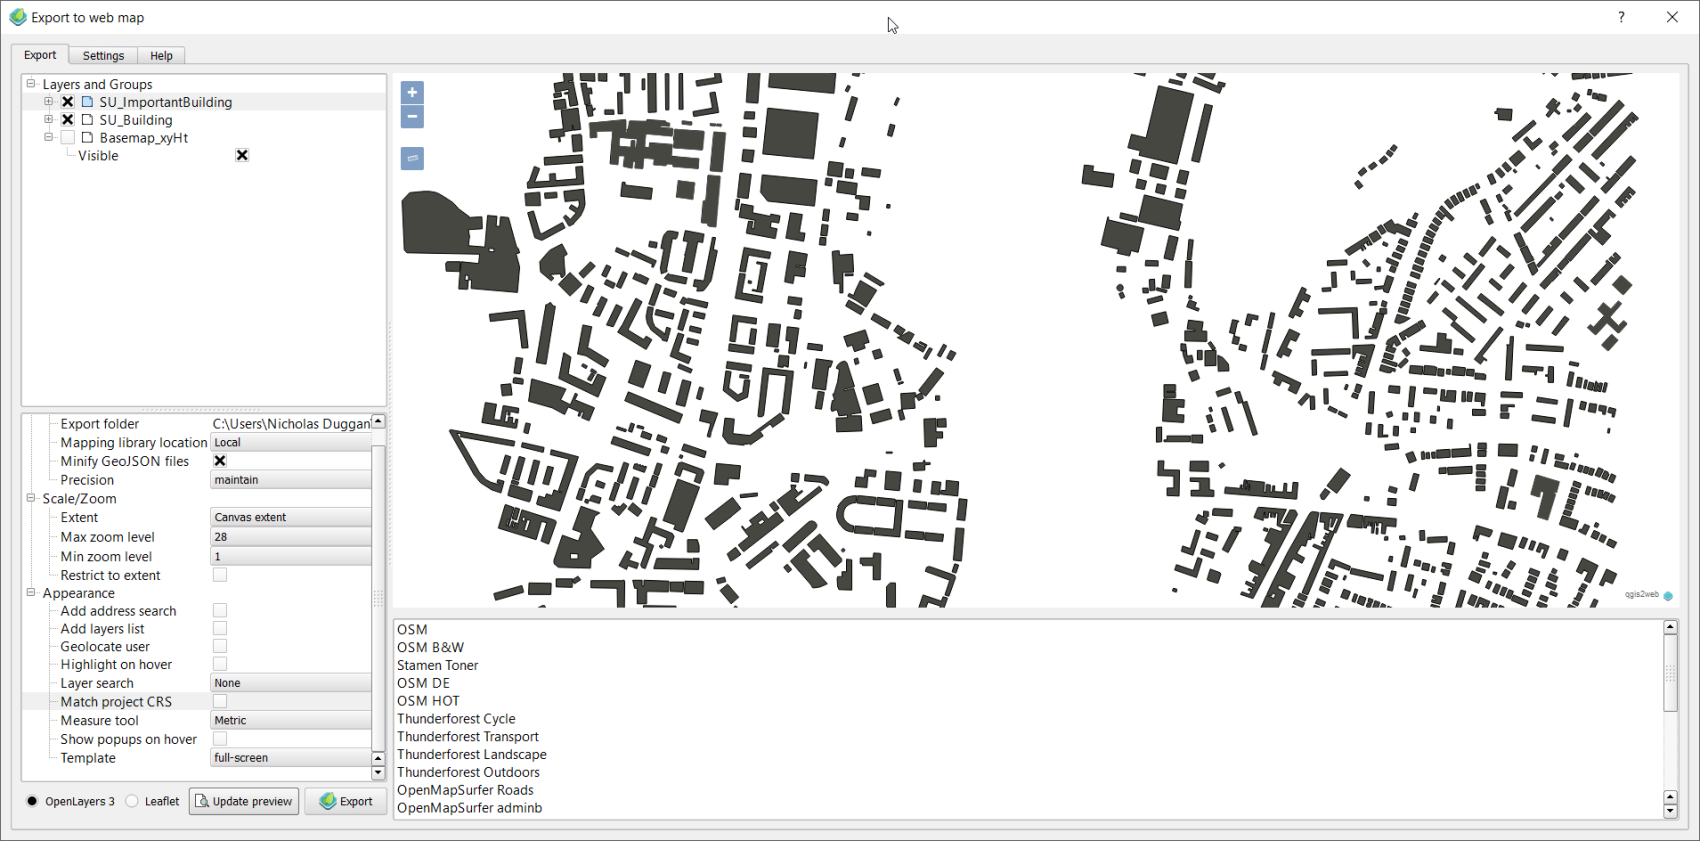
You will then see the following screen pop up;
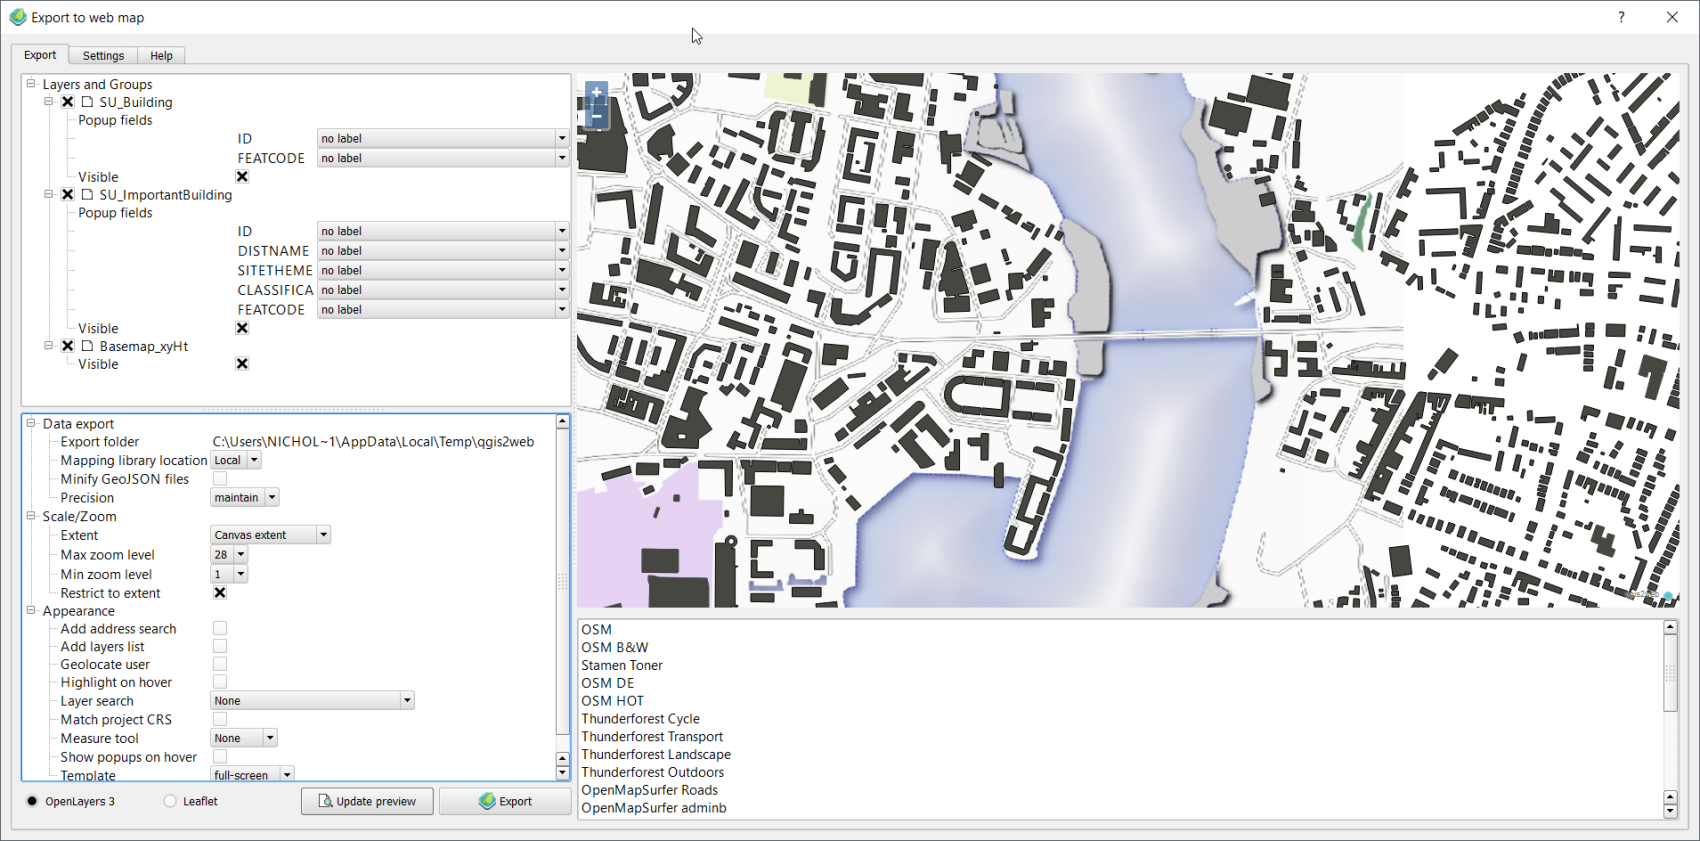
As you can see, the interface is pretty comprehensive. In the main frame, top right where you can see the map, you find that this is the “live viewer”. When you make changes and subsequently update (bottom left), you will see this reflected in this pane; it is also what you will see when you host this on the web or view through your local browser.
First thing to note is that there are two toggles in the bottom left, one that says “OpenLayers 3” and another saying “Leaflet”. These provide API options. Both are good, and you will find hardcore web mappers favour one or the other, but unless you are going to develop your map further beyond exporting it, then I wouldn’t worry too much. If you intend to develop further and add more functionality, then it may be worth looking here: Leaflet and OpenLayers3.
I am hoping, if you got this far, that we can skip over the layer visibility and label/pop-up options as they are fairly self-evident. Instead we will go straight on to the lower left pane.
I’d recommend changing the export folder; it is the only issue I have with the plugin. If you don’t allocate a sensible location, you will be forever searching. I’m not kidding. The tool will minify geojson files and allow you to reduce or maintain precision and also restrict the extent to the canvas or the the current extent.
It is what follows on the list that sets this apart from the web map self development route. You will see that there is a simple tick-list of what additional functionality you want. This alone saves you an hour of fiddling with javascript snippets!
Finally, the icing on the cake: I intend to savour this a little, so excuse me a moment. As you see in the screen below, I will remove everything except the buildings:
What we can then do, is to select any of the basemaps listed on the lower right of the screen….if you use CTRL, you can select multiples.
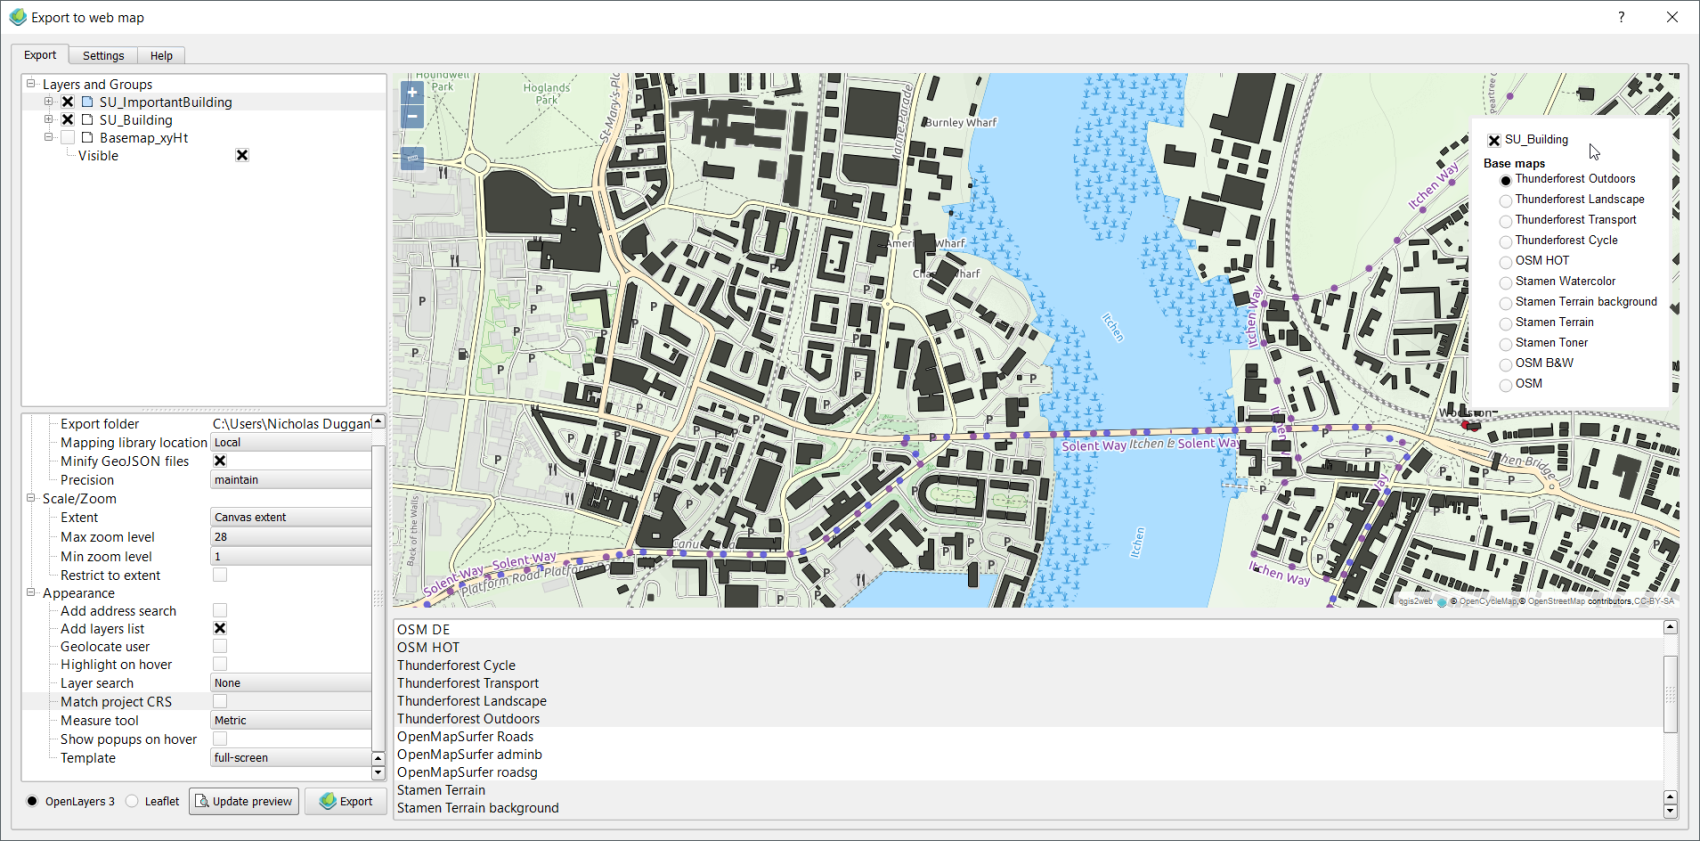
Not only do you have the option for adding all these different basemaps, but, as you can see, they are also selectable in the final web map as radio buttons (see image above).
Now if you export this (to a memorable location), all of a sudden the map pops up in front of you in your common browser! How cool is that?
You can now take those files and send them to someone (who needs PDFs?!) or post it up on your webpage by simply copy and pasting the folders into your chosen location.

Although QGIS2WEB will never compete with the likes of ArcGIS Online or Geoserver, what it does provide is an extremely quick and effective way of providing collaborative mapping that supports all manner of project-related functions. I’ve managed to use this with hyperlinks, live feeds, and height-enabled data (see the 2.5D map at the start), all to great effect. The fact that this tool also supports more complex styling and the 2.5 rendering only makes it more lovable. As a first step into web mapping, I would recommend this every day of the week.