Over the last few months I’ve just had to get my hands dirty again with Mapbox. For those who don’t know what Mapbox is, let me introduce it.
Mapbox is a platform for location-based data. It allows you to host your data with them so that you can stream it into your web maps, and it provides a Mapbox webGL so that you can host your maps using their code for free. The only cost is when you are using their hosting service; you pay a subscription that enables them to pay for their servers and their team, who create the awesomeness. They even provide tools so that you can style the data. It really is a win-win scenario.
Mapbox has been around since 2010 and has created SDKs (software development kits) (like plugins) to allow location information to be used in different ways. A great example of this is the Unity3D SDK that enables location data to be used within the Unity gaming and AR/VR environments so that we 3D guys can build augmented applications using geospatial data based on Mapbox code.
The Mapbox-based application that has consumed my time of late is just a simple web map that has a little GIS twist—clever cost-weighted analysis is built in that automates a lot of the analysis. So with this in mind, what I wanted to do was to make it look cool, add a little color, and make the cartography look fresh. And then I looked at the Mapbox GL’s styling pages and realized this wasn’t going to be a walk in the park.
My first problem was coding the styles directly into a json format so that the system could read it and create a style, so, to begin, the styles were very basic.
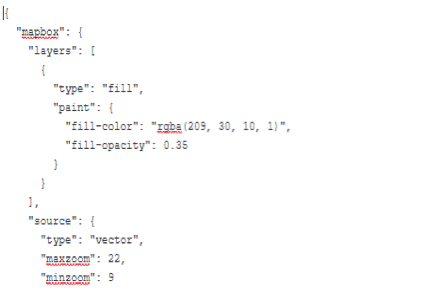
You can see that the code is very simple but can be quite intensive without a GUI, as you can’t see what the result looks like until you create the style and view the web page it is supposed to draw on. It is very hit and miss, too; one misspelling or a bracket in the wrong place causes things to crash.
Luckily Mapbox created “Mapbox studio,” a GUI interface for styling their data. First, I’ll run through how it works and then I’ll show you some of the cool styling (in my opinion) that I’ve been doing so you can achieve similar results yourself.
Getting Started with Mapbox
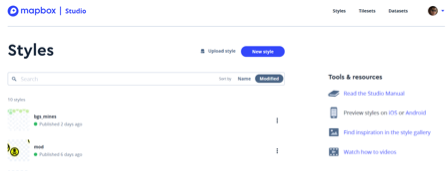
First of all, you need to create a Mapbox account. This is free, no need to sweat (yet). Once you have an account, go to the homepage and click on your avatar, top-right.

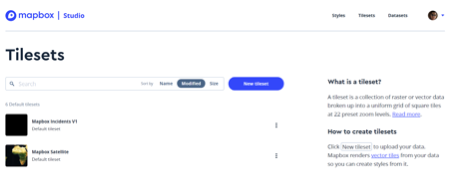
Now, you will be presented with the ‘Styles’ menu, though this isn’t what you will need; you need to start with the ‘tileset’ menu. A style is the cartography you apply to your data, or in this case your tileset. It is called a tileset as the data is broken up into squares (a little like quadtree data) so that the vector data renders faster.
These tiles of data use a format created by Mapbox called MBTile. The data formats that Mapbox prefers are Geojson, KML, CSV, MBTiles, and zipped shapefiles.
Note: You can export data directly to Mapbox Vector Tiles using the ST_AsMVT command.
So this is where we need to separate what you are using Mapbox for. If you want to host your data with Mapbox, then you will need to upload all of the data you wish to use. They will then give you a url and personal key so that you can use their map services to display your data. There may be a subscription fee dependant on your data size.
When I am interested only in styling the data, I use QGIS to extract only a representative sample (the smallest area with every subcategory of data) in Geojson and then upload this as a tileset to Mapbox.
Once you’ve uploaded your tileset, it should appear in your tileset list. It is now ready to style.
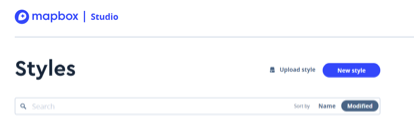
Open the styles window (under the styles text, top right) and then select the “new style” button, select the blank style option:
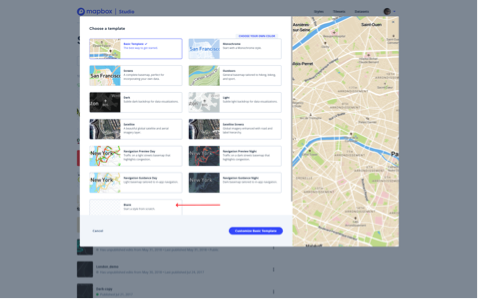
Hint: Select the “customize blank” option in the bottom right to get started.
You should then be presented with a relatively blank screen.
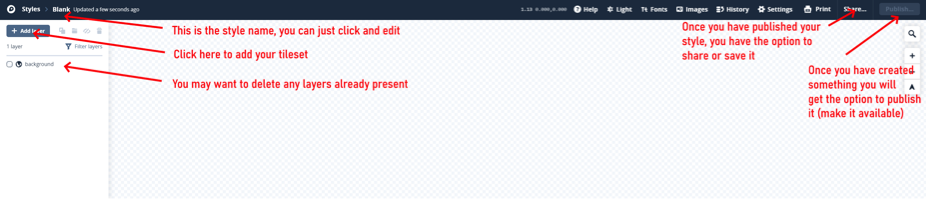
Once you have added your tileset, the interface will change and give you a few options, and this is where Mapbox differs from what you would expect (from a GIS).
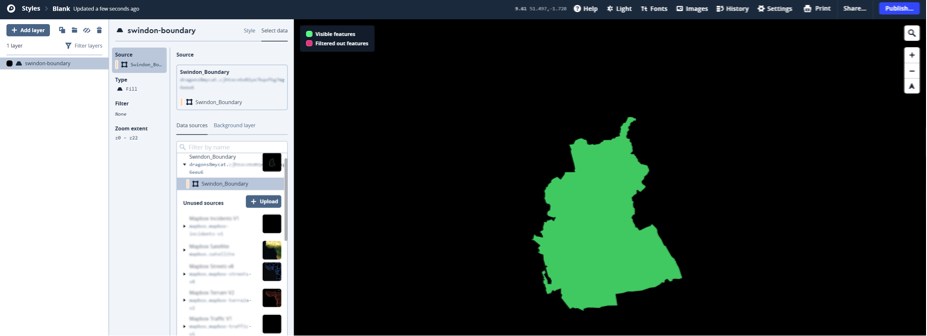
Here you can see that I have loaded the Swindon, UK boundary polygon data. Now, if you select the “type” option which is below the “source” information (highlighted above,) you will get options on how you want the data represented.
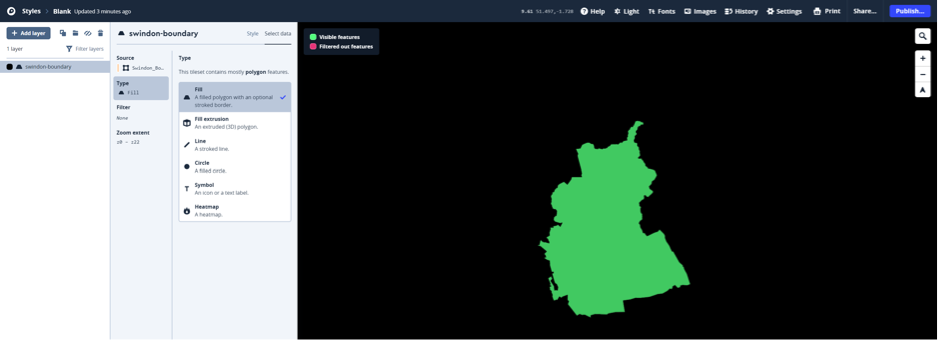
In the above image, you can see that I have options for displaying the data as lines, polygons (fill), extruded polygons (fill extrusion), points, symbol, or heatmap. Confusing, right?
To begin with, I found this very confusing, and even though I’ve been a GIS user for over a decade it wasn’t immediately obvious. Now, I zoom around, building things better than I could in a GIS. It is all about getting your head around focusing on one feature at a time and layering the information in that one feature. This is different to how you normally style things in a GIS where you add text, outline, fill style, and other information all within a single layer.
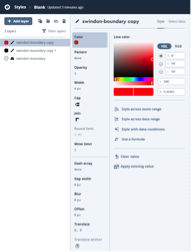
So in this (polygon) case, if I wanted to style it nicely, I would have a fill, an outline, and then maybe a shadow, so I have to add each of these layers individually like in the screenshot below.
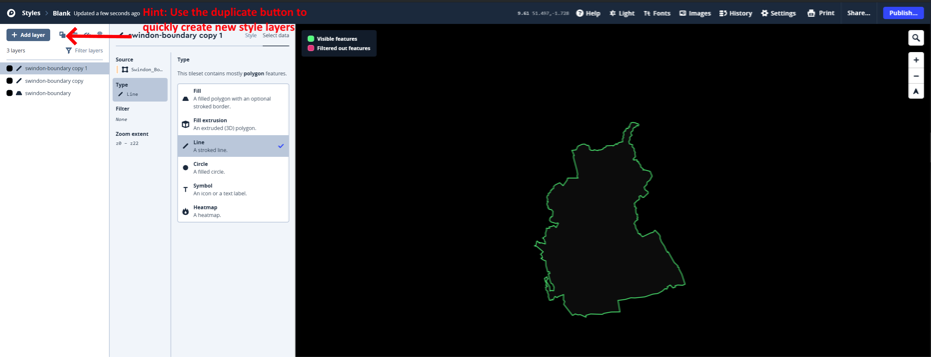
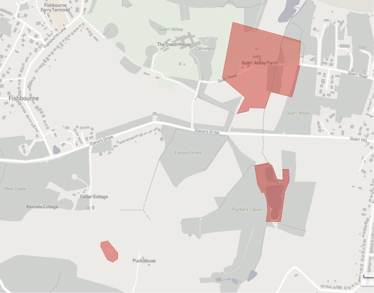
If you then click on “style” up top next to the “select data” text, you can get about styling it all up. In a few quick steps I’ll create a red boundary with an inner shadow and a light semi-transparent grey fill.
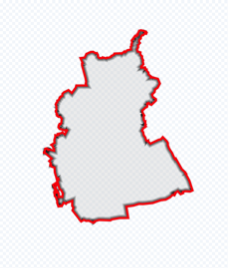
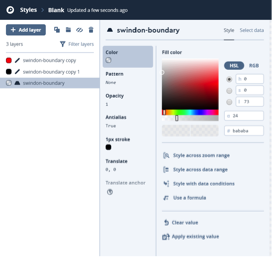
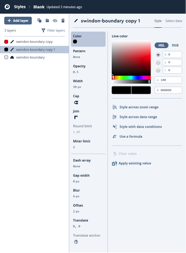
In the screenshots above you can see how I’ve carefully layered the information with the polygon fill at the bottom, then the inner shadow on the next, and the top layer is the red boundary. To achieve the inner shadow, you can see that I’ve used the offset option to slightly edge the black line inside of the red polygon and then added a blur to the line and a slight transparency to make it look more like a shadow.
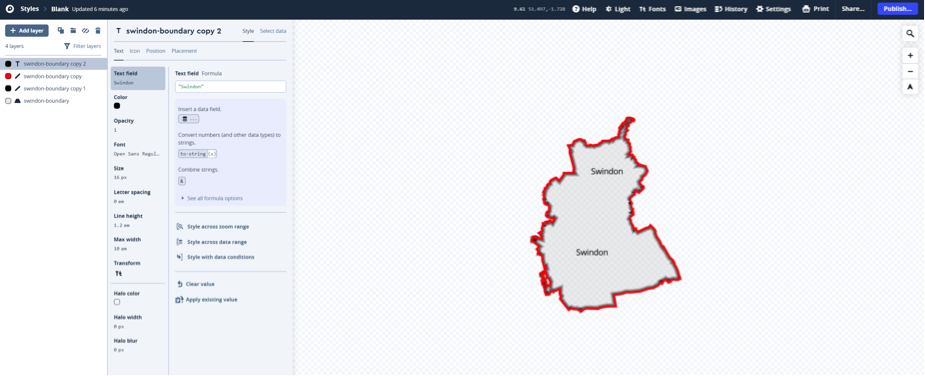
If we wanted to add the name “Swindon” to the polygon, we would do it by adding another styling layer and change it to a symbol, then use a formula of “Swindon” to then add the text to the polygon. You can use the placement options to get the text to draw where you want it.
 As you can see, the “publish” button (top right) is now available. To save your work, you can press this button and save it as is. It will be available when you log in and go to your “styles” area of Mapbox again. You can also create your own map by going to mapbox.com/maps and by simply clicking a few buttons (charges may apply but for small data it is normally free) you can create your own web map masterpiece.
With a bit of time and a little playing, it is quite easy to create lovely cartographic effects. If people want to see it, I can revisit the styling in another blog.
Using Your Style in Mapbox GL JS
What I want to discuss now is bringing that cool style into your Mapbox GL JS instance. If you hit the “share” button, you will get the option to save your style as a zip file.
Within the zip file are two files. One is a license that tells you that everything you created is your own work unless you used some of Mapboxes styles. The other file is a json file which you can open in a text editor.
How you’ve set up your Mapbox GL JS will depend on how you consume you styles, but in most of the systems I have set up or used, you can pretty much take the text from the json file and use it as your style for the data. You will only need to change any location references and data names.

Above is the style reference for the Swindon boundary I styled earlier displayed in Notepad++ (open source text editor).
Summary
Although this process is a little bit more labor-intensive: extracting data, styling it, and then adding it into the system (rather than coding without a GUI), the results are far better. Having the ability to create shadows and tweak transparencies visually creates a much more refined data, as can be seen in the Swindon boundary, something I could never achieve by code only.
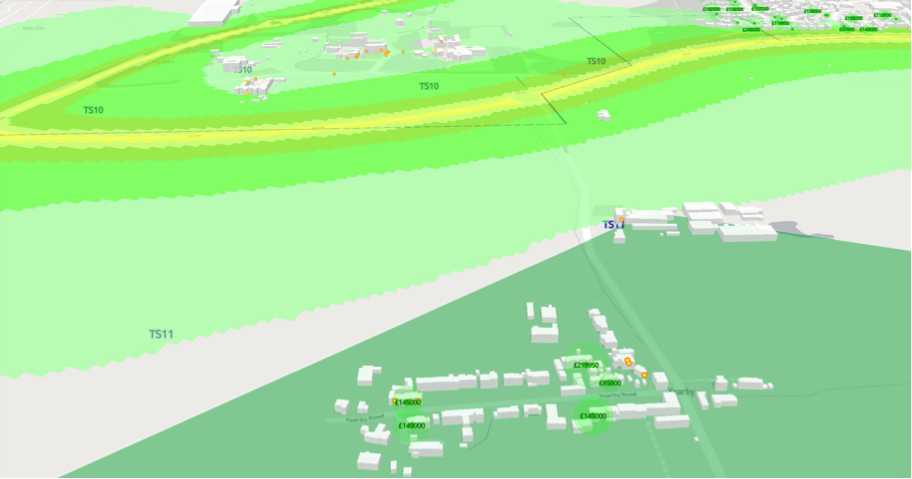
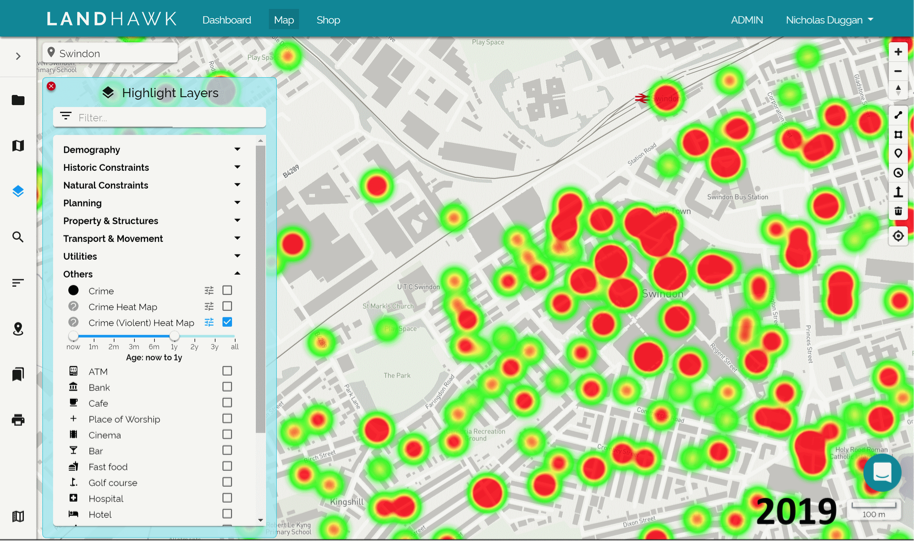
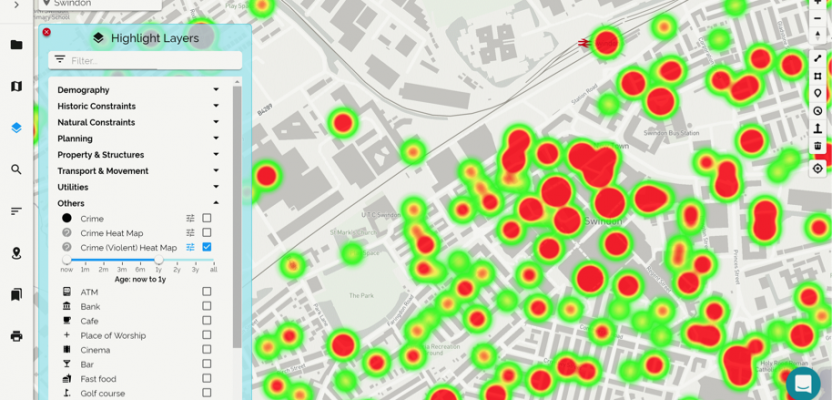
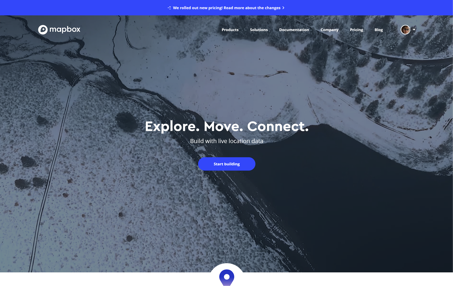
Screenshots of LandHawk.uk based on Mapbox GL JS.