A survey manager describes how monitoring improved construction processes for the replacement of an 85-year-old bridge connecting Illinois and Iowa.
The Savanna-Sabula truss bridge added to the National Register of Historic Places in 1999, carried passengers along U.S. 52 and Illinois 64 over the Mississippi River, connecting the towns of Savanna, Illinois, and Sabula, Iowa. According to the historic listing, structural work on the Iowa side began in 1931, and the bridge was opened to traffic on Dec. 2, 1932. A dedication plaque references turning citizens “dreams into a reality” by improving transportation and increasing economic opportunity between the two states.
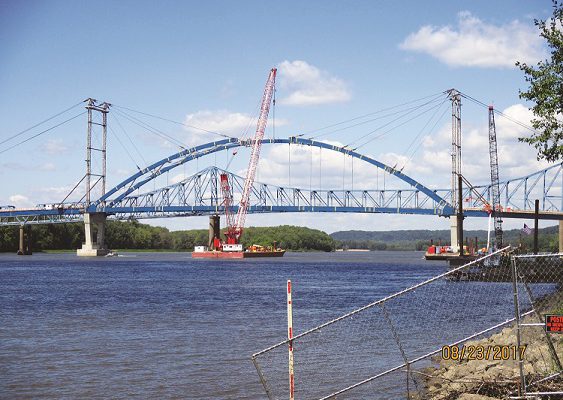
“The main section…is comprised of a series of three rigid-connected through trusses, with a 520-foot, cantilevered center span flanked on both sides by 309-foot anchor spans. All are supported by spill-through concrete piers”, the listing notes. “The bridge abuts directly into the cliffs on the east side; on the west side a simply supported, 280-foot through truss and a series of steel stringer spans form the approach.”
Fast-forward several decades to the early 2010s, when state officials determined that a replacement was needed because the bridge was “structurally deficient and functionally obsolete”, according to the Illinois Department of Transportation (IDOT) bridge rating system.
The replacement bridge project started in late 2015 and is expected to be completed by summer 2018. The new bridge is 2,500 feet long and 40 feet wide, highlighted by a 546-foot-long steel tie arch over a relocated navigation channel. The original bridge will be disassembled and removed early this year.
Most of the project was done with manual, straightforward surveying methods. Using robotic total stations, GNSS units, digital levels, and handheld collectors, my company managed the control, set-out work points, and verified construction. Fehr Graham is an engineering and environmental firm with 10 offices in Illinois, Iowa, and Wisconsin.
The process was routine until crews went to build the bridge’s tie arch during the summer of 2017. That’s when we began ongoing discussions with Kraemer North America, the general contractor, whose parent company is Obayashi Corp., one of the world’s leading construction contractors.
One of Obayashi’s well-known projects is the Mike O’Callaghan-Pat Tillman Memorial Bridge that crosses the Colorado River, on the downstream side of the Hoover Dam. Obayashi had used a Leica GeoMoS monitoring system to help build that arch bridge—starting this practice of using monitoring software and systems to determine arch layout during construction—and wanted to use the process again for the Savanna-Sabula bridge.
Obayashi’s Yuhei Tatatoku was the point person, running what Kraemer called the “Arch Erection Geometry Plan.” Leica’s GeoMoS software—usually reserved for monitoring structures or land masses such as hillsides, excavation walls, and tunnels that you don’t want to move—was used during erection of the tie arch pieces and verification of the bridge’s final loaded location.
Challenges
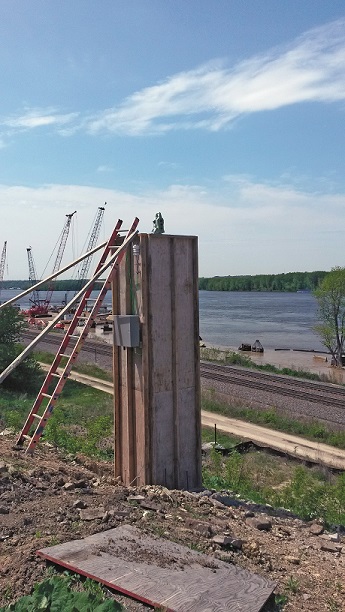
A robotic total station site was placed on top of a concrete pedestal with a weather station and electrical enclosure around a Sensemetric thread.
IDOT was the project owner. Like most IDOT projects we have worked on over the years, the control was in a State Plane Grid Coordinate System and the construction plans were based on a project alignment—in this case, U.S. 52 traveling west over the Mississippi River to Iowa and Illinois 84 heading north to Hanover, Illinois.
This created a challenge with the Leica GeoMoS software basing its measurements on a coordinate system (northing and easting) and the Arch Geometry Control Plan, which was based on the U.S. 52 alignment (Station and Offset).
Tatatoku was concerned with doing multiple calculations during crane lifts to verify that pieces were in the right locations. This began the process to find a solution that would automatically convert between the two and that could be done by handheld collectors using GeoMoS.
Another challenge was that the U.S. Coast Guard wanted the navigational channel moved 150 feet west to accommodate barges turning north at the river’s bend, and IDOT had to meet the requirements of the U.S. Army Corps of Engineers.
Arch pieces were built on land, then deconstructed and transported by a barge, where a crane was used to install the arch pieces. Kraemer wanted an automatic surveying system that would measure the work points of the arch erection geometry plan on an hourly basis—24 hours a day, seven days a week—with the ability of continuous measurements while crane lifts were going on during piece erection. The data needed to be instant, in an easily readable format, without multiple calculations to verify work point locations, and accessible by all parties involved.
Royce Monk of the Fehr Graham’s Rochelle, Illinois, office was tasked with leading the onsite operation, with direction from me as survey manager.
Early on, Fehr Graham realized data collection was going to be a significant capital outlay, purchased outright for a potential three-month window. As a result, Leica connected Fehr Graham with California-based Sensemetrics Inc., that provides solutions for management of distributed sensor networks, to assist with the data.
The project continued with the use of two Leica Geosystems 1-second heavy-duty automated motorized total stations (once the arch was up, you can’t see through it to measure the other side), two Sensemetrics thread network devices (one being cellular connected), a weather station for temperature and pressure measurements, and three months’ usage of the GeoMoS software, along with server hosting and cloud data service. This allowed the project team to manipulate and view measurements from anywhere with internet access and the ability to lease the equipment on a month-to-month basis.
Using the Monitoring System
The Sensemetrics threads created a plug-and-play experience by connecting all the hardware and software parts of GeoMoS. The cloud data service made it simple to control the data and push out readable spreadsheets for Kraemer.
Monk worked with Kraemer on building the two pedestals needed to hold the robotic total stations on the south and north sides of the bridge (Illinois side of the river). Each one had three permanent points, or prisms, that were measured once per hour, 24 hours a day, seven days a week to verify no movement or shifting.
Limited space was another challenge with this project. The Iowa side had the most room to place the pedestals, but the arch side of the bridge was closer to Illinois. The river, railroad tracks, and road pavement were placed on the Illinois side.
Earlier discussions set the robotic total stations on a new 2,500-foot retaining wall on the Illinois side, but that was outside the maximum distance to use the auto-target recognition feature on the total stations. By placing the pedestals across from the Illinois side abutment, the farthest prism distance was cut down to less than 1,100 feet.
In April 2017, the control network was set, measured, and verified. The initial measurements were completed with two sets of static GNSS observations tied to the original project baseline. The positions were refined and verified with daily use of the 1-second total station.
In May, Bryan Blott with Sensemetrics helped with the initial hardware and software setup. The GeoMoS system was programmed with the state plane coordinates, and we were able to start measuring and transmitting the data.
How It Worked
The default mode for the GeoMoS system was to measure, at the top of the hour, temperature, pressure, angle orientation, three location checks, and the work prisms that were located on the arch structure. When erection crane lifts were taking place, the system was switched to run continuously on the work prisms, while conducting quality checks once an hour.
Initially, the prisms were to be bolted to the arch pieces. However, after further discussions with IDOT, we decided to use SECO’s Walleye prism system along with a flat magnet that had a 5/8-by-11-inch stud. This allowed the 50 or so prisms to be moved around and not compromise the weather-resistant coating on the arch pieces.
Kraemer also used adhesive sign vinyl circles the size of the magnets to mark prism locations, so if one was bumped or moved it could be placed back into its position. As cable stay towers and arch pieces were added, more prisms were incorporated to monitor construction and added into the GeoMoS system to be measured and reported.
The Sensemetrics threads served as an internet appliance that connected the robotic total stations to each other and then to the web-based GeoMoS server and the cloud data service. The service allowed Fehr Graham to control the data, ensuring we could create administrator-type data streams while permitting Tatatoku and others on the arch erection team to copy, arrange, and manipulate the real-time data coming from the GeoMoS system from anywhere.
The arch erection geometry control plan had station and offset values calculated for the major connections of the tie archway and at different loading of the structure. The system was to be used to measure and communicate differences between calculated and as-constructed positions. The system was originally programmed with all 44 arch and six cable tower prism locations to be measured once per hour through the entire series, transmitting data for only the prisms on the structures as the archway was built.
During the first crane lifts and part connections, more positional information was needed while parts were going up and to see station and offset data instead of state lane coordinates. As a result, Fehr Graham changed its mode to have the system measure only to prisms that were already on the structure, along with ones on the new pieces being placed in a continuous mode. During times when there was no construction on the archway, the system was set back to once per hour for the prisms located on the arch.
Because the system was cloud-based, Fehr Graham could turn on and off the continuous measurement mode anytime, anywhere. There were times when one team member would turn the system on at 6 a.m. before leaving the house for the office, and Monk would turn it off at 9 p.m. when the ironworkers were done connecting the arch pieces for the day.
Kraemer also added and moved prisms along the temporary cable towers to ensure they remained straight and plumb while holding up the arch pieces.
Better Setup
Once the threads were mounted onsite, wired to the total stations, and turned on, it was only a matter of logging onto the data app, typing in the thread number, and selecting

Royce Monk of Fehr Graham places a Leica Geosystems robotic total station on top of a concrete pedestal.
what type of sensor was being used and from which web address the GeoMoS software could be found.
The app showed all the measured data from the sensors and allowed for customized delivery of the data with a georeferenced photo (such as Google Earth), a JPEG image of a plan sheet on detail, and line graph output or tabular data (Kraemer wanted to see tabular data based on the prism IDs). The app also allowed the main user to control what data other users could use and see.
Early on, Kraemer experienced issues with the coordinate data format showing only northing, easting, and elevation values because the project plans were all based on station and offset. Fehr Graham hoped this could be addressed by setting up a project baseline and having the system measure to it and report the differences, just like handheld collector software does with normal surveying equipment.
However, this was not the case. According to Leica, at the time there was no programming that could do any kind of baseline measuring. It was strictly coordinate values for position measurements.
This meant Fehr Graham had to convert the stationing and offsets to coordinates, and then Kraemer had to convert the coordinates to station and offsets – a tedious and time-consuming process. The challenge was to find a way to provide the data in real-time without having to use any conversion equations.
Because the system was only going to output coordinates, a project coordinate system, based on the station and offsets in the plans, needed to be determined. With the U.S. 52 alignment through the arch segment being a straight line, the control network and total station pedestal locations were recalculated.
As a result, the GeoMoS system was reprogrammed to these coordinate values, and, in turn, had to relearn and measure data through the weekend before the next lift and piece connection. I had the idea to type in the stationing values for the easting and the inverse of the offset values for the northing coordinate. If the calculated U.S. 52 alignment offset was a +27.35, we typed in -27.35 for the value.
This allowed the system to continue to measure in a coordinate system and gave Kraemer something easy to recognize as a station and offset without any additional conversion time. When the system reported an easting value of 15000.21 and a northing value of -27.58 on a prism, this meant the prism was at Station 150+00.21 and 27.58 feet right of the alignment.
Project Successes
Our overarching (pun intended) goal was to get the GeoMoS system up and running and to simplify the data output Kraemer used to make decisions on placing and tweaking the tie arch pieces. Using this setup, the system monitored the arch once per hour every day to check movement.
With non-automated monitoring, a person would need to survey once per hour, every day, all day and all night. When Kraemer wanted continuous measurements, a surveyor couldn’t push the collector buttons fast enough to get the robotic total station to measure faces and distances in the time the GeoMoS system could run through the prism list, let alone talk to people on a radio to direct them on how to move a piece into place.
Incorporating the GeoMoS and Sensemetrics technologies allowed for several big takeaways: keeping construction costs down, making the best use of staff time, and executing the most precise job possible.
The successful collaboration was highlighted by Randy Blakehorn, secretary of transportation for IDOT, and Mark Lowe, director of the Iowa Department of Transportation, during a ribbon-cutting ceremony on the bridge before it opened to traffic. Residents celebrated the past and the present in October with Bridge Fest and the Last Ride, with classic cars passing over the old bridge one last time.