I recently attended a pre-bid conference where the customer was interested in small unmanned aircraft system (sUAS) imagery over a large enough area that mosaicking of the images was desired.
What I thought would be a fairly straightforward conference turned into a knot of questions and exasperation. “How can we do this without ground control?” and “What are the accuracy requirements?” were two of the many questions asked.
Essentially, the customer and providers had difficulty agreeing upon a standard for the resulting product. What the customer wanted was a better picture – a picture with higher spatial resolution, when they needed it, with a choice of spectral bands. The assembled crowd from the surveying community attempted to translate the customer’s needs into survey terms to no avail. The bid was canceled a few days later.
After the pre-bid conference, my colleague Rudy Stricklan and I attempted to understand the chasm between the customer and prospective providers. We concluded that the customer wanted a better picture in terms of remote-sensing resolutions, whereas the providers were thinking along the lines of surveying accuracy and precision. And while there are well-defined standards for surveying accuracy and precision, we were unable to find standards for what the American Society for Photogrammetry and Remote Sensing (ASPRS) calls “for visualization and less accurate work.”
What we propose are seven standards for sUAS “better pictures.” If followed, these standards – involving the use of checklists, software best practices, spatial resolution, spectral resolution, radiometric resolution, radiometric corrections, and georeferencing—should provide the customers with a repeatable, consistent product that meets their needs for a visualization.
Properly applied and followed, they will give the customer confidence that the image provided can be used as the basis for analysis and study.
We feel that these standards can be achieved by mapping professionals of various stripes and not just by surveyors. However, we also recognize that surveyors are important in the planning of any sUAS mapping project, especially if there is an anticipated future requirement for some degree of absolute spatial accuracy.
Our proposed set of standards rests on the consistency and repeatability of sUAS flights and the ability to generate the same, or nearly the same, remote-sensing resolutions (spatial, radiometric, and spectral) between sUAS flights regardless of provider.
1) Checklists
Checklists covering procedures involved with the flight of an sUAS are already part of sUAS manufacturer and FAA requirements. We recommend adding checklists covering compliance with local and state laws as well as weather and lighting conditions at the time of the sUAS flights.
Metadata should describe how the aerial images were obtained, conditions on the ground and in the air during image capture, what types of images were produced, and, if necessary, what procedures were used to process images into an orthomosaic, and, if needed, the procedures used to create a reflectance value orthomosaic.
Also important are records of analytic procedures performed, such as indexing (normalized difference vegetation index [NDVI] is a well-known example).
Lighting is another important consideration. ASPRS recommends that aerial imagery be obtained with the sun as high as possible, avoiding capturing aerial imagery with the sun less than 30 degrees above the horizon. Sky and cloud conditions should also be recorded as part of the metadata.
2) Spatial Resolution
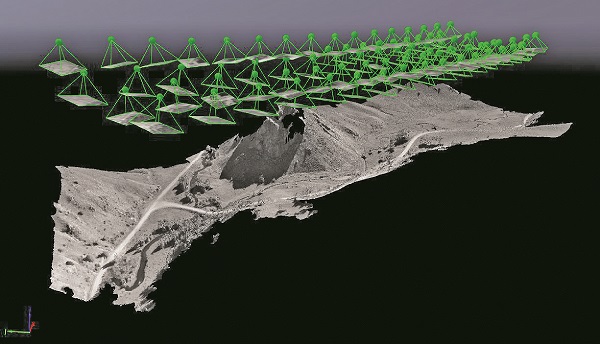
Figure 1: This 3D model was created by SfM software, with no geospatial information provided. The relative positioning of the images (green dots and tetrahedrons) were derived by the SfM software.
Spatial resolution, or ground sampling distance (GSD), for sUAS flown under US laws (less than 400 feet altitude) tends to be around 5 or 6 centimeters. You can achieve a specific GSD by adjusting the flying altitude or using different sensors. In complex terrain, the resulting GSD may differ from the planned GSD due to changes in flying altitude.
ASPRS specifies that the “GSD as acquired by the sensor (as computed at mean average terrain) should not be more than 95% of the final orthoimage pixel size”.
The planned GSD should be reported along with the resulting pixel size in the resultant orthomosaic. Where the difference between the planned GSD and the resulting orthomosaic pixel size is greater than 5%, an explanation should be given.
3) Spectral Resolution
Spectral resolution refers to the sensor’s ability to distinguish between wavelength intervals and is an important element in satisfying customer demand. Providing the frequency range of the sensor is an essential element of repeatability and consistency. Where possible, a graph of the frequency response of the sensors used should be provided.
4) Radiometric Resolution
Radiometric resolution is the ability of the sensor to distinguish levels of brightness. This resolution is described in terms of bits. A 4-bit sensor will have 24 (16) levels of brightness per band. An 8-bit sensor, the common resolution for most sUAS sensors, will have 28 (256) levels of brightness per band. Radiometric resolution should be reported for each spectral band used in the imagery.
5) Software Best Practices
Imagery from an sUAS typically includes metadata containing the GNSS and IMS orientation. These images are processed by software using a photogrammetric technique
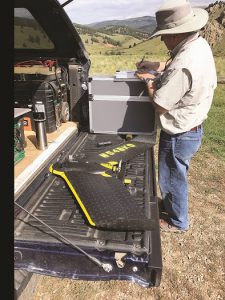
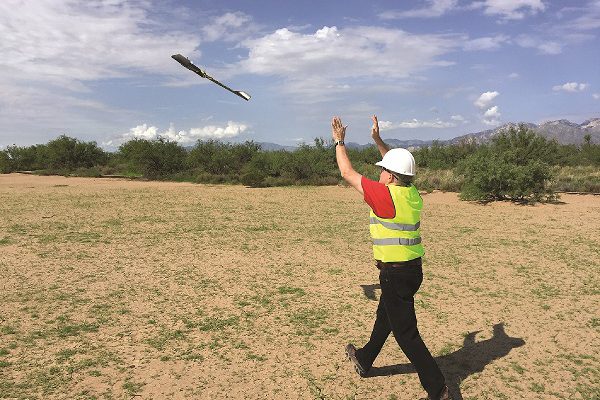
The author completes a pre-flight checklist in the Rocky Mountains of New Mexico. Credit: Larry Holcomb.
called structure from motion (SfM). SfM software establishes relative positions and orientation of each image by applying adjustments created from common points across several images.
The SfM software derives a surface model on which the orthomosaic is based. On its own, because this orthomosaic is typically based on non-survey-quality global navigation satellite system (GNSS) and inertial motion sensor (IMS), it is of low absolute accuracy and should not be considered a surveyed product. However, such an orthomosaic has extremely high – around 4 centimeters – spatial resolution (GSD) and is superb for visualization purposes.
Even without metadata describing each image’s position and orientation, SfM software is quite able to produce a surface model and orthomosaic, albeit in pixel units that are not real-world georeferenced. Figure 1 shows an image of a 3D model constructed from such images.
Since SfM processing encompasses a complex photogrammetric process, the operator should be completely familiar with requirements for the quality of the input images, sidelap and endlap, and any other input demanded by the SfM software. For example, SfM algorithms require a very high overlap, around 70% along the flight line (endlap) as well as laterally (sidelap).
Indeed, producing imagery with an sUAS relies heavily on the use of professional, and sometimes complex, software. As such the service provider must understand and follow the software instructions and recommended workflows.
Also, creation of flight lines, imagery, and resulting orthomosaics will be based on instructions and best practice workflows from the various software suites. Any deviations should be included in metadata and explained fully to the customer.
Following these five standards should produce an orthomosaic that has a reasonable degree of consistency and repeatability and will probably meet or exceed your customers’ expectations. These images lend themselves to remote sensing techniques and can be interpreted by tone, texture, shadow, pattern, association, shape, size, and site, which are susceptible to analysis, enumeration, and delineation. On the other hand, if there is a need for vegetation or other analysis, more processing is required.
6) Radiometric Corrections
The values expressed for each pixel in an sUAS/SfM software image represent brightness. These brightness values normally range from 0 for dark to 255 for bright. However, reflectance values are needed for properly analyzing vegetation through the use of indexing, such as NDVI or Green Leaf Index (GLI) (Figure 2).
We recommend following the software manufacturer’s procedures when converting brightness values to reflectance values. Whichever software is employed, corrections generally make use of procedures and tools to determine the effect of real-world lighting conditions.
Should there be a need for indexing, acquisition and handling of imagery should include some repeatable radiometric calibration of the images’ brightness values into reflectance values. A careful accounting of these procedures should be available.
7) Georeferencing
Georeferencing is the process by which one image is aligned with another image or with the coordinates of features on the ground. If any georeferencing is done, detailed descriptions of the techniques used, of any well-defined points used, and of any residuals from the georeferencing process should be included. Note that, should the need arise for some degree of absolute spatial accuracy, the orthomosaics created following these procedures can be corrected by surveying visible photo ID points—clearly identifiable point features used as ground control points (GCPs) that are assigned a coordinate value, then reprocessing the project with those coordinates included. Doing this should create ground surface-corrected orthomosaic and a digital surface model with an absolute spatial accuracy that can be evaluated using any of the current accuracy standards.
We hope that the use of these standards will provide customers a starting point for demanding sUAS imagery that is consistent and repeatable. We also hope that these standards can be a guide to frame questions and answers in a way that will satisfy the customers; needs without overselling or underselling capabilities.
References
Abdullah, Qassim, David Maune, Doug Smith, David C. Smith, and Hans Heidemann. “ASPRS Positional Accuracy Standards for Digital Geospatial Data.” Photogrammetric Engineering & Remote Sensing 81, no. 3 (March 2015): A1–26.
“Albedo, n. : Oxford English Dictionary.” Accessed March 2, 2011. http://www.oed.com.prox.miracosta.edu/view/Entry/164970?rskey=TTRc7m&result=1&isAdvanced=false#.
Campbell, James B., and Randolph H. Wynne. Introduction to Remote Sensing. 5th ed. New York: Guilford Press, 2011.
Fonstad, Mark A., James T. Dietrich, Brittany C. Courville, Jennifer I. Jensen, and Patrice E. Carbonneau. “Topographic Structure from Motion: A New Development in Photgrammetric Measurement.” Earth Surface Processes and Landforms 38 (January 2013): 421–30.
Maxwell, Aaron E., Timothy A. Warner, Brian C. Vanderbilt, and Christopher A. Ramezan. “Land Cover Classification and Feature Extraction from National Agriculture Imagery Program (NAIP) Orthoimagery: A Review.” Photogrammetric Engineering & Remote Sensing 83, no. 11 (November 2017): 737–47.
McGlone, J. Chris, George Y. G. Lee, and American Society for Photogrammetry and Remote Sensing, eds. Manual of Photogrammetry. 6th ed. Bethesda, MD: ASPRS, American Soc. for Photogrammetry and Remote Sensing, 2013.
Pix4d. “Camera Requirements for Precision Agriculture.” January 11, 2017. https://support.pix4d.com/hc/en-us/articles/204894705-Camera-Requirements-For-Precision-Agriculture#gsc.tab=0.
US Department of Transportation Federal Aviation Administration. FAA Advisory Circular 107-2. Washington, DC: Quiet Creek Corporation, 2016.
Whitehead, Ken, and Chris H. Hugenholtz. “Applying ASPRS Accuracy Standards to Surveys from Small Unmanned Aircraft Systems (UAS).” Photogrammetric Engineering & Remote Sensing 81, no. 10 (October 2015): 787–93.