I was first immersed in ground penetrating radar (GPR) as a PhD student at Lulea University in northern Sweden in the mid-1990s, and I immediately fell in love with the technology. I love the ability it gives me to see hidden things so quickly and elegantly.
I also love the notion that the equipment is capturing reflected electromagnetic waves that are traveling approximately 300 million feet per second (about one-third the speed of light) through the soils below me. How is it even possible that we can capture so much information from a wave that is travelling so incredibly fast?
You don’t have to be a geophysicist to see that’s pretty cool.
In the last 40 years or so since the first commercial systems became available, GPR has been one of the most commonly used geophysical instruments for investigating the shallow subsurface. The reasons for this include the ease of deployment, relative low cost, and versatility.
The radar energy is reflected back to the surface where changes in dielectric permittivity occur. This enables GPR to detect both non-metallic and metallic objects. High-frequency antennas have higher resolution data but cannot see very deep, while lower frequency antennas have lower resolution but see deeper.
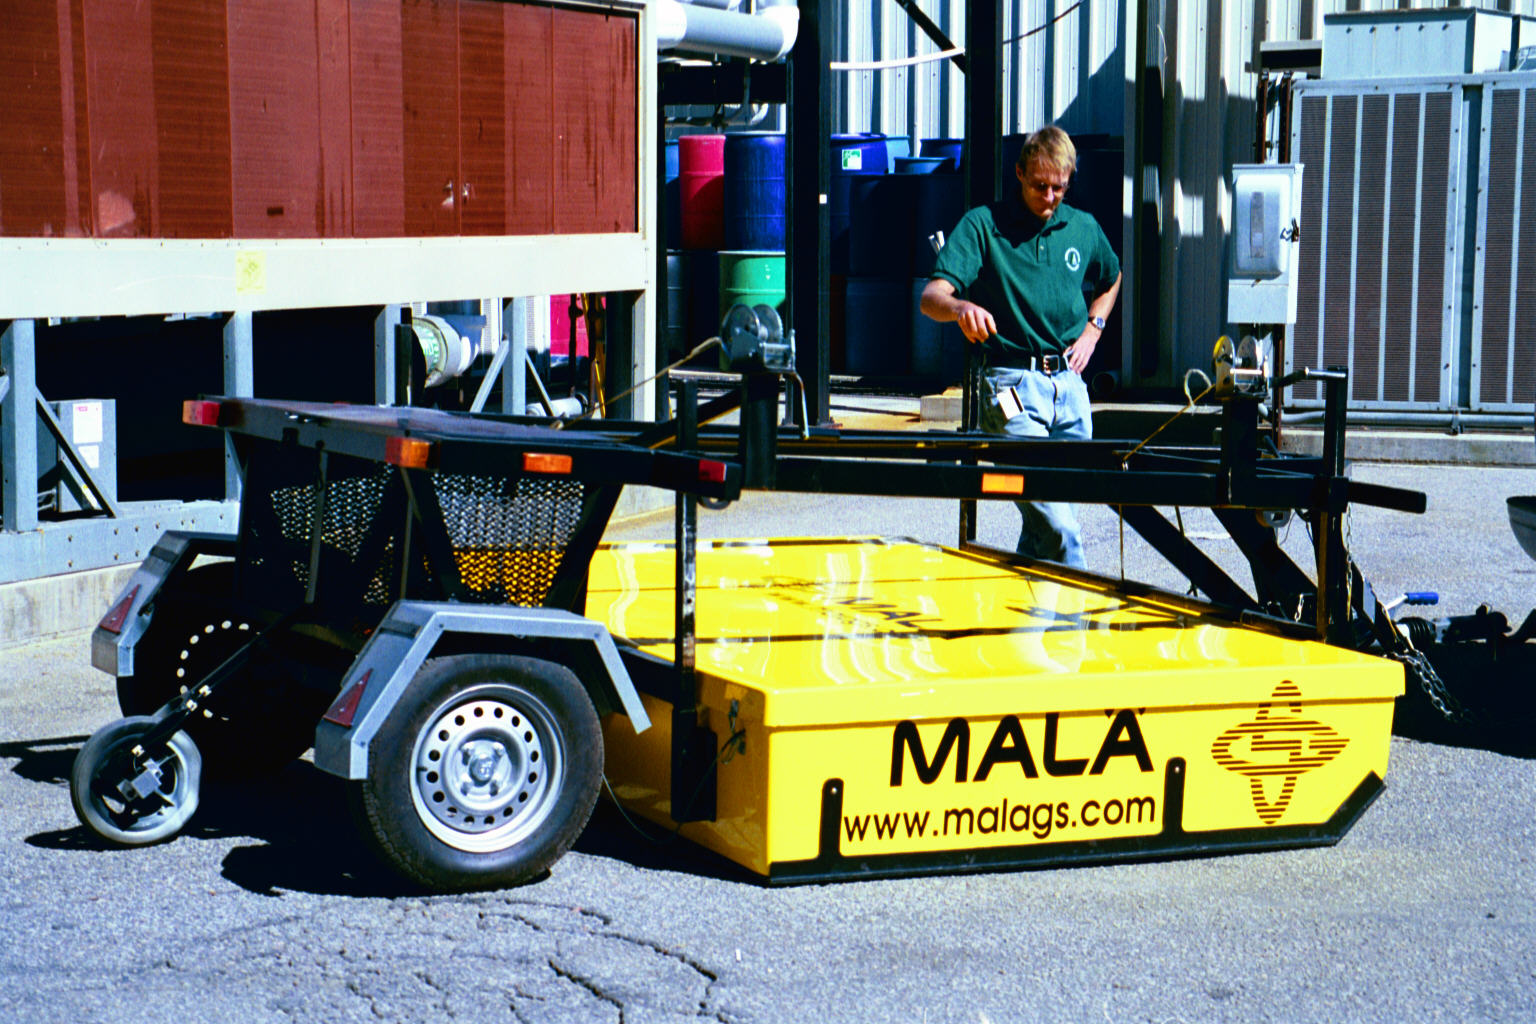
The author and the CART system in 2002, the first commercially available 3D GPR array system in the world.
Applications for GPR range from mapping concrete reinforcement and pavement thickness (high-frequency antennas), to detecting buried utilities, drums, underground storage tanks, burials and archeological artifacts (mid-range frequency antennas), to identifying bedrock, sinkholes, faults, lake and river bottoms, glaciers, and other geological features (low-frequency antennas).
The output from the instrument is a two-dimensional cross-section of radar reflections with two-way travel time on the “depth” axis. The two-way travel time is then converted to true depth by measuring or assuming the GPR velocity.
The main limitation with GPR is that the performance varies significantly depending on conditions. GPR waves can travel much further through electrically resistive media than through electrically conductive media such as bentonitic clays. I have used GPR on sites with sandy soils where data is visible more than 100 feet into the ground, and I have been on clay sites where the depth of GPR signal penetration is less than two feet.
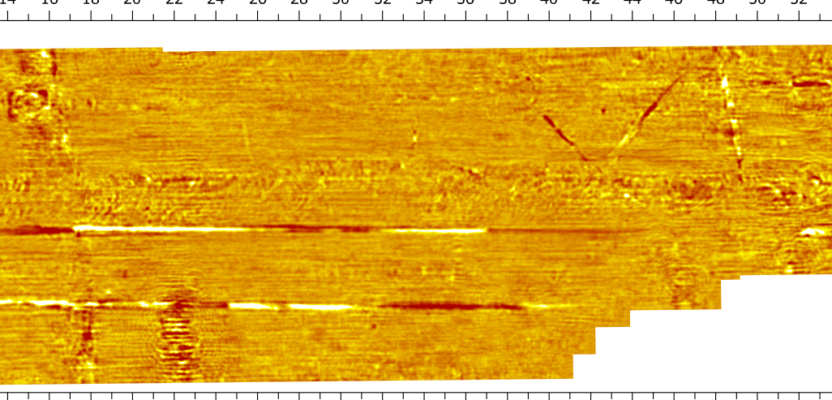
If GPR profiles are spaced close to each other, the data can be resampled into time slices. Time slices are horizontal data slices showing amplitude variations at a certain two-way travel time (or depth).
This way of collecting and analyzing GPR data became popular and feasible in the early 1990s with the advent of digital GPR systems and commercial software. By using advanced processing algorithms, the GPR time slice images can be rectified so they show almost life-like images of the subsurface.
Scrolling through processed GPR time slices is similar to scrolling through a set of CAT Scan or MRI images. Much like the medical professional looking at advanced imaging data, the GPR data processor will often detect many additional features in the horizontal data slices not found while analyzing vertical profile data.
Due to the time intensive process of collecting this closely spaced data set, GPR professionals with conventional single-channel systems primarily use time slice data gathering and analysis on smaller site. For larger sites GPR array systems are the way to go.
With GPR array systems, multiple (typically 20 or more) channels of GPR data are collected simultaneously. The system is synchronized so only one transmitter fires at a time; however, the signal is received by multiple receivers.
This allows for very tight spacing between profiles, which results in very high-resolution images. By staggering the transmitters and receivers like bricks in a wall, the system is able to detect utilities in-line with the direction of travel, as well as those crossing the direction of travel. Due to the width and size of the arrays, the primary mode of operation is to tow the system behind a vehicle.
Therefore, the array systems are suited for larger, and reasonably open sites. There are narrower hand-pushed GPR array systems available as well with fewer channels (typically around 10), which are easier to maneuver and perfect for sites with limited or no vehicle access.
I was introduced to 3D GPR array systems in 1999 when employed by MALA GeoScience. The system was coined Computer Assisted Radar Tomography (CART), and was developed by a venture between MALA GeoScience (hardware) and Witten Technologies (software).
As I moved over to GEL Solutions in 2002, I introduced CART technology to GEL where the system was adopted (Image 1). The CART development team believed that it would replace standard GPR systems for many applications and would increase the usefulness of GPR data tremendously.
The team envisioned that hundreds of units would soon be scanning streets around the world and be sold to a variety of clients for a variety of applications. Although those expectations never came to fruition, GEL and a few other companies in the United States successfully integrated CART into their service lines.
We quickly realized that being a GPR-based technology, CART shared the same limitations as GPR, and performance varied significantly between different sites. The primary application for us was utility mapping, but we realized that it should not be a stand-alone solution since it almost never identified all detectable utilities, and could often not be used to determine size, material, content, condition, system type, and other pertinent information for the utility.
Although the CART was far superior to single channel GPR and produced subsurface images at an unparalleled resolution level compared with other geophysical methods, broad market acceptance faced many barriers, including cost, low data collection speed, the level of expertise needed for data acquisition, limited signal penetration depth at locations with soils not conducive for GPR, and complex data processing and analysis.
In the following years, several other GPR manufactures produced arrays that made market entry and those systems faced similar obstacles. With lower-than-anticipated sales, little development occurred on the hardware and software side for years.
In recent years, there has been a renewed push for 3D GPR array systems. Several newly developed or improved systems such as Stream by IDS, MIRA by Guideline Geo, and Raptor by ImpulseRadar have recently made market entry. These systems can collect data at a much faster speed and with higher image quality than their predecessors.
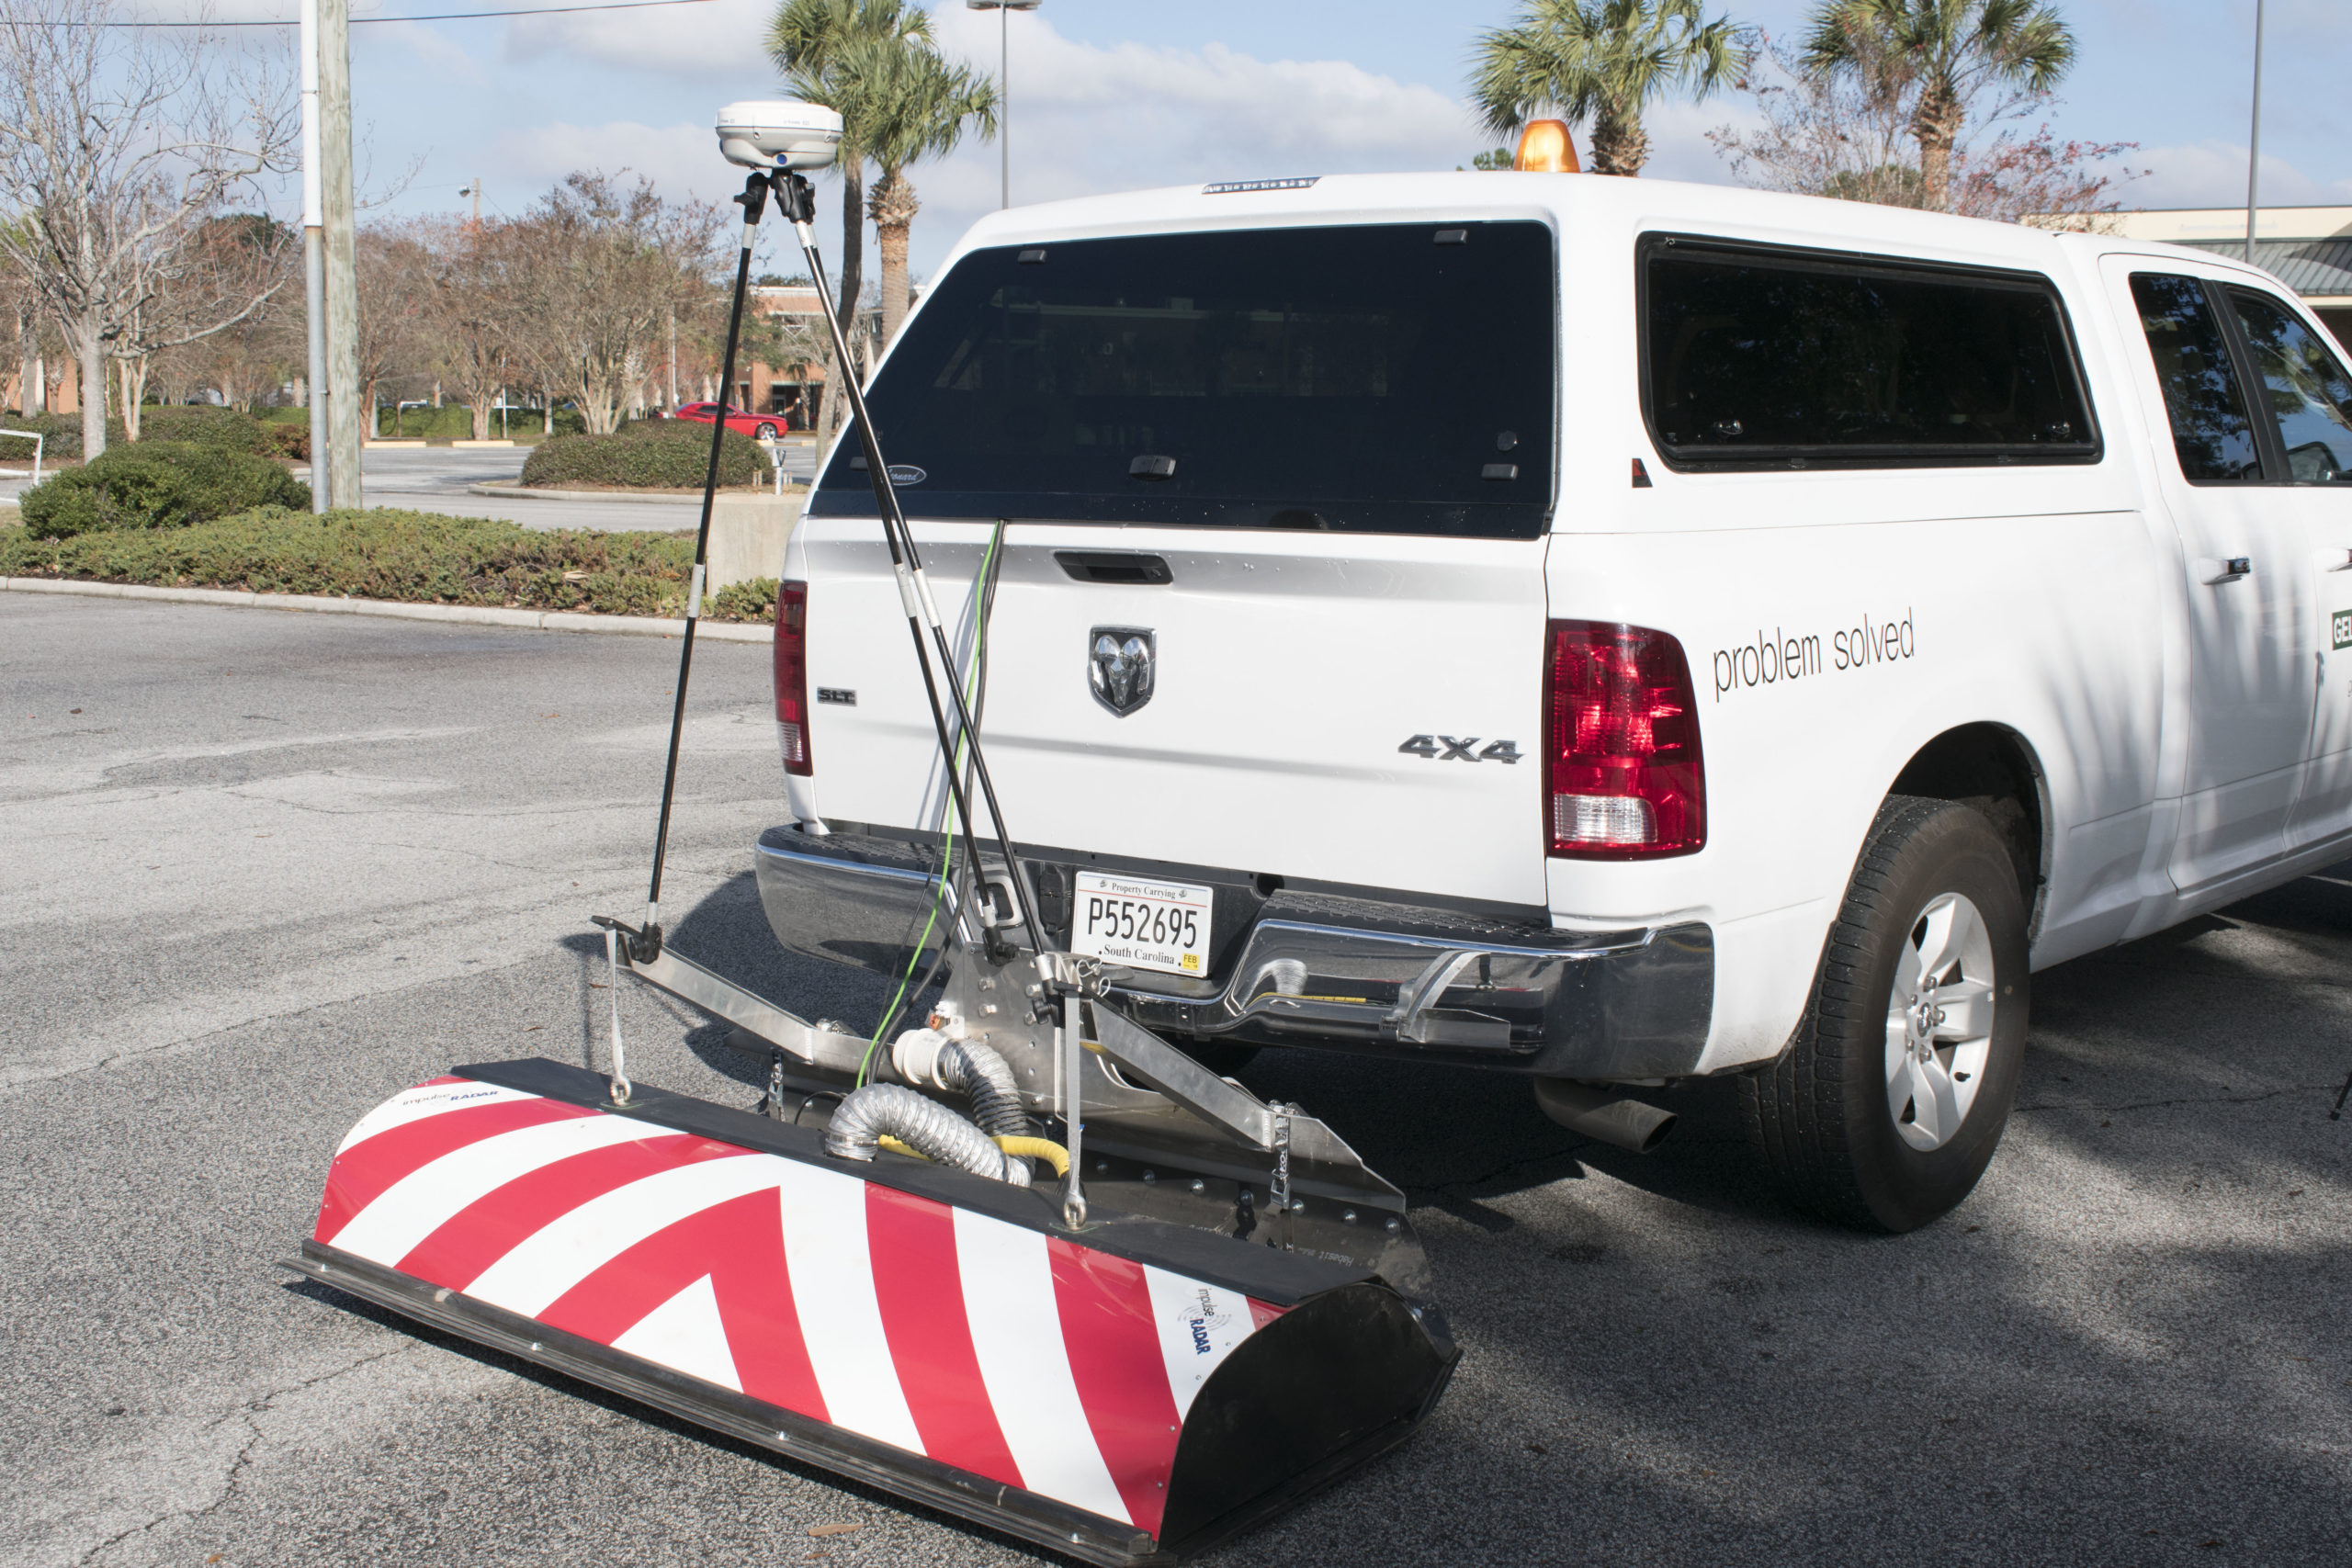
Raptor 3D GPR array system in 2017. The first 3D GPR array system capable of utility mapping at up to 60 mph.
They have more intuitive data collection user interfaces and are accompanied by more user-friendly post-processing software. An industry leader is ImpulseRadar’s Raptor (Image 2 and 3) system with Condor data processing suite.
According to Matthew J. Wolf, president of ImpulseRadar USA, the main goal with the Raptor and the recent addition of the Condor 3D processing software was to streamline the workflow to realize absolute value of deployment.
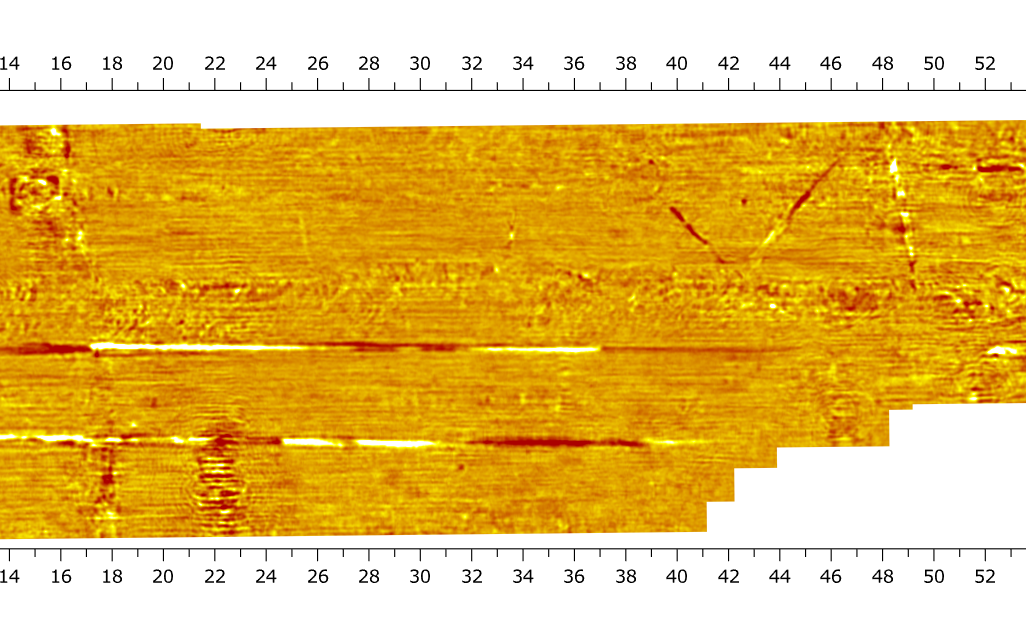
Processed time slice with Condor, 34 inches below ground surface. Underground utilities present at that depth show up as linear features in the data.
“As with any technology it starts out slow and cumbersome but evolves over time. In the early days with slow data collection speed and software relegated to solely a geophysicist, it was hard to reach that inflection point of value of information vs. cost to secure it,” Wolf says. “Now with the Raptor array, data can be collected at posted speed limits, and using Condor software any professional can be trained in data processing. This makes the system an everyday workhorse to provide data density unmatched by any 2D or non-array system over large and small project areas.”
The Raptor system was the first to incorporate real-time sampling digital technology into an array platform. This digital transformation resulted in unprecedented speed for data collection and, as an added benefit, an increase in dynamic range and bandwidth, which means better data overall than in the past for utility and other object detection.
One remaining challenge with 3D GPR arrays is that the systems require continuous precise positioning while collecting data in order to generate interpretable and accurate images of the subsurface. This is accomplished by streaming an NMEA or pseudo-NMEA string into the GPR array data collector from a high-precision GPS (such as a RTK/GPS system), or a robotic total station with auto-tracking capabilities.
This allows the positioning information to be merged with the GPR data. None of these technologies are ideal though. The first requires conditions that are favorable for GPS (downtown environments in major cities, and areas under canopies can be challenging), and the second requires line of site between the total station and a prism located on the GPR array unit. (Is that bus ever going to move?)
Novel positioning technologies such as Simultaneous Localizing and Mapping (SLAM) and Inertial Measurement Unit (IMU), perhaps in combination with conventional technologies, may alleviate some of these issues in the near future.
Another reason for the renewed interest in 3D GPR arrays is that architectural and engineering design is moving into the 3D realm. Three-dimensional design is necessary or beneficial due to increased congestion with underground and above-ground features in developed areas. On any construction project involving additions, foundation work, or cut and fill activities, the most important subsurface piece of information is usually underground utilities.
Engineers and architects involved with transportation projects, streetscapes, utility work, and facility upgrades all express need for accurately mapped utility systems in three dimensions in the design and construction stages of the projects.
This need is also being recognized by the American Society of Civil Engineers (ASCE), which will update its Subsurface Utility Engineering (SUE) Standard 38-02 this year to include a standard for the collection and depiction of 3D SUE data. Given the high-resolution images 3D GPR arrays produce and the high spatial accuracy of the detected targets in three dimensions, it seems natural that those systems should provide the backbone of a 3D SUE investigation.
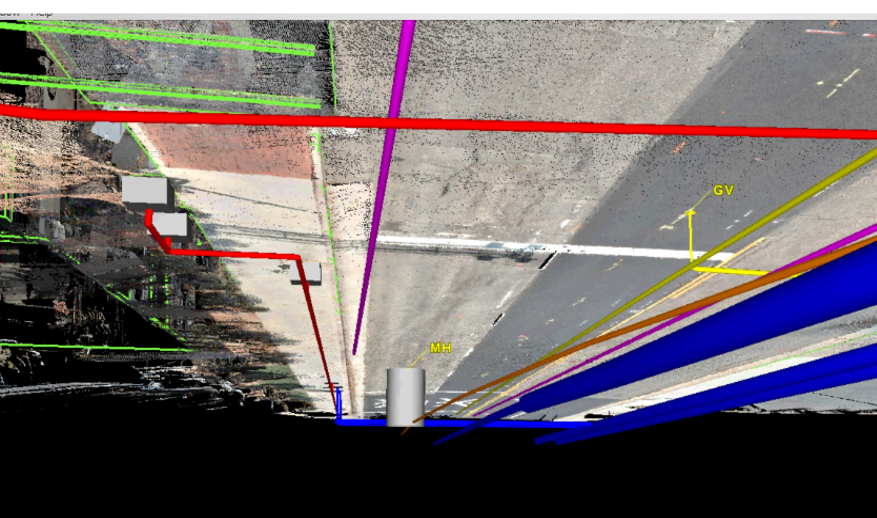
Viewing the world from below ground – combined 3D SUE model and lidar data.
Recent publicly funded research projects by the Federal Highway Administration (FHWA) put focus on the use of 3D techniques for utility mapping. The benefits were reported in the FHWA publication “Feasibility of Mapping and Marking Underground Utilities by State Transportation Departments.” Also, the British “Mapping the Underworld” research project focuses on the development of 3D maps of underground utilities. We are also getting better at visualizing and handling 3D information. For instance, below-ground utility models can be merged with above-ground lidar and photogrammetry data, giving engineers and designers the ability to virtually navigate both the above-ground world and the below-ground world in 3D from anywhere in the world. (Image 4).
Augmented reality systems also already exist, allowing users to “see” underground utilities in the natural environment on their smartphone, tablet or through special eyewear.
It seems like the stars are getting aligned for 3D GPR arrays. As advances in technology drive down price for the surveys, the value of the information is increasing. I believe that there is a new dawn for 3D GPR arrays, and what the Witten Technologies-MALA GeoScience team envisioned some 20 years ago is finally coming to fruition.