Using topo-bathy lidar to map distant islands helps develop high-resolution 3D topographic data for the U.S. and its territories
By Megan Blaskovich
As part of a partnership with the National Oceanic and Atmospheric Administration’s Office for Coastal Management and the United States Geological Survey, Woolpert was tasked with mapping the land, coastlines, and waters of Saipan, Pagan, Rota, Tinian, and other smaller islands of the Commonwealth of the Northern Mariana Islands.
This project is intended to help fill a demand for topographic lidar and bathymetric lidar data of islands in the Pacific Ocean. It coincides with similar work that has been delivered or is being acquired at nearby locations, including the main islands of Hawaii and several of the northwestern Hawaiian Islands.
Task orders were awarded under contracts by USGS and NOAA OCM, with each agency contracting a portion of the work and both agencies participating in the development of the project specifications and data review. The Federal Emergency Management Agency and the Natural Resources Conservation Service were also funding partners on the project.
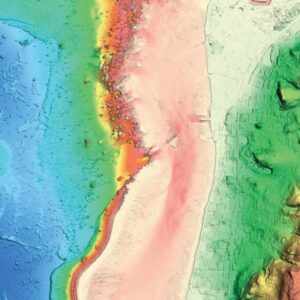
The steep cliffs off the eastern coast of Saipan are depicted in this seamless, one-meter resolution topo-bathy digital elevation model. (image courtesy of NOAA OCM and USGS)
The project includes the acquisition, processing, and delivering of high-quality, topographic and bathymetric (topo-bathy) data. The data acquisition and processing occurred in 2019 and 2020, and the products—including a classified lidar point cloud, a seamless topo-bathy digital elevation model and normalized reflectance imagery—have been delivered and are under final review.
Once approved, the data will be made available to the public and used for a variety of purposes, including hazards modeling and planning, habitat mapping, and navigation.
This project directly supports the USGS 3D Elevation Program, which seeks to complete nationwide data acquisition to provide the first national baseline of consistent, high-resolution 3D topographic data for the United States and the U.S. territories.
USGS cartographer Tim Saultz said this is the first time such high-quality mapping data has been available for the westernmost territories of the U.S., and it is the result of a successful partnership among federal agencies.
“The cost of acquiring and processing the data to map a remote area such as CNMI is very high in terms of mobilization and project development,” said Saultz. “There was a requirement for both NOAA and USGS to have this data and, by developing this project together, we were able to pool our funds and get the project done. This is a continuing example of how well NOAA and USGS work together on all kinds of lidar projects.”
Extreme Weather and Terrain
The weather and remote location of CNMI presented several logistical challenges to mapping the area, which required extensive planning. The diverse landscape of CNMI features about two dozen volcanoes, both submerged and above ground, resulting in extreme changes in elevation with high volcanic peaks rising from near sea level.
The islands are subjected to strong northeast trade winds, which have carved out rugged coastlines with steep cliffs that plummet into deep waters on the eastern sides of the islands. Large harbors and sand banks define the western coastlines, where calmer winds allow for less extreme terrain. Clouds are a persistent issue and form quickly when the sun rises and rapidly heats the air. This presented daily challenges when collecting data at the higher elevations.
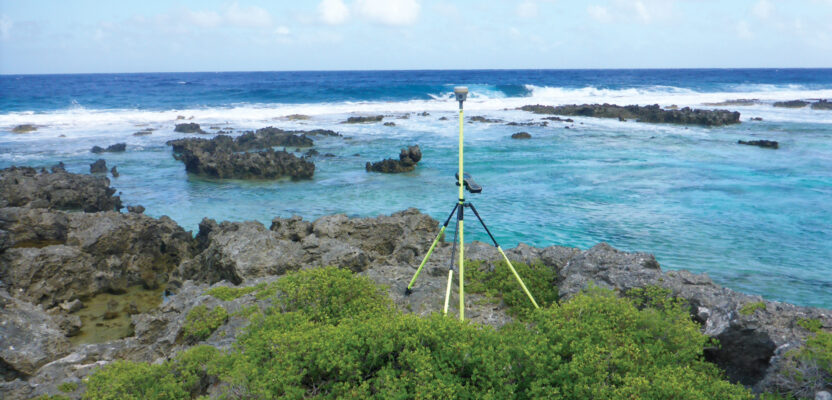
Woolpert deployed a Cessna 406 aircraft configured with Leica HawkEye 4X topo-bathy lidar system to collect the data, the bulk of which was acquired in July and August 2019, with the final flights completed in July 2020. The Cessna was flown at multiple altitudes ranging from 450 to 900 meters above ground level to both optimize the strength of the bathymetric returns and to accommodate the extreme changes in terrain. A total of 589 flight lines were flown and 363 square kilometers (140 square miles) of topographical lidar data was acquired; 188 square kilometers (72.5 square miles) of bathymetric data was acquired.
While data points were captured for nearly every craggy peak and deep caldera on the islands, one steeply shaped volcano with a narrow aperture on the island of Pagan prevented the laser pulses from reaching its depths. Also, on the island of Rota, one small area was consistently covered in clouds and there was not enough space for the aircraft to safely fly below the clouds and above the mountainous peaks, preventing data collection.
The overarching objective for USGS and NOAA OCM was to obtain clean, seamless topo-bathy lidar data from the inland peaks across the intertidal and shallow near-shore zone to depths of approximately 45 meters. Lidar data were acquired immediately when optimal environmental conditions were present forthe near-shore topo-bathy survey flights.
Ground Control, Positioning, and Processing
Over the continental U.S., it is possible to position collected data to multiple continuously operating reference stations (CORS). To map a remote area like CNMI, where positioning infrastructure is limited, it is necessary to use precise point positioning (PPP). PPP generates highly accurate positions from a single global navigational satellite system receiver, which allows for the collection of accurate data in locations where it is difficult or impossible to establish a robust network of base stations.
To support the production phase of this project, approximately 25 points were used for lidar data calibration. The survey team designed a geometric observation plan prior to GPS observations and downloaded and processed the observation data daily to ensure the integrity of the network as it was constructed. Surveyors from NOAA OCM collected the ground control for the independent data quality analysis.
NOAA OCM geographer Dave Stein said NOAA’s technical staff is often called upon to assist communities, other agencies, and NGOs with the interpretation and use of various geospatial products, including topo-bathy lidar and geodetic data.
“Whenever we plan a field survey like this, we reach out to our NOAA partners to determine if there are other mission drivers,” Stein said. “As part of this particular project, we collaborated with NOAA’s National Geodetic Survey. We designed our geodetic survey to occupy critical benchmarks that NGS needs to develop the Mariana Terrestrial Reference Frame of 2022.”
For quality assurance purposes, the data was processed in the field immediately after acquisition to verify the coverage had appropriate density, distribution, and water clarity. If there were any unacceptable data voids, reflights were scheduled to ensure the highest probability of achieving clean, seamless, topo-bathy data coverage across the intertidal and shallow near-shore zones.
The topo-lidar data was acquired at an aggregate nominal pulse spacing of 0.35 meters or eight points per square meter, for Quality Level 1 (QL1) data. The bathymetric lidar data was acquired at an aggregate nominal pulse spacing of 0.71m or two points per square meter for Quality Level 2 (QL2B) data.
Delivering National Lidar Standards
The topographic lidar under this task order met the requirements specified in the USGS National Geospatial Program Lidar Base Specification. These standards specify that vertical accuracy be reported at the 95 percent confidence level for data tested by an independent source of higher accuracy. The bathymetric lidar data is being assessed and reported in accordance with the National Coastal Mapping Strategy for bathymetric lidar 1.0. Vertical accuracy will be assessed for bathymetric lidar at QL2B.
To meet the USGS requirements, the topographic lidar data digital elevation model was hydrologically flattened. The shoreline was defined by the extent of the collected topographic lidar data to prioritize ground coverage over an aesthetically pleasing coastline. The topographic lidar data was used to compile the hydrologic features.
Lakes, reservoirs, and ponds, at a minimum size of two acres, were collected at a consistent elevation and compiled as closed polygons. Rivers and streams, at a nominal minimum width of 30 meters, were compiled in the direction of flow with both sides of the stream maintaining an equal gradient elevation.
Ground points were reclassified to buffer along the hydrologic feature and to generate a hydrologically flattened DEM. The hydrologic break lines compiled as part of the flattening process were provided as a deliverable.
The integrated topo-bathy DEM features a seamless ground surface from the topographic data across the bathymetric data to the predetermined project boundary or laser extinction. Due to the clarity of the water in the region, the bathymetric data consistently reached depths of 45 meters before laser extinction.
The integrated topo-bathy DEM was not hydrologically flattened. The intensity data from the bathymetric lidar data for all the islands were converted from raw, uncalibrated values to normalized, relative reflectance values suitable for the extraction of information related to the benthic substrate. The relative reflectance data was delivered as scaled, 16-bit values in the intensity fields of the LAS point clouds and as 16-bit, GeoTIFF raster files.
Coral Reefs, Wrecks, and Obstructions
This two-year acquisition and processing of the topo-bathy lidar data provides an unclouded view of the CNMI. The virtual representation of the physical attributes of the islands will assist public and private agencies in multiple ways—from providing accurate navigational tools for seafaring vessels to detailing environmental features in support of conservation efforts, project planning, and natural resource management.
In addition to supplementing navigational chart depths and identifying wrecks and obstructions, the bathymetric lidar data is being used to identify characteristics that are common among resilient coral reef sites.
“Characteristics of the seafloor topography such as depth, slope, aspect, and rugosity are being used to characterize the benthic habitat around CNMI,” Stein said. “Additional sensor characteristics, such as reflectance intensity and lidar waveform attributes, are being processed and used to further delineate benthic habitat. Coral reef managers and stakeholders in the region have expressed great need to have high-resolution maps of the benthos to inform resilience-based management.”