Solar energy grows in part due to aerial imaging and surveying.
Solar power is booming in the United States. “Every three weeks,” President Obama said in his 2015 State of the Union address, “we bring online as much solar power as we did in all of 2008.” Geospatial technologies—especially remote sensing and surveying—play an important role in siting, designing, and constructing solar arrays, from a few panels on the roof of a house to hundreds of thousands of panels in huge solar farms.
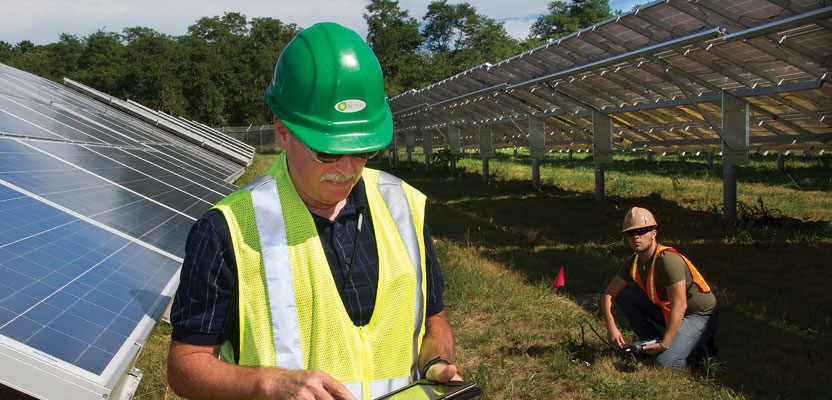
John Heiser (foreground), a senior environmental research engineer at Brookhaven National Laboratory (BNL) collects solar data at the Long Island Solar Farm—a 200-acre, 32 MW facility located on the BNL campus. Credit: BNL
The biggest challenge to maximizing the power output of solar panels is … shade! Passing clouds, topographic features, trees, buildings, rooftop installations such as HVAC systems, and even adjacent panels can block the sun’s rays from reaching solar panels. Smart design and construction can mitigate shading, but site selection based on high-resolution aerial imaging and surveying can minimize it up front.
Deciding Arrays’ Orientation
Currently, a popular solar energy project type is utility ground-mounted solar arrays. “Agricultural fields or different parcels of land get acquired for the purpose of designing and installing solar systems, typically by developers who have projects and have obtained power-purchase agreements with utilities,” says Sam Laughlin, who runs the civil engineering department at Blue Oak Energy, a company that designs commercial and utility solar photovoltaic (PV) projects for rooftops, carports, and open real estate across the United States and abroad. “They will ask us to engineer the system for them and put together the construction documents.”
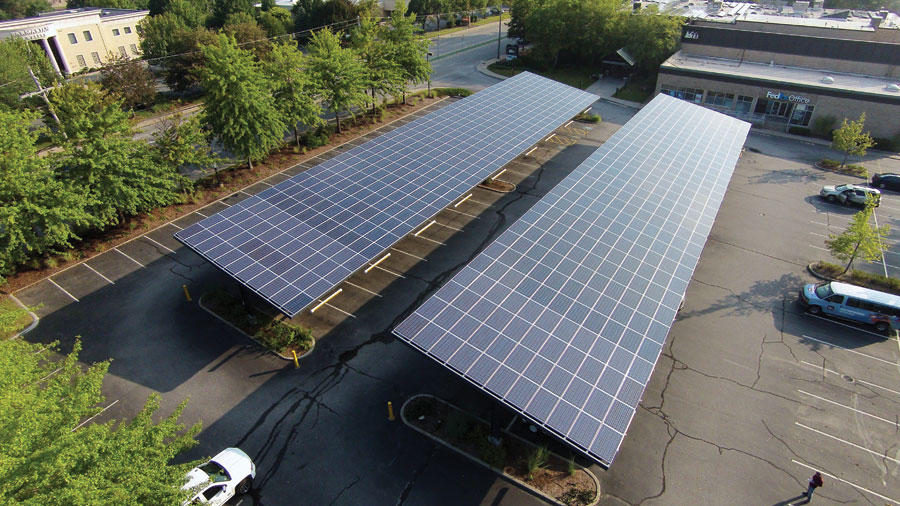
Blue Oak Energy uses a multidisciplinary engineering team to plan solar installations, such as this car port at an REI store.
As with any large industrial installation, many considerations come into play when deciding where and how to build a PV solar array. They include the topography of proposed sites, whether the panels should be mounted on a fixed-tilt or a tracking system that follows the movement of the sun, whether to have energy storage, and whether to connect to the electric grid.
“The site’s location helps to determine the proper orientation for the solar array and whether a tracking system makes sense over a fixed-tilt system,” says Laughlin. His department works within a multidisciplinary engineering team that enables it to tie together the energy modeling aspects with the land constraints to fully optimize solar energy facilities.
His group also provides all the structural engineering aspects of solar projects, such as the foundations for supporting solar arrays and inverters.
“For net metered [energy offset] solar projects, the site’s energy consumption profile and utility rate structure play a huge role in tilt angle azimuth orientation. For utility-scale solar farms, the energy is typically being sold to a utility company off-taker at a specific value per unit of energy ($/kWh). The value of energy and whether it is a fixed rate or a variable rate plays a huge role in determining the technology and orientation of the mounting system.”
The company engineers the systems and creates the construction documents.
Credit: Blue Oak Energy, Inc.
“You have to optimize your output to your energy use,” says John Heiser, a senior environmental research engineer in the Biological, Environmental & Climate Sciences Department of Brookhaven National Laboratory (BNL), on Long Island, New York. For instance, he points out, the Long Island Solar Farm—a 200-acre, 32 MW facility located on the BNL campus—is optimized for summer-time use at 3:00 pm, not for optimal power production on a total year basis.
“If you optimize an array for a westward sky, your sell-back to the local electrical utility may be very low because you are underutilizing during the part of the day when the sun is high. However, if your goal is to maximize energy production at the time of peak use—which for most U.S. households is in the evening—then a westward orientation might be preferable. So, you have to decide what you want to get out of your solar installation and whether you want to be on-grid or off-grid,” says Heiser. “If you don’t have storage, then you probably want to optimize for peak use.”
The Role of Aerial Imaging
When comparing sites for planning purposes, there’s not much to work with besides Google Earth and other publically available data websites, according to Laughlin. “You can take the satellite imagery, focus on the particular site, and look at the topography [and] the surrounding environment, determine what permitting agency has jurisdiction, look at NRCS public soil data, look at any GIS layers that the county might have and what you can learn from them, where the adjacent power lines and utility substations are, look at FEMA maps. If the site is in a flood plain or a blue line stream or a jurisdictional water body or a wetland, you are going to have more headaches, additional civil engineering requirements, and more site encumbrances.”
However, satellite imagery is not detailed enough to perform the final engineering for commercial and utility scale solar projects, Laughlin points out. “Rooftop and ground-mounted obstructions don’t really get picked up with the Web-based imagery technology currently available. We always have to go to the site and survey in person so that we know what’s actually there. If our dimensioning is off by one inch in some area of a complex large-scale solar array, the effects can cascade through the entire project. We have found that spending a little extra care and time and money at the early stages of the project can save immensely on the back end.”
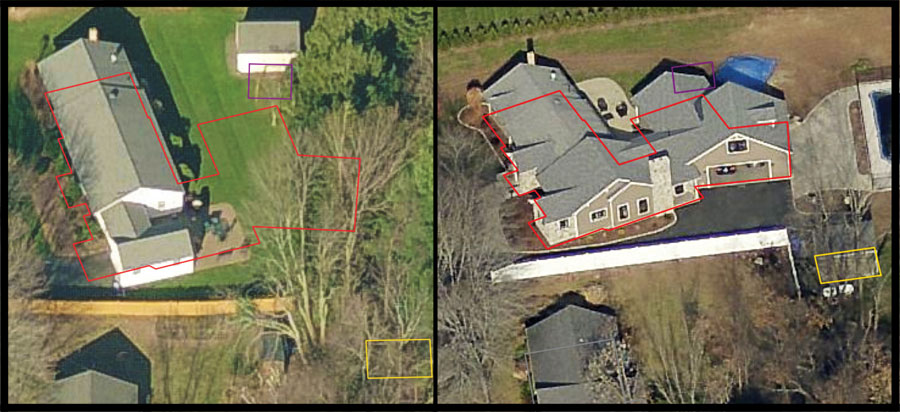
One company that sells aerial imagery to solar planners and engineers is EagleView Technologies, formed two years ago by the merger of Pictometry, which had been collecting oblique imagery for 12 years, and EagleView, which had patented the ability to measure roofs and overall structures. The company sells geocoded imagery of the tops and all four sides of buildings, at three-inch resolution on average, as well as CAD files with exact measurements of the tops and sides.
Its solar energy business began with residential installations because solar companies were looking for a faster way to measure roofs and to expedite the design and production of panels to install on roofs, recalls Heidi Ellsworth, the company’s executive VP of marketing. “One of the big benefits of aerial imagery for placing solar panels on any building is that we can see all of the obstructions,” she says. “We can see the vent, the HVAC unit, and we can draw them and measure them so that the solar companies know what is up there. We produce a CAD file that the solar company engineers can then import into whatever engineering program they are using.
Using an oblique view obtained from aerial imagery (at two inches per pixel resolution), solar installers can determine
obstructions that cast shadows on parts of a roof. Credit: Pictometry.
“They are then able to place panels very precisely, with the imagery and the precise measurements of the roof, saving a tremendous amount of time for the guys out in the field not having to measure and for the engineers not having to re-draw it once they get the measurement. They are also starting to use this imagery in the sales and marketing process because they can look at it very quickly, figure out where the panels would go, and give some estimates.”
The company’s solar reports give the azimuth of roofs, their pitch in degrees, and what percentage is facing south. Ellsworth says, “We always try to fly leaf-off so that we can see the buildings and get really strong measurements. Sometimes, however, solar companies want to see leaf-on so that they can see the shading, so we also do that. Every industry has different needs.”
Something that EagleView Technologies has been doing in other markets and may become of interest in solar is change detection: using its imagery archive to show what has changed in a certain area. Are there more or fewer trees? Are there more buildings? Are there more high-rises? “We can let them know what’s a good area, what is changing, and give them some of that analysis that helps them make decisions,” says Ellsworth.
Software such as Pictometry’s ChangeFinder shows changes in a location over multiple years, which can be used for risk analysis and valuation. Credit: EagleView Technologies.
The Role of Surveying
The amount of shading on solar panels depends on the shape and size of objects between them and the sun as well as a site’s latitude. At lower latitudes, where the sun is on average higher in the sky, obstructions will have a smaller impact than at higher latitudes, where the sun is on average lower. “That’s something that we always have to take into account as we space the rows of solar panels,” says Laughlin. “With topography, the slope affects how one row shades the next one. In conjunction with topography, we perform the energy modeling. If you have a north-facing slope, you will probably have to space your arrays out farther because of the production lost and the shading. So, it is most always better to have a south-facing slope.”
Topography plays a crucial role in deciding how the PV racks will be installed. Credit: Blue Oak Energy
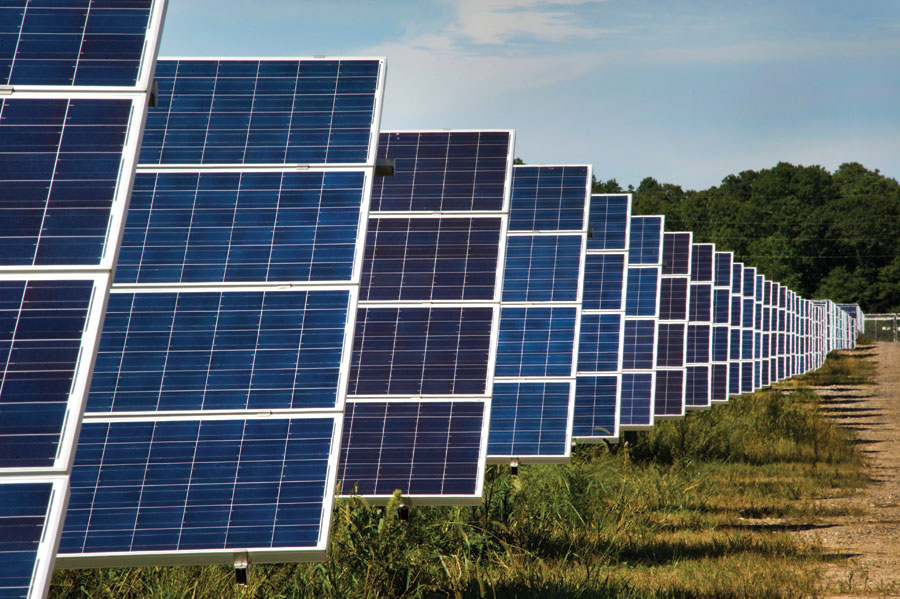
Solar arrays consist of racks of PV panels mounted either on tubular steel or H beams with a fixed module tilt of typically 20 degrees or 30 degrees, depending on the latitude, or on single-axis trackers that face north-south and rotate the panels east-west. (Dual-axis trackers can also track the sun north-south to adjust for seasonal variations. However, while trackers can increase solar panels’ energy production, they also create parasitic losses because of the energy required to operate their motors.)
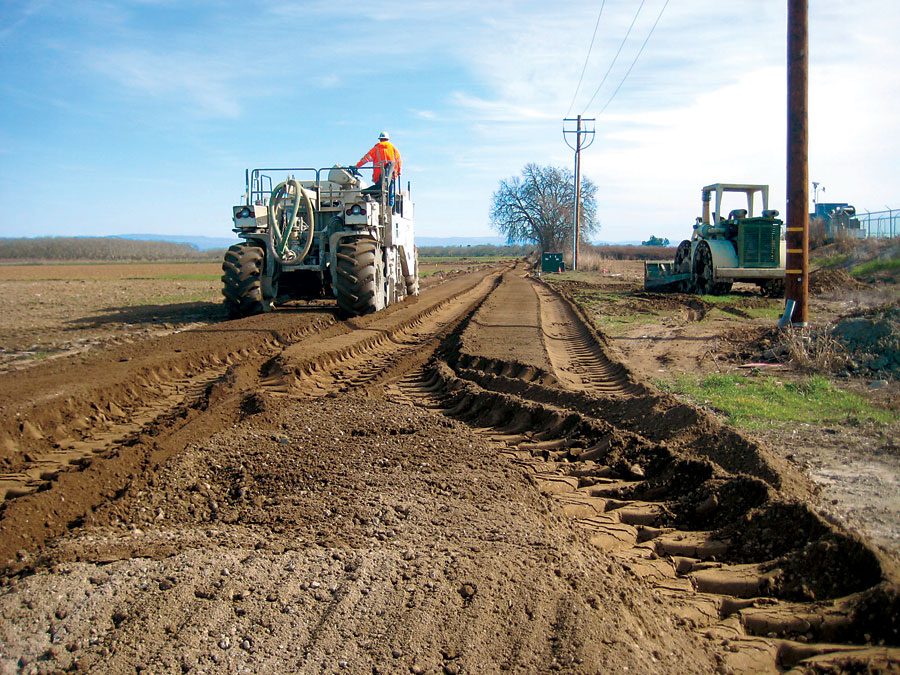
Whether fixed-tilt modules or trackers, the racks cannot be installed on very steep slopes. Therefore, planning and design needs to take into account the cost of grading and altering drainage to meet the racks’ installation requirements. “Often,” says Laughlin, “creating nominal slopes in certain directions will improve the constructability of the array. So, the topography is everything for figuring out how the PV racks are going to work in the field, and it is all integrated with the structural design of the piles, with the production of power, with the grading and the drainage and the maintenance and so on.
“That’s why the more precise surveying equipment and technology that […] you use as a base file, the more you can accurately minimize grading and the fewer headaches you will have in construction. You can save money, quicken the schedule for construction, and so on. So, getting detailed survey maps is really important.
“The main thing we’re after,” he adds, “is the CAD file with all the existing information to use for design. That is in a particular coordinate system and datum in space, and we keep it there, so when we build the array on top of it, a surveyor can pick up from the same monument or the same datum and do the construction staking off of that design.”
Public-Private Cooperation Promotes Solar Energy Research
Brookhaven National Laboratory (BNL), on Long Island, New York—one of 17 large research facilities owned by the U.S. Department of Energy—hosts the Long Island Solar Farm (LISF), a 200-acre array that uses 164,312 solar panels from BP Solar to generate 32MW for the local electric utility. It was engineered by Blue Oak Energy and began operating in November 2011.
In exchange for an easement to locate the farm on the lab’s campus, LISF, a privately owned facility, financed the establishment of the lab’s Northeast Solar Energy Research Center (NSERC), which operates the largest research solar array in the Northeast. When completed, the research array, which uses Suniva monocrystalline silicone panels tilted at 23 degrees, will generate a little more than 1 MW. “We are looking at sustainable energies and how they can be exploited to the fullest extent,” says Bob Lofaro, group leader of the renewable energy group in the Sustainable Energy Technologies Department at BNL.
NSERC installed its own monitoring instruments on the LISF—including pyranometers that measure solar insulation and “total sky imagers” that take pictures of the clouds as they move over the array—so it is continuously collecting very high resolution data for research purposes. “We can do such things as validating different models that we developed for our solar arrays,” says Lofaro. “We can actually forecast how much power we get out of the array based on the weather conditions. We also have power-monitoring instruments in the array measuring how much power comes out of each of the inverters.
“Their variability is very interesting. One of the big problems with these large solar arrays is that their power output varies as clouds come over. We are interested in seeing how you might be able to manage that so that it does not impact performance on the grid when they are connected to it.”
The Long Island Solar Farm consists of 164,312 solar panels from BP Solar that provide enough electricity for roughly 4,500 households. Credit: BNL
NSERC will test smart inverters and energy storage devices. It hopes to install smart grid sensors and do micro-grid demonstrations. It will also mount some panels on single-axis trackers that will follow the sun from sunrise to sunset to compare their performance with that of the vast majority of their panels, which are mounted on a fixed tilt. “We have empty racks where vendors can come in, install their own technologies, and do reliability performance testing and comparisons against other technologies,” says Lofaro.
BNL, as a Department of Energy-owned facility, operates and controls its own power grid. Therefore, NSERC is not required to obtain UL listings to install and test its equipment, which delivers power directly to the lab’s grid. “It is very difficult to test new technology on the outside,” Lofaro explains, “because utilities don’t want to risk disrupting service in their utility. Here, it is very easy because we can install it and run tests without all of that red tape.”
NSERC’s sky imagers take still images every 15 seconds. “By looking at the movement of the clouds and correlating that with power from the array, we are able to do some algorithm development to actually predict how much power you might get out at any particular time based on the weather forecast. The forecasting is important for the utilities, particularly when they are in the energy markets and they are trying to estimate how much power they might be able to deliver at certain times.”
Most large solar arrays use a single centralized inverter to control all of the panels, with a maximum power point tracking algorithm to constantly adjust the voltage and current coming out of the panels in order to maximize their power output. One research feature of NSERC’s array is that it uses modular inverters instead, each controlling a 67KW block of the array and each with its own MPPT algorithm built into it, allowing it to control different blocks independently, which helps optimize power. “You can do research looking at different algorithms and how they compare with each other, which one gets you the most power,” says Lofaro.
BNL’s John Heiser collects the solar resource data, air temperature, panel temperature, and some ground and humidity data in the solar farm. He also works with a forecasting group that’s developing models to forecast how clouds will affect the solar farm using sky imagers to look at the cloud movement.
“They use algorithms that pixelate the clouds,” he explains. “Then, by looking at progressive sets of pictures, they can tell which way and how fast the clouds are moving and when those clouds should impact the solar farm. They are looking to do this forecast for a 3- to 15-minute window.”
Conclusions
The quantity and resolution of remote sensing imagery is rising sharply, due to the increased resolution of commercial satellite imagery allowed by the U.S. government and the launch of dozens of low-Earth orbit micro satellites. The likely explosion in the number of UAVs will add enormously to this trend.
Meanwhile, increased concern with climate change and rapidly dropping production costs for PV panels will continue to boost demand for solar power. These developments make solar energy an emerging market for surveyors, providers of satellite and aerial imagery, and other geospatial professionals.