A geography professor uses GIS to recreate the Battle of Gettysburg, discovering what General Lee could and could not have seen to guide his fateful decisions.
 Advances in tech-nology in the last 150 years have been remarkable. In our industry we have seen many changes in our surveying methods and in mapping practices in general. I think about what this country’s earliest surveyors would have done with our technology. What would the maps be like? How would technology have affected life back then? Would wars have had a different out-come if the strategists had had more accurate and detailed maps? Dr. Anne Knowles wondered these same things.
Dr. Knowles is a professor of geography at Middlebury College in Vermont. She is fascinated with maps and specializes in historical GIS. Dr. Knowles has published many books and articles about using GIS to study history, but she is especially interested in the Battle of Gettysburg.
What was it that lost the Confederacy the battle of Gettysburg? Could it have been that General Lee didn’t send out enough scouts to map the land? Did he make his fighting strategies based on little or no idea of what the terrain was like? What exactly could Lee see while gazing at enemy lines?
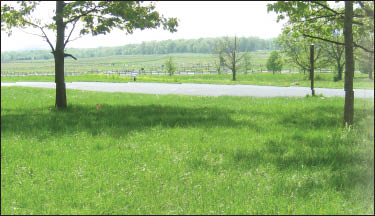
When we visit the site now, we expect to experience the battlegrounds in the most authentic way possible so we can ponder these questions. However, over the 150 years since the battle, the landscape has changed quite a bit. Trees and bushes have grown or been removed for new construction. It’s difficult to imagine what the landscape would have looked like back then.
Therefore, since 1999 the Gettysburg National Military Park has been rehabilitating the physical landscape as it was in 1963 (see PSM’s December 2011 cover article, “In the Footsteps of the Topographical Engineers at Gettysburg”). Park personnel are planting trees and bushes in historically correct locations, removing dense vegetation elsewhere, and rebuilding fences in the materials and manner recorded at the time of the battle. The plan is to give tourists the same lines of sight commanders had and to help visitors imagine soldiers’ difficulties as they crossed exposed ground, dodged through underbrush, and struggled to dismantle worm fencing.
From Contours to TIN
Dr. Knowles, in her search for what was visible at the time, turned to her GIS knowledge. Her program of choice: ArcGIS, a tool for digital terrain construction and analysis. Visibility analysis, a common method for analyzing terrain and landscape perception in GIS, uses a digital model of the terrain to determine points and areas that are, or are not, theoretically visible from a known viewpoint.
The obstacle Knowles first encountered was finding maps to base the project on. The search for terrain data began in the office of Curtis Musselman, cartographer and GIS coordinator at Gettysburg National Military Park (author of the December 2011 article). Musselman generously shared the many GIS layers he and his colleagues had created over the years, including renderings of historic roads and lanes, fence lines, property boundaries, and buildings as they stood in 1863. He also provided a digital elevation model (DEM) developed for Adams County by a private firm in 1996 and a set of contour lines at 5-foot intervals that had been interpolated from the DEM. The elevation data meets the U.S. Geological Survey’s national map accuracy standards for 1:4,800-scale mapping, and the 5-foot contours provide much more detail than the 20-foot contours on the area’s Geological Survey topographic maps.
Detail mattered, because small differences in elevation were strategically important in the battle and in the views commanders had on foot and on horseback. The gentle swales over which the Confederates charged on the last day of battle, for example, were no more than eight and perhaps only six feet from bottom to top. The 5-foot contours seemed a promising basis for analyses that would approximate commanders’ actual fields of view.
To find out what parts of the battlefield would have been visible from a particular location, such as the top of the Lutheran Seminary, Knowles had to convert the contour lines of elevation into a continuous digital surface that provided elevation values over the entire area of the battlefield. With GIS, she generated a triangulated irregular network, or TIN, from the 5-foot contours. Knowles could then perform the visibility analysis to see the GIS program’s estimate of which areas of the terrain surface would or would not be visible from specific viewpoints.
The Adams County 5-foot contours and the digital terrain Knowles produced from them, however, have two significant short-comings for historical analysis. First, they represent the landscape of 1996, not the landscape as it existed at the time of the battle. The modern landscape includes a quarry, a reservoir, and a highway that skirts the boundary of the national park. The contours capture the terrain after 140 years of changing land use. Fields that have been continuously farmed since the Civil War may have gained or lost elevation over time due to the effects of mechanical plowing and erosion.
Second, the 1996 data contains numerous artifacts of computer calculation, such as the contours’ unnaturally sharp corners and geometric shapes. While the 1996 contours probably represent elevation more accurately than any other source, they may not be the best representation of the shape of the battlefield’s historical landscape.
Better Data from an Older Map
Therefore, Knowles created a second digital terrain model from historical maps produced by the U.S. Army Corps of Engineers, the post-Civil War successor to the topographical engineers. From 1868 to 1869, a crew of army topographers surveyed the Gettysburg battlefield in extraordinary detail. The manuscript map that the field director of the survey, first lieutenant William H. Chase, produced under Warren’s supervision depicts the battlefield at a scale of 200 feet to the inch (1:2,400), with contours at four-foot intervals.
The entire manuscript map, which measures approximately 13 feet square, now exists in 20 sections that are kept in a vault at the National Archives with other national cartographic treasures. Between 1869 and 1874, the huge manuscript map was recompiled and reduced to a poster-sized scale of 1:12,000. The resulting engraved map was then re-checked and corrected by a commercial surveyor and Army engineers. Extant surveyor’s notes show that the topographers meticulously surveyed the streams, noting every foot change in water depth, the slope and physical character of stream banks, and locations where a freshet could have drowned soldiers burdened with battle gear.
Extracting contours from the Corps of Engineers map to use them in GIS analysis proved a daunting task. When Knowles began the project, no scanning program could distinguish between the contour lines and the various lines representing fences, trees, boulders, and houses.
The extraction process began with manual tracing of the four-foot contours from a good photocopy of a proof sheet of the engraved 1:12,000 map, using a light table, drafting pens, and Mylar sheets. While most of the map was traced at its original size, the steepest hills (Wolf Hill, Culp’s Hill, Little Round Top, and Big Round Top) were enlarged to trace their tight contours.
Knowles scanned the Mylar tracings at high resolution, then digitally separated lines that touched in steep areas and ensured that lines had not been dropped during tracing and that contour lines connected across stream beds. Once the hills were patched in, each line was assigned elevation as recorded on the original map. The final step was to use GIS to generate a TIN from the final contours.
Analyzing Viewsheds
It was now possible to run viewshed analyses using the historical TIN. But the results could not be compared to viewsheds based on the 1996 data, nor would it be possible to combine the historical data with other GIS layers until Knowles assigned known geographical coordinates to the 1874 data. Without that, the historical contours and TIN were simply lines and polygons with no known location on the Earth. The GIS software could not display the historical and modern layers in the same view. It was as if the historical contours were out in the ocean somewhere, hundreds of miles from Gettysburg.
Knowles and her team used a GIS process called georectification to fit the contour tracing to the hills’ and valleys’ real locations on Earth. Historic buildings that have not moved since 1863 provided control points for connecting the drawing to real-world coordinates.
The results were not flawless. The location of specific landscape features in the two sets of contours varies significantly and in more than one direction. Hilltops and ridgelines are generally closely aligned, with displacement of less than 50 feet between the historical and modern contours for some landscape features such as the peak of Little Round Top. Creek beds and more rolling terrain, however, differ by hundreds of feet in some locations. At the scale of the entire battlefield, viewsheds generated from the two datasets are remarkably similar.
What Lee Could See
What could General Lee see during the second day of battle? Knowles first ran a hypothetical viewshed analysis, positioning Lee in the cupola of the Lutheran Seminary. Historians have suggested that he had a good view of the ground within a half mile of the seminary, as well as Benner’s Hill to the east, the nearest angle of the Union line on Cemetery Ridge, and the Union salient thrust forward by major general Daniel E. Sickles near the Peach Orchard.
Yet the GIS viewshed analysis suggests that Lee may have been able to see considerably more than the rather limited areas that historians mention. Lee’s view could have encompassed much of the northern half of the battlefield. It also may have provided a clear view of the rocky height of Little Round Top and the high ground along the Emmitsburg Road near the Peach Orchard.
Knowles thinks we can be most confident about the areas the viewshed analysis indicates Lee would not have been able to see, which were precisely where the greatest threats to his army were accumulating:
- the area southeast of the Union’s “fishhook” line, where reinforcements massed throughout the second day,
- the hotly contested ground between Little Round Top and the Peach Orchard, and
- large sections of the two valleys down which general James Longstreet marched and then countermarched Confederate forces before he launched an assault on Little Round Top on July 2nd.
Interactive Map
In November 2012, Dr. Knowles was awarded the first annual American Ingenuity Award for Historical Scholarship by Smithsonian Magazine. Her connection with the Smithsonian led to discussions in early 2013 about taking another look at visibility at Gettysburg. William Allman, chief digital officer at Smithsonian Enterprises, suggested the idea of creating an interactive map of the battle as part of the Smithsonian’s marking of the battle’s 150th anniversary.
With help from Middlebury undergraduate Dan Miller, Knowles worked with a new team to develop a webmap that would enable the public to explore the battle and to learn more about the role of sight at Gettysburg. Knowles and Miller digitally traced hundreds of troop positions for 15 key moments of the battle from maps compiled by John Batchelder in the years following the battle. Cartographer Alex Tait, 3D modeler Tim Montenyohl, and others at International Mapping Associates developed a new digital terrain model by using Knowles’s terrain data to remove modern-day features from a new lidar dataset that provided improved accuracy for viewshed analysis. Web developers on Esri’s StoryMap team, led by Allen Carroll, created the online, interactive platform.
The result of this whirlwind effort was launched in time for the anniversary on July 1-3. Posted on the Smithsonian website, the interactive map allows viewers to follow the progress of the battle, to zoom in for closer views (which bring up the names of battalion commanders), or pull back from a broader view of Confederate and Union troop positions. The most exciting discovery for Knowles was seeing how six panoramic views rendered by Montenyohl capture the historical landscape (with trees, rocks, and troops in their historically accurate positions) and crucial moments when commanders such as Union brigadier general Gouvernour Kemble Warren decided how to deploy troops in response to their view of enemy forces.
As for Lee’s view, the new viewsheds and panoramic views confirmed Knowles’ earlier findings that Lee may have been unaware of how many Union forces had gathered in the shadows of the hills, particularly as he was deciding to launch his final assault on the morning of July 3.
Thanks to Dr. Knowles’ painstaking research we can get a new kind of perspective on what the great generals could (and could not) see on that fateful day. Applied to other battlefields and other wars, similar geographical analysis could provide many valuable insights into military strategy, the wisdom of command decisions, and the experience of war.
Credits
Thanks to Professor Knowles’ research teams: Will Roush, Caitrin Abshere, Lucas Farrell, Andrew Feinberg, Thom Humber, Garrott Kuzzy, Charlie Wirene, and Dan Miller; International Mapping Associates (Alex Tait and Tim Monteenyohl); and Esri’s StoryMap team, led by Allen Carroll.
Image Credits
- RG77 CWMF E105 (Cartographic Record), “Battle Field of Gettysburg,” color proof, Bvt. Maj. Gen. A. A. Humphreys (ca. 1874), National Archives, College Park, Maryland.
- RG77 CWMIF E81–2, 1 of 5, sheet II (Cartographic Record), “Map of the Battlefield of Gettysburg,” Bvt. Maj. G. K. Warren (1868–69), National Archives, College Park, Maryland. Photograph courtesy of Ronald Grim.
- Source data from RG77 CWMF E105–2(Cartographic Record), “ Battle Field of Gettysburg,” Bvt. Maj. Gen. A. A. Humphreys (ca. 1874), National Archives, College Park, Maryland. Ink tracings on mylar by Anne Knowles, joined and digitized by Will Roush.
- Source data from RG77 CWMF E105–2 (Cartographic Record), “Battle Field of Gettysburg,” Bvt. Maj. Gen. A. A. Humphreys (ca. 1874), National Archives, College Park, Maryland and courtesy of Adams County GIS Office, Gettysburg, Pennsylvania. Map by Knowles research team.
- Troop positions digitized from John B. Bachelder’s maps, reproduced in Richard A. Sauers, The John B. Bachelder Gettysburg Map Set (Dayton, OH: Morningside House, n.d.). Map by Anne Knowles and Daniel Miller.
- Photo by Anne Knowles.
- Source data from RG77 CWMF E105–2 (Cartographic Record), “Battle Field of Gettysburg,” Bvt. Maj. Gen. A. A. Humphreys (ca. 1874), National Archives, College Park, Maryland. Map by Knowles research team.
The interactive map of the Battle of Gettysburg:
smithsonianmag.com/history-archaeology/A-Cutting-Edge-Second-Look-at-the-Battle-of-Gettysburg.html