Integrity monitoring the islands of the Hampton Roads Bridge Tunnel involves combining hydrographic survey, lidar, shoreline survey, and terrestrial lidar survey.
Rigorous structural integrity monitoring to extend the lifespan of critical infrastructure is an economic necessity. Remote sensing and integrated remote sensing provide new ways to monitor all elements of a structure in fine detail. This is in contrast to legacy monitoring of discrete points.
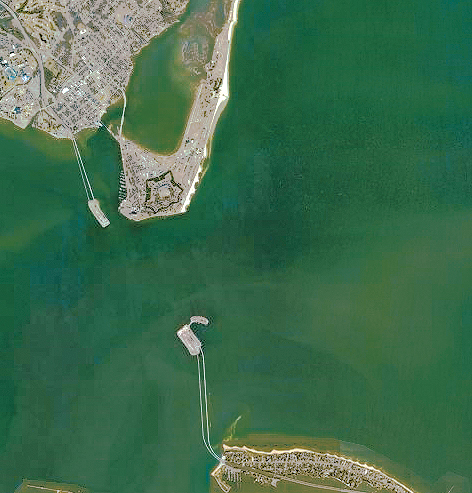
An aerial view of the 3.5-mile Hampton Roads Bridge Tunnel.
An example of how multiple remote sensing methods can be used is for the Hampton Roads Bridge Tunnel (HRBT). Built in 1957, the HRBT connects the cities of Norfolk and Hampton, Virginia; this is one of the busiest port-access channels in the country, for both commercial and naval vessels.
It is a 3.5-mile crossing that links two parallel single-tube tunnels accessed from human-made islands on the north and south. Low-level trestle bridges connect the manmade islands to the shoreline at each end of the crossing. The HRBT is designed to weather harsh conditions and storm surges, but as with any structure a comprehensive monitoring program is imperative.
Combo Order
Rice Associates, a surveying and geospatial-solutions firm with roots in the Tidewater region of Virginia, fielded an intriguing task order under their on-call contract with the Virginia Department of Transportation (VDOT): to integrate multiple elements of the integrity mapping for the HRBT—terrestrial, hydrographic, and shoreline.
Rice began conversations with VDOT’s hydrographic survey team about the sonar data that they had been collecting around the tunnel islands. The sonar data is collected on a continuing basis to monitor the stone-stabilized slopes below the water surface. The resulting point clouds from their data collection missions were very similar to the point clouds produced by lidar scanners used in mobile or static scanning systems.
The discussion led to a joint project to gather highly detailed terrain information above and below the water’s surface. This combination of technologies marked a first for both Rice Associates and VDOT.
VDOT’s hydrographic survey boat was used as the platform for both data-collection missions. Rice set up a custom mounting point for the Leica Pegasus One mobile mapping system on VDOT’s boat. While the Pegasus system features both lidar and cameras (for close-range photogrammetry), the focus of the mission was on the lidar, to closely monitor the armour stone structures ringing the shoreline of the islands.
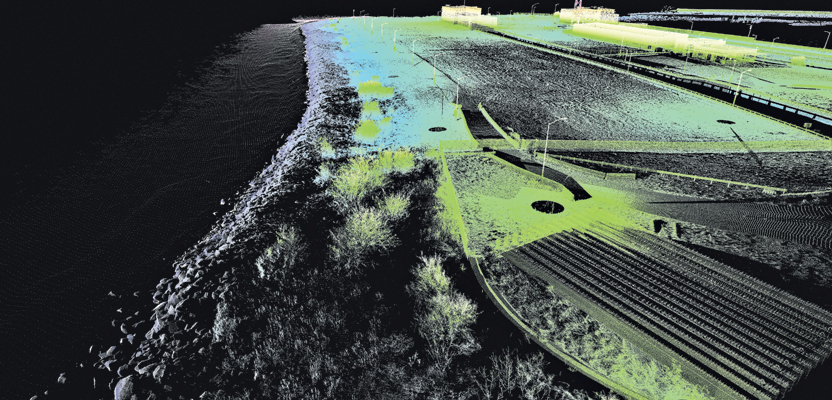
This combined lidar data set of the southern island includes sidescan sonar, shoreline lidar, and terrestrial static lidar.
Hardware setup and test mounting was performed on land with the boat on the trailer. Rice used lidar to verify even the lidar setup: a static lidar scan of the mapping system (as mounted on the boat) was performed to verify the measurement to the antenna reference point of the second GNSS antenna. A second GNSS antenna was added to the mapping system to correct for errors in the heading, resulting from the linear and rotational motions affecting the boat during the mission.
While the boat mount for the mapping system was custom-fabricated by Rice Associates.
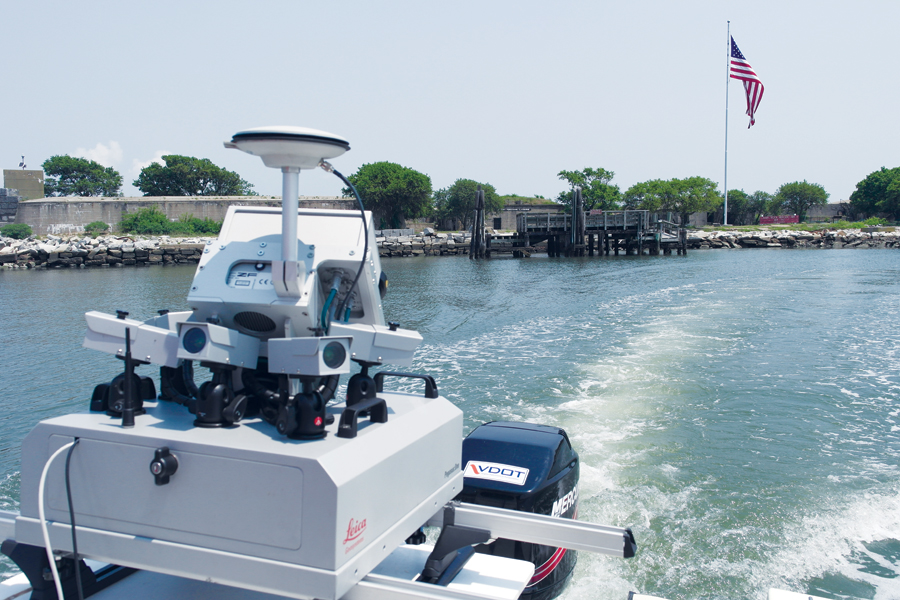
Our Leica Pegasus: One mobile mapping system was boat-mounted to scan the shoreline along the southern Island.
The Novatel SPAN inertial and GNSS positioning module integrated into the Pegasus system has ports to accommodate additional receivers.
The HRBT tunnel islands are in a location that experiences strong and swift tide changes, and tide and wind greatly increase the compensation required of the Inertial Measurement Unit to correct for the six degrees of freedom affecting boat motion. VDOT performed the hydrographic survey around the HRBT islands using side scan multibeam sonar equipment. VDOT personnel captained the boat during both data-acquisition missions and were most familiar with the dangerous areas due to shallows or boulders.
To attempt acquiring overlap of the two data sets, the hydrographic scanning mission was performed during a high-tide period, and the shoreline scanning mission during a low-tide period. The timing of the missions would produce the greatest opportunity to obtain overlap and points of quality control.
Clear Results
Despite the fact that the shoreline scanning was performed on the hottest day of the summer, the mission was a real success. All systems operated as expected without hiccups, and the marine forecast was stellar. Low wind speeds and waves in the 1’ to 2’ range were contributing factors.
Once field collections were complete, the sonar and shoreline scans were post-processed. During both missions, GNSS receivers were set up on existing control monuments, and subsequently the data was used to process the boat’s trajectory during each mission.
The estimated position accuracy of the post-processed GNSS solution was 8mm on average for the entire shoreline scan boat mission. GNSS conditions on the open water were excellent and showed very consistent and reliable results in the lidar data.
VDOT processed and supplied the side scan sonar data, in Bentley’s .POD format, to Rice Associates. Rice was responsible for the final merger of the data sets into one deliverable. The integrated deliverable was also in .POD (for use in Microstation).
Software used to process the Pegasus lidar was Novatel Inertial Explorer, Leica Pegasus Auto Post Processing, and Leica Map Factory.
Finding common registration points between the scans was relatively easy; shoreline scans and side-scan sonar data contained some overlap between the high and low tide marks. Shoreline scans to static scans on the island had common points on buildings, barriers, and other structures which were used to verify or perform minor adjustments.
During a previous project, Rice Associates had performed a topographic survey of the topside of the southern Island and used static laser scanning to collect the field data. They incorporated this previously collected lidar data of the entire south Island into the final combined point cloud files.
The final deliverable included a .POD file for each island and reports for the shoreline lidar scanning mission. This information will give VDOT a clear picture of the condition of the stone stabilization around both islands, above and below the water.
This combined lidar data set of the southern island includes sidescan sonar, shoreline lidar, and terrestrial static lidar.