Until recently, 3D has been a bit of a gimmick to the everyday GIS user, by this I mean that it has been quite time consuming to create a GOOD 3D representation (easily) until now.
I’ve used some great 3D software whilst working on survey data and also visualisation of environmental impacts, Fledermaus, ArcScene, Sketchup, 3DS Max, Solidworks, Caris to name a few…..one thing they all have in common though, is their weight.
If I want to create a quick and elegant image to show a client a side elevation of their project or the topography, it is quite time consuming churning through the data, then if I want to share the output….well lets not go there right now.

You could do this in mere minutes
Now, before we start, I just want to remind you that you output will only be as good as your input, that is to say that, if you use good quality data, you will get a quality output. Further to this, ensuring you use the same vertical datum throughout is key, there is nothing worse that adding trees at 0m which end up floating…..
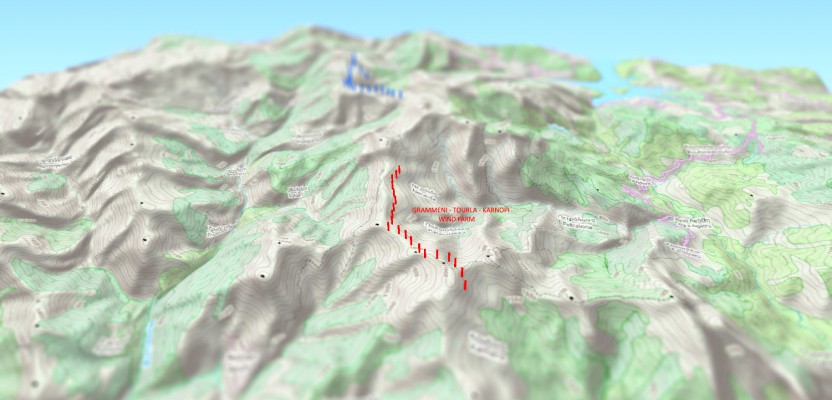
The above image was created using QGIS 2.4 and the QGIS2Threejs plugin, the data is all open source too! The DEM is the GTOPO30 (750m cells) & the basemap is openstreet map. I am sure that the OCD among you will point out that the DEM is a little too coarse for this scale and you are right, ideally a 10m or 50m cell DEM would be better but I am not creating a true life representation….I am producing a quick and simple visualisation for a client to understand their topographical issues.
Step 1: To start with, get all your software installed and make sure it all works, then set up an account with the USGS EarthExplorer, so far this has proved to be the easiest place to obtain quality for commercial & research use for free.
Step 2: Get your DEM, go to the EarthExplorer website and extract your DEM of choice. Tip here is to obtain a little more than you need, therefor if you reproject or add more data, you have a little more flexibility. Most of the formats which EarthExplorer use will work with QGIS, for this demo I used DEM format, this is ideal for the QGIS2Threejs plugin.

Selecting a DEM
Step 3: Open up QGIS and add your DEM. I also added a raster image of the same scale to provide a reference to the viewer (otherwise it just looks like lumps and bumps).
At this point, don’t worry about symbolising your DEM, I have also added some points and called them WTG 1 & 2, these are not 3D points, just normal point shapefiles. Feel free to create or add your own. There is no need to display these on the map, they will be drawn by the QGIS2threejs.
Step 4: Open up QGIS2threejs

Finding the QGIS2Threejs plugin (once installed)

The interface
To make it easy, we will ignore the first 2 options “World” & “Control”. If you wish to reduce the extent of your model or vary the exaggeration, then this can be done under the “World” option.
Select the “DEM” option and you should find that the DEM is already selected, if not, add it here. Already the plugin has selected quite a good resolution but feel free to tweak to suit though keep in mind that higher resolutions will result in bigger and slower models. Leave the “Display type” set to map canvas image.
Step 5: Make some pretty turbines – go to the point (or if you have polygons the polygon) option.

Set your points to look cool
Set your base height value to 0. This is the height which you want the point to sit from the surface, therefore by setting it to zero, it will sit directly on top and any height you provide the point will be from the surface (DEM). In the “Style” option, I set my point to “Cylinder” so that it would look a little like a wind turbine, though feel free to experiment!
If you also chose “Cylinder” as an option, you will now have the option to set the radius and height (from the DEM) you wish to set your point. For my map, I set the radius to 20 (where the projection system is in metres, this will mean that 20 = 20m), 20m is around the average turbine width and I then set the height to 150m, around the same height as a commercial turbine.
Step 6: Set a file path and run!
Step 7: Play with your new 3D model in your browser….
Step 8 (Optional) – Add a tilt shift effect to add that extra level of cool. Take a screengrab of your model and then save it in a quality image format (.png, .jpeg). Open tiltshift maker and upload your image…create something AMAZING!
Pretty easy eh? Using QGIS 2.4 has made a huge difference, previous attempts to write this blog over the last year has been tricky….it’s only been since the latest iteration that I would say that this is an option for the average GIS user.
This isn’t just a toy though, I have tried running 1m xyz data for a client on ArcGIS (ArcScene) & Fledermaus (DMagic) and waiting a few hours for it to process only to find it render in 5-10mins in QGIS2threejs. Although this has some way to go to be capable of being used for survey analysis and professional 3D modelling, it is hard to ignore when it is so efficient and easy to use and SHARE.
Yes, I said share….what makes this so handy is that you can zip up the file(s) which it creates and send them to someone, they can then extract the zipfile and open the html in their browser! There is also the option of hosting the model, though I am not going to go into the details of port forwarding or web hosting today..
A free 3D software for the masses which doesn’t require a MSC in geodetics, the option to share models quickly and easily?….the 3D revolution starts here!
Nick D