A 3D data company created a photo-realistic cross-country-course simulation using mobile mapping, with more innovation to come.
When the best collegiate runners take their marks at the NCAA Cross Country Championships in Wisconsin next year, the course will be as familiar as their favorite training routes.
Above: Plans are underway to create treadmill routines that match the course’s gradients.
Most will have experienced every twist and turn by watching a photo-realistic 3D fly-through of the course onscreen, and some may even get the chance to train on computerized treadmills that adjust their pitch to precisely match real terrain changes they see on the monitor in front of them.
That’s the plan in the works at Mandli Communications, a Fitchburg, Wisconsin, technology company specializing in the collection and application of 3D data with a focus on transportation applications. Mandli has teamed with the nearby University of Wisconsin and other partners to improve the way elite and recreational athletes train for running, cycling, and rowing competitions.
Only an hour was needed to install Maverick and survey the course.
“The automated treadmill is under development now, and we hope it will be ready for the finals next year,” said John Caya, Mandli director of business development. “The 3D simulation is already being used for planning and promotional activities.”
The technology that is making these applications accessible and affordable is a new mobile mapping system from Teledyne Optech. The portable system captured simultaneous 360-degree digital imagery and lidar terrain elevation data of the Wisconsin course.
Mandli believes the speed and ease of data collection will help make simulation technology cost-effective for widespread use at professional training venues and neighborhood gyms alike.
“We mapped the entire course in about 30 minutes,” said Caya. “It would have taken us a week with traditional methods.”
Just as importantly, the terrain and visual data collected by the system provided a level of accuracy and detail that would have been impossible to capture with traditional equipment, such as a total station and camera.
Training in a Realistic Environment
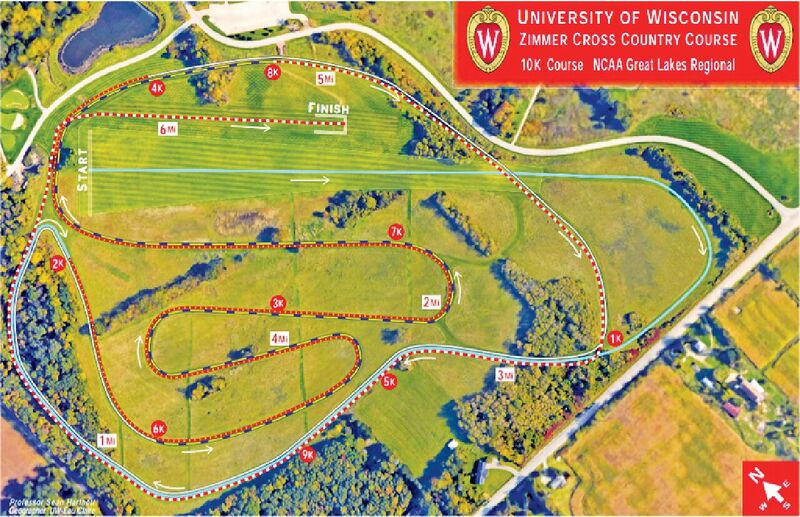
The University of Wisconsin designed and built the Thomas Zimmer Course in 2009 with championships in mind. It features a wide starting area to accommodate large numbers of runners and two loops that take the athletes through the woods on races ranging from 4K to 10K. The NCAA Championships in 2018 will be the first hosted by the Badgers on the course.
Mapping a collegiate cross-country venue serves two purposes. First, the route selected for a race must be accurately measured to ensure it meets official specifications set down by the NCAA. Secondly, race organizers rely on site maps to determine where to place team tents, first-aid stations, viewing stands, and refreshment booths.
Maverick’s detailed lidar data confirmed that the course met official specifications.
“Most courses are now surveyed with total stations to capture precise measurements and terrain data,” said Caya. “Cameras are used to take pictures for logistical purposes.” This mapping process is extremely time-consuming.
The simulated 3D environment could be the next big thing in athletic training, Caya explained. Not only does it satisfy course measurement and logistics needs, but an immersive interactive simulation allows athletes to train more realistically for a specific event and route, as well. But while major events like the Boston Marathon and Tour de France might have the money for this kind of mapping, the technology has been out of reach for most others.
Mandli saw the 2018 Cross Country Championships as an opportunity to prove that 3D mapping is economically and practically accessible to end users like colleges and universities. After presenting the idea to the Wisconsin athletic department, Mandli rolled out the new mobile mapping system for a high-profile demonstration.
3D Data Collection for All Applications
Teledyne Optech introduced the lidar-based Maverick system in October 2016 with the goal of expanding the traditional markets for mobile mapping services. The Toronto-based company develops airborne, mobile, and terrestrial solutions that integrate digital imagery and elevation data-capture capabilities.
“With Maverick, we were trying to accomplish three things: bring the price down to remove barriers to entry; remove some of the complexity associated with high-accuracy mapping; and shrink the unit for deployment in different types of applications,” said Albert Iavarone, business unit manager for Teledyne Optech’s terrestrial products division.
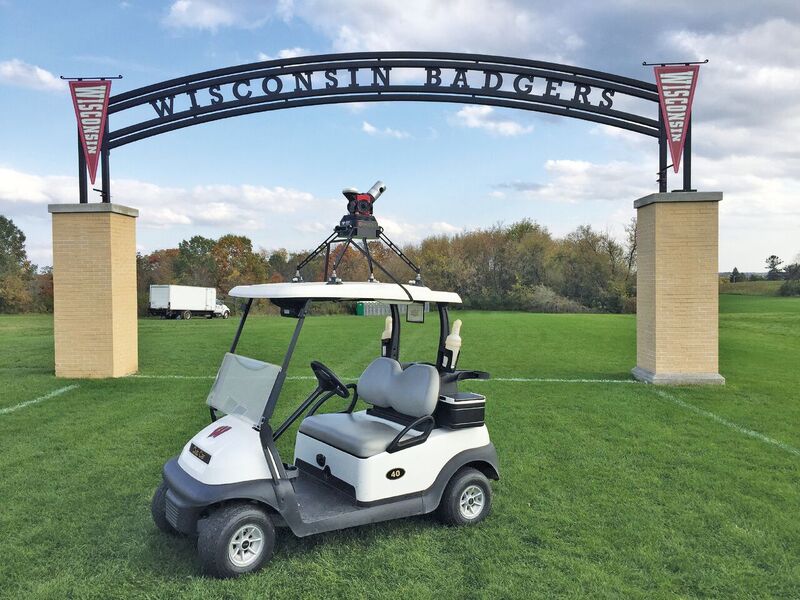
Portability was also a primary consideration. Whereas Teledyne Optech’s other mobile units are designed for long-term installation on automobiles or trains, the Maverick can be quickly mounted on or removed from a vehicle and then checked with baggage on a commercial airliner for transport to the next project. During data collection, the device can be operated from a backpack or mounted on a standard rental car, ATV, Segway, or golf cart.
The unit weighs 9 kg and incorporates six 5mp digital cameras and a high-definition lidar capable of collecting 700,000 points per second. Data is captured simultaneously 360 degrees around and above the device.
For the Wisconsin project, Mandli mounted the Maverick to the roof of a golf cart. By switching on the unit, the operator activated its internal WiFi capability which connected the device to an iPad. No software downloaded to the tablet. The operator controlled the entire data-collection process from the iPad.
“Everything was inside the mapping device: the GPS, cameras, lidar, computer, hard drive, software, and WiFi,” said Mandli’s Caya.
The operator then drove the cross-country course capturing the image and elevation
data. Only one pass around each loop was needed since the unit collects 360-degree coverage. During collection, the captured images were displayed on the iPad screen in real time along with details of the lidar and GPS data quality. This enabled the operator to ensure data was being collected at the desired specifications.
The total time required to mount the unit, set it up for mapping, and then drive the course was about an hour. Although an experienced Mandli technician performed the data collection, no particular geospatial training or background was needed for this phase of the project.
Processing the Data
Maverick came bundled with the Optech Distillery data processing software. Once the field work was completed, Mandli obtained differential correction data from a local NOAA Continuously Operating Reference Station (CORS) to post-process the onboard GPS data in Distillery running on a workstation.
The same software used the location information to register the lidar datasets to create a point cloud of the course, which was then geo-referenced and overlaid with the color imagery.
The resulting photo-realistic 3D point cloud had a relative accuracy of ±2 cm and an absolute accuracy of 1 meter.
“That was sufficient accuracy for this project,” said Caya. “[The university] wanted a very accurate relative accuracy for the terrain being modeled, but one meter was fine for real-world location.”
Mandli then exported the processed and colorized 3D point cloud into its own workflow for customized data enhancement requested by the end user. Working primarily in their own Roadview Workstation software, Mandli extracted survey points, break lines, and 3D vectors delineating important logistical areas on the course from the Maverick point cloud.
Additionally, the firm measured elevation grade changes and tagged distances in the point cloud to show where the 1K, 2K, and other markers would be located during the race.
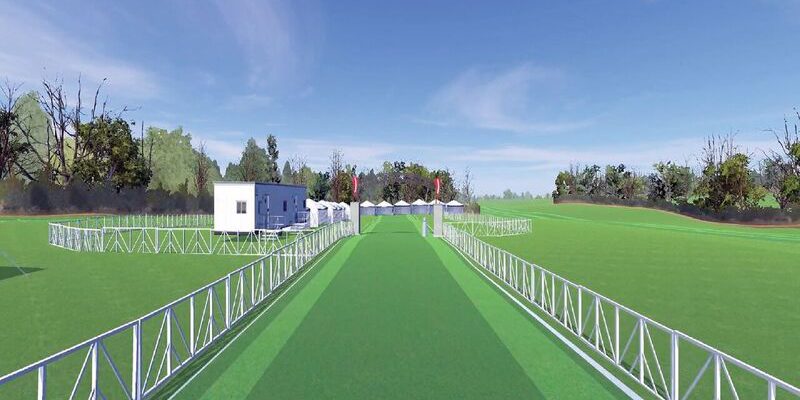
To create the 3D fly-through, Mandli teamed with Floating Point FX, a nearby Madison company specializing in generating realistic simulations for government applications, as well as video games and movies. This firm further processed the colorized point cloud by taking the elevation mesh and cleaning it up to generate a realistic 3D model.
“We used a gaming engine called Unity to assemble all the textures, the 3D model, and the sky to create an interactive 3D environment where the user has control, like a video game,” said Sam Selle, a 3D artist at Floating Point FX.
The two companies recorded several short fly throughs of the cross-country course for the university to use in promoting the upcoming event and planning the layout of facilities. These run on any standard computer and have been posted on the web and incorporated into PowerPoint presentations.
Changing Training Practices
Mandli and the university are using the interactive version of the 3D environment, which also runs on a regular laptop, to pursue the goal of integrating the technology into automated athletic training equipment.
Several companies already make computerized treadmills and cycling machines where the user watches a course video onscreen while the equipment changes pitch or resistance to simulate terrain. But Mandli and the Wisconsin athletic department plan to take that technology one step further. They’re working with partners to develop training equipment where changes in treadmill pitch or cycling resistance sync perfectly with the imagery. In other words, the exercise machine will be controlled by the elevation model.
“As runners move through the course, they can look to their right or left and see exactly what they would see if they were actually there,” said Caya.
“Just like a video game, athletes will walk, run, and jump their way through the scenes, and they will even be able to choose their own routes within certain boundaries. Athletes will become familiar with the course, both visually and physically, and gain invaluable experience without ever leaving their gym,” Caya said.
To read the rest of the articles in this print issue, click on the issue cover, below.