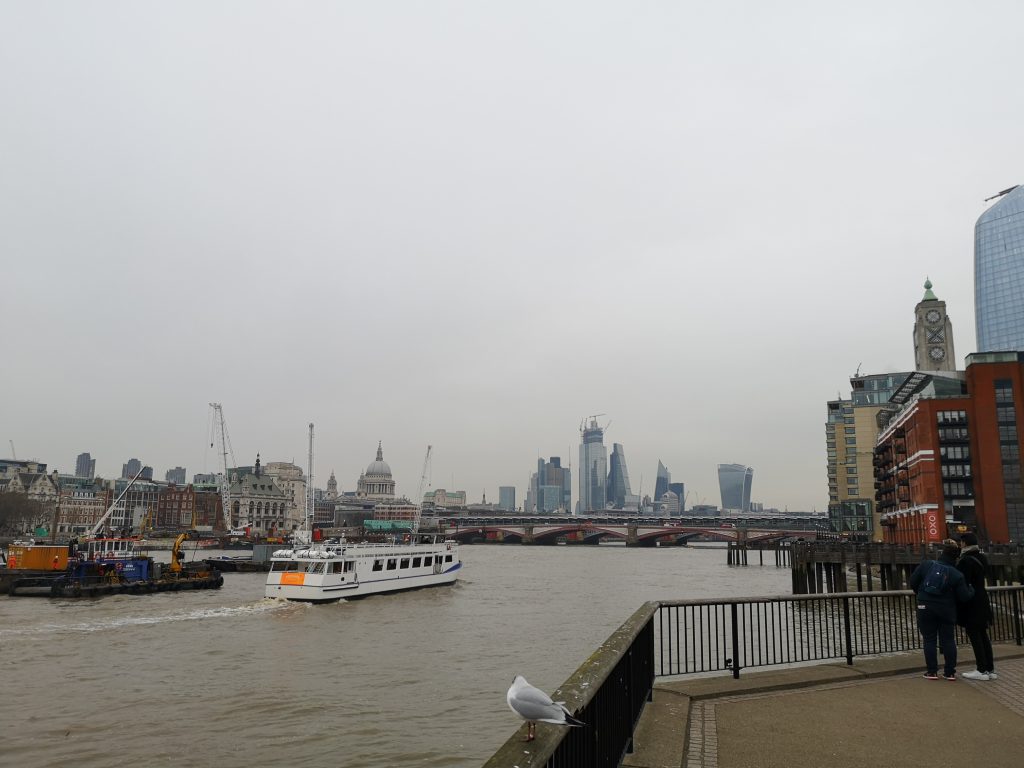
I recently had reason to be in London for a short meeting and walked past London Bridge, looked at the sky around me, and thought, “I wonder how accurate that map I made last year is?” I was fortunate to have my camera phone with me so that I could take a few pictures.
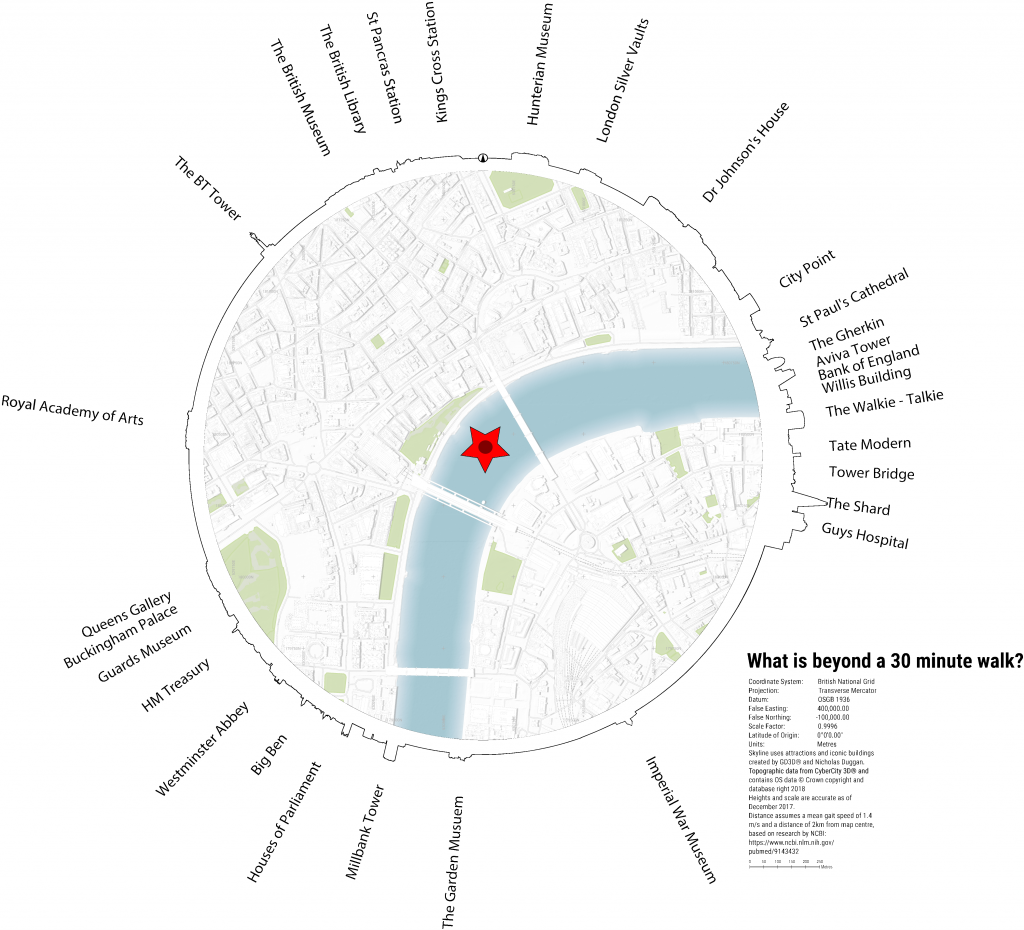
The original map was created by taking a few square kilometres of quality 3D data and then calculating what landmarks could be seen within that 30-minute walk radius.
Once the information had been calculated, I then created a skyline by running a “silhouette” analysis and stitching it together around the map. In theory, the analysis should provide the skyline of landmarks which would be to scale from the viewers position in the centre of the map.
How Accurate Was It?
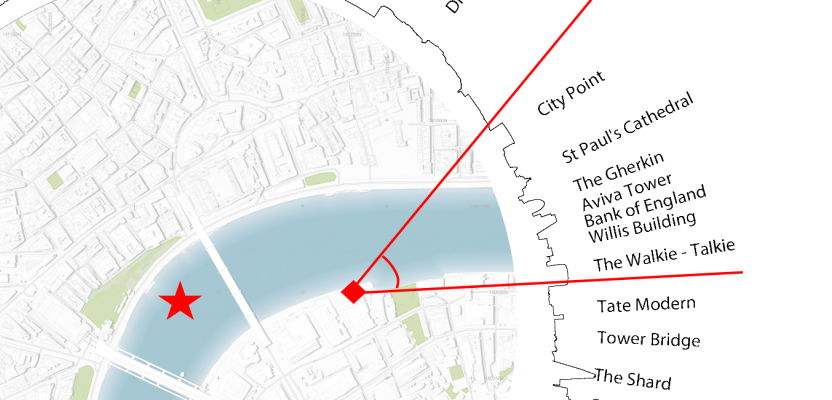
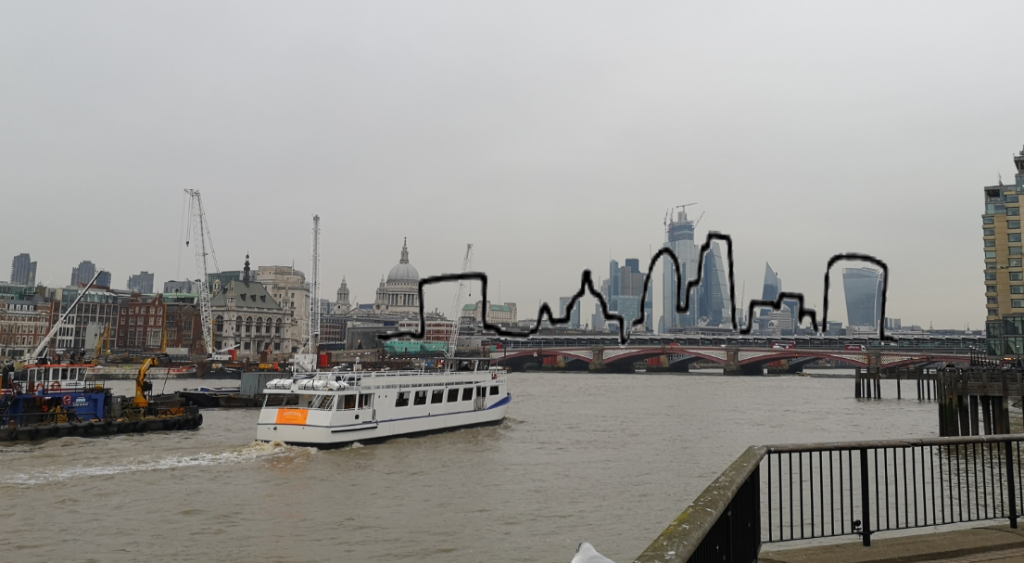
In the map above, the star denotes the proper centre of the map and the diamond denotes the point from which I had my view. At the time as I was viewing the map on my mobile phone, I was pretty sure I was close, though on return, I realised just how far out I was.
But how far off was it?
If we “clip” the skyline out from between those red lines on the map, we should be pretty close, right?
How Wrong I Was!
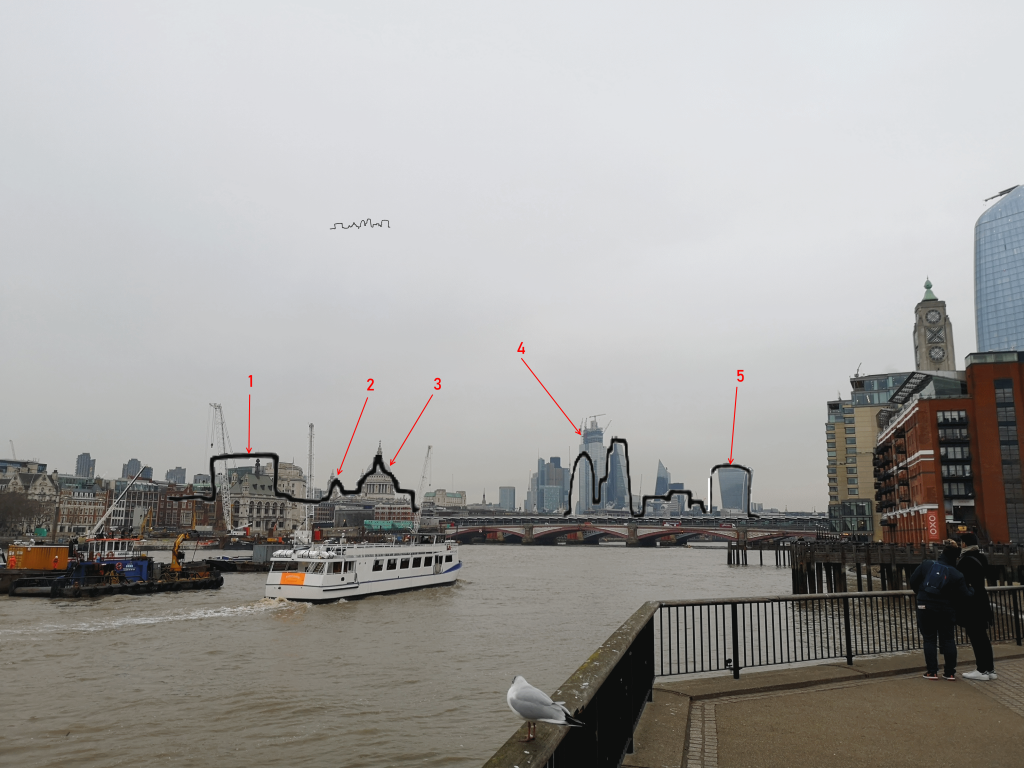
I could see that some of the features were close (the Gherkin is hidden behind another building), but St. Pauls and City Point appear way off. Of course I could cheat (see below) and tell you how it is all a lie, but that isn’t what you want to hear. You want to hear why the two don’t marry up, so I did some more investigation.
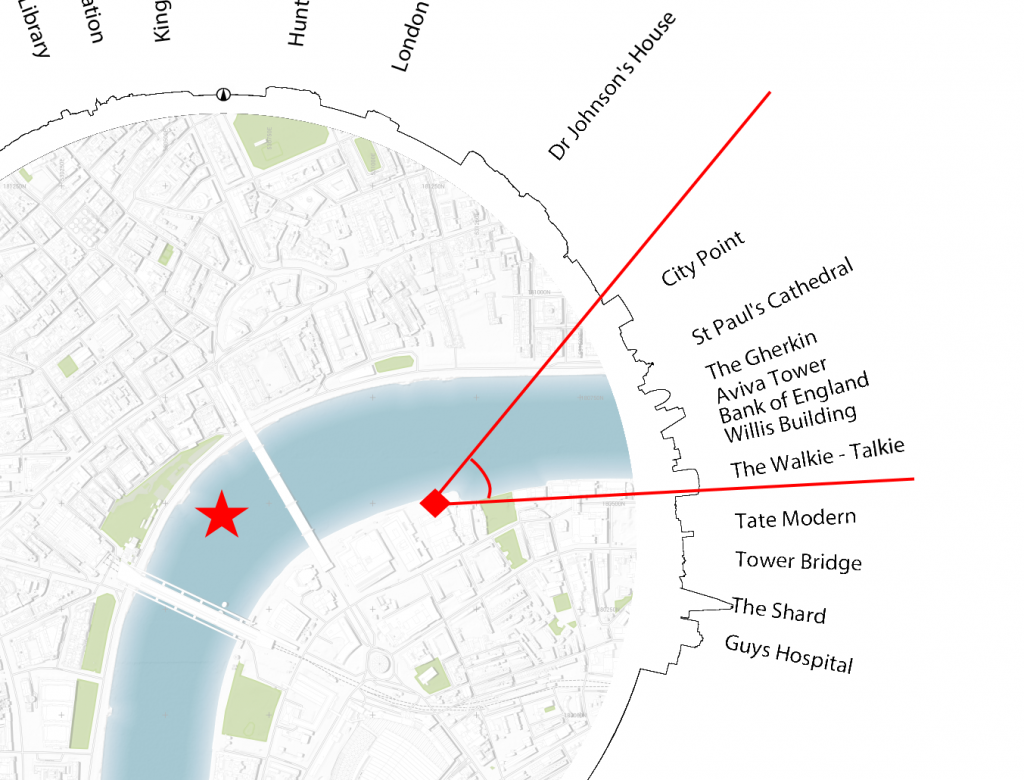
I looked to what I could use as a reference (seeing as another trip to London wasn’t possible) and came across good old Google Earth. After all, it has all the major 3D buildings and is relatively accurate geographically. So I placed the camera at the centre of the map and took a screenshot:
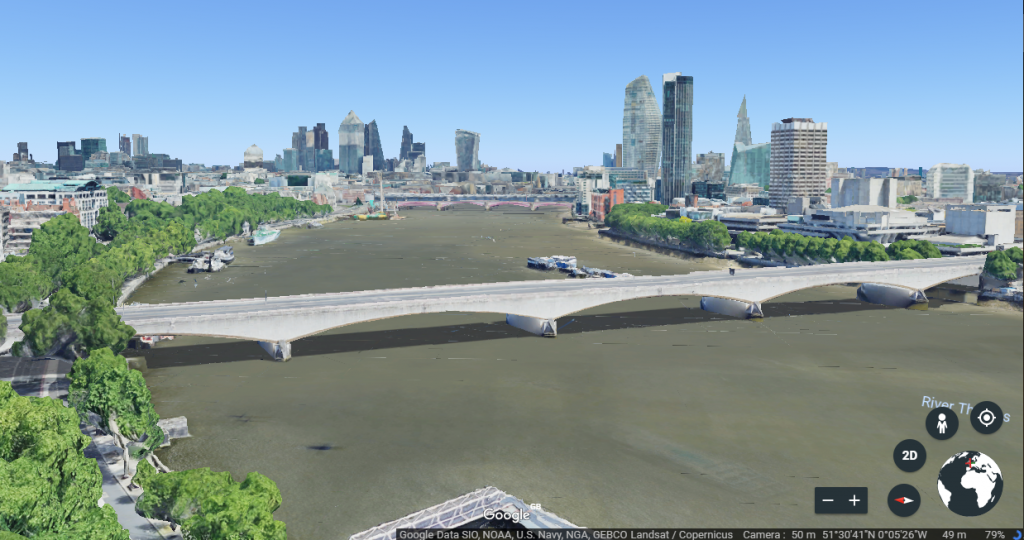
At a quick glance, this looked a lot more promising as you can see that the spacing between City Point and St. Paul’s is a lot better; also the spacing of the Walkie Talkie looks more correct.
Therefore, I took a the area defined between the two red lines earlier in the blog and, apart from colouring it red to make it more visible, I copied and pasted the outline using Paint.net (an open source imaging software).
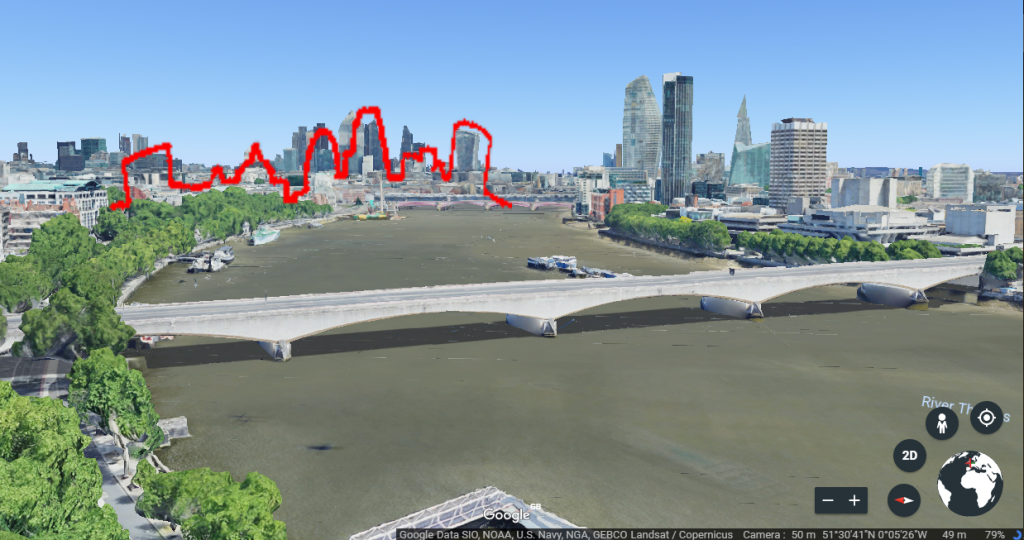
Although there is a bit of work to be done to correct the curvature (I tried but failed), the results are far more promising. The buildings appear in the correct location and the scale seems to be pretty accurate.
I think the only way to be 100% sure and to sign this off completely is to go on another trip to London and this time visit the correct map centre and do some work to straighten up that curvature without distorting the shapes too much.
I’ll be back in London for a few days in May this year. This is not the end!!