
Methodologies to Acquisition and Data Processing
Sponsored by GreenValley International
Routine inspection of power transmission lines is critical for securing uninterrupted distribution of electricity. Traditional, ground-based inspection methods involving teams of surveyors is typically very labor-intensive and time-consuming. Methods for calculating the distance between the sag of the transmission wire and the tree often involves heavy equipment such as height measuring rods and theodolites. This is a huge workload for patrolling personnel whom may be located in deep wilderness and/or hazardous terrain.
Recently, energy service providers have been turning to the sky in order to conduct their surveying and analysis. Largely automated UAV technology equipped with LiDAR hardware has emerged as an effective alternative method for inspecting energy corridors. Acquiring the point cloud data, however, is only a small fraction of the full solution. Generating meaningful geospatial outputs requires post-processing and analyzing the point cloud data. Processing large swathes of terrain results in hundreds of gigabytes of point cloud data and as such, it is important to design an intuitive and time-efficient processing workflow.
Through several surveying and analysis projects, we have been successful in creating an efficient workflow for many energy service companies (ESCOs). Recently, the Qingyuan Power Supply Bureau of Guangdong Province, China, utilized our workflow to carry out a risk assessment/management survey of more than 2,500 kilometers of transmission lines (751km 500 kV, 1,824km 220 kV & 4,717 towers).
Surveying
The site was located in Qingyuan, Guangdong Province, China. Surveying here typically takes place during Spring, when potentially hazardous vegetation such as bamboo and eucalyptus species grow most rapidly. A total of six teams of surveyors were deployed over a two-month period to complete the airborne survey, three-times faster than ground-based methods. Weather permitting, each team flew 4 – 5 flights along the corridor per day, not including preliminary flights for flight mission planning and tower height inspections. The hardware utilized included six GVI LiAir Standard 32e, a UAV-mounted LiDAR system with a ranging accuracy of ±2cm and effective acquisition distance of up to 100m. The payload was mounted to a DJI M600 Pro UAV which has a flight time of 20 minutes. To ensure flight safety, the flight paths were elevated 20m above the transmission towers and elevation change was often necessary considering varied height of the towers. It is also important to note that ‘Figure 8’ GPS calibration, flight trajectory and flight speed are all possible within the included GVI flight planning software, LiPlan. Furthermore, conversion and acquisition software, LiAcquire, allows for real-time display and conversion for raw LiDAR and POS data.
Also being utilized is LiGeoreference, a proprietary georeferencing software for aerial LiDAR datasets. Georeferencing involves combining the data from the inertial navigation system (INS) and the GPS to provide the accurate position information of the aircraft and the oblique distance measured by the laser pulse. The robustness of the three-dimensional coordinates weighs heavily on the overall accuracy of the data. Through proper georeferencing, positioning inaccuracies may be corrected (see Fg. 1 & 2).
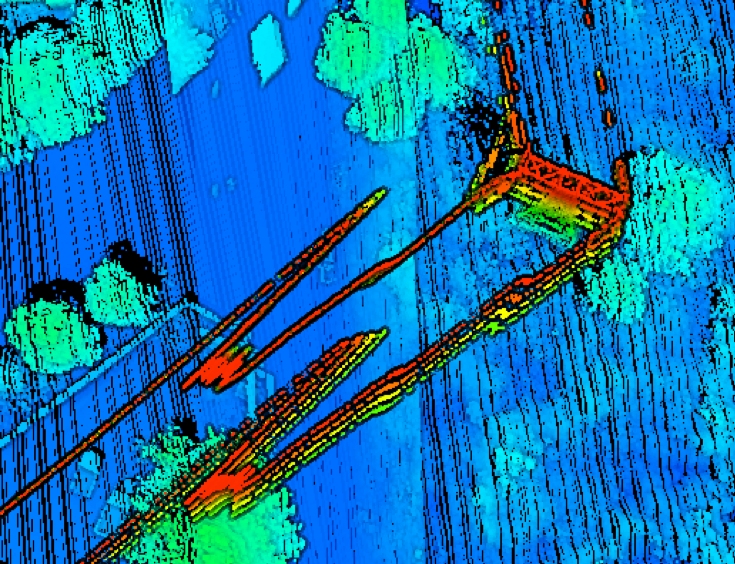
Fg 2
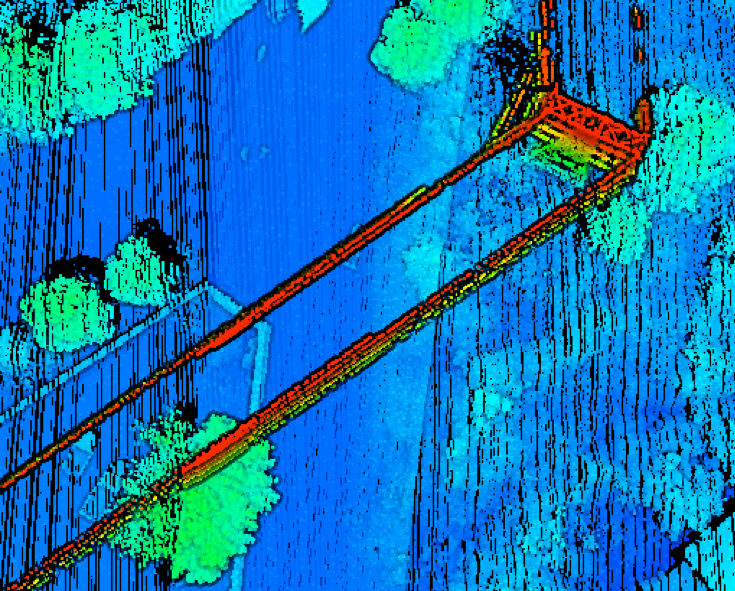
Fg 2. After being optimized using LiGeoreferenceFg 1. The influence of the pause of UAV on the POS measurements
“After setting the flight path in the system, the drone-mounted system can automatically capture real-time information such as line position and vegetation and greatly improve the inspection quality, whilst maintaining the safety of personnel.” – Wang Linsheng, Director of Qingyuan Power Supply Bureau and GreenValley customer
Post-Processing and Analysis
Following the acquisition phase, the point cloud data can then imported into post-processing software, LiDAR360. The software contains toolsets for efficiently viewing and manipulating point cloud data and offers modules for specific applications such as topographic modeling, forestry and in this case, power line analysis.
The Power Line module provides machine-learning algorithms for automatically classifying ground, transmission towers, power lines, buildings, and vegetation. It is possible to simulate the influence of environmental variabilities along the corridor. It can also detect a range of user-defined hazardous points, such as vegetation overgrowth and tree fall, after which will be included in a self-generated inspection report. The client defined the hazard threshold as seen below.
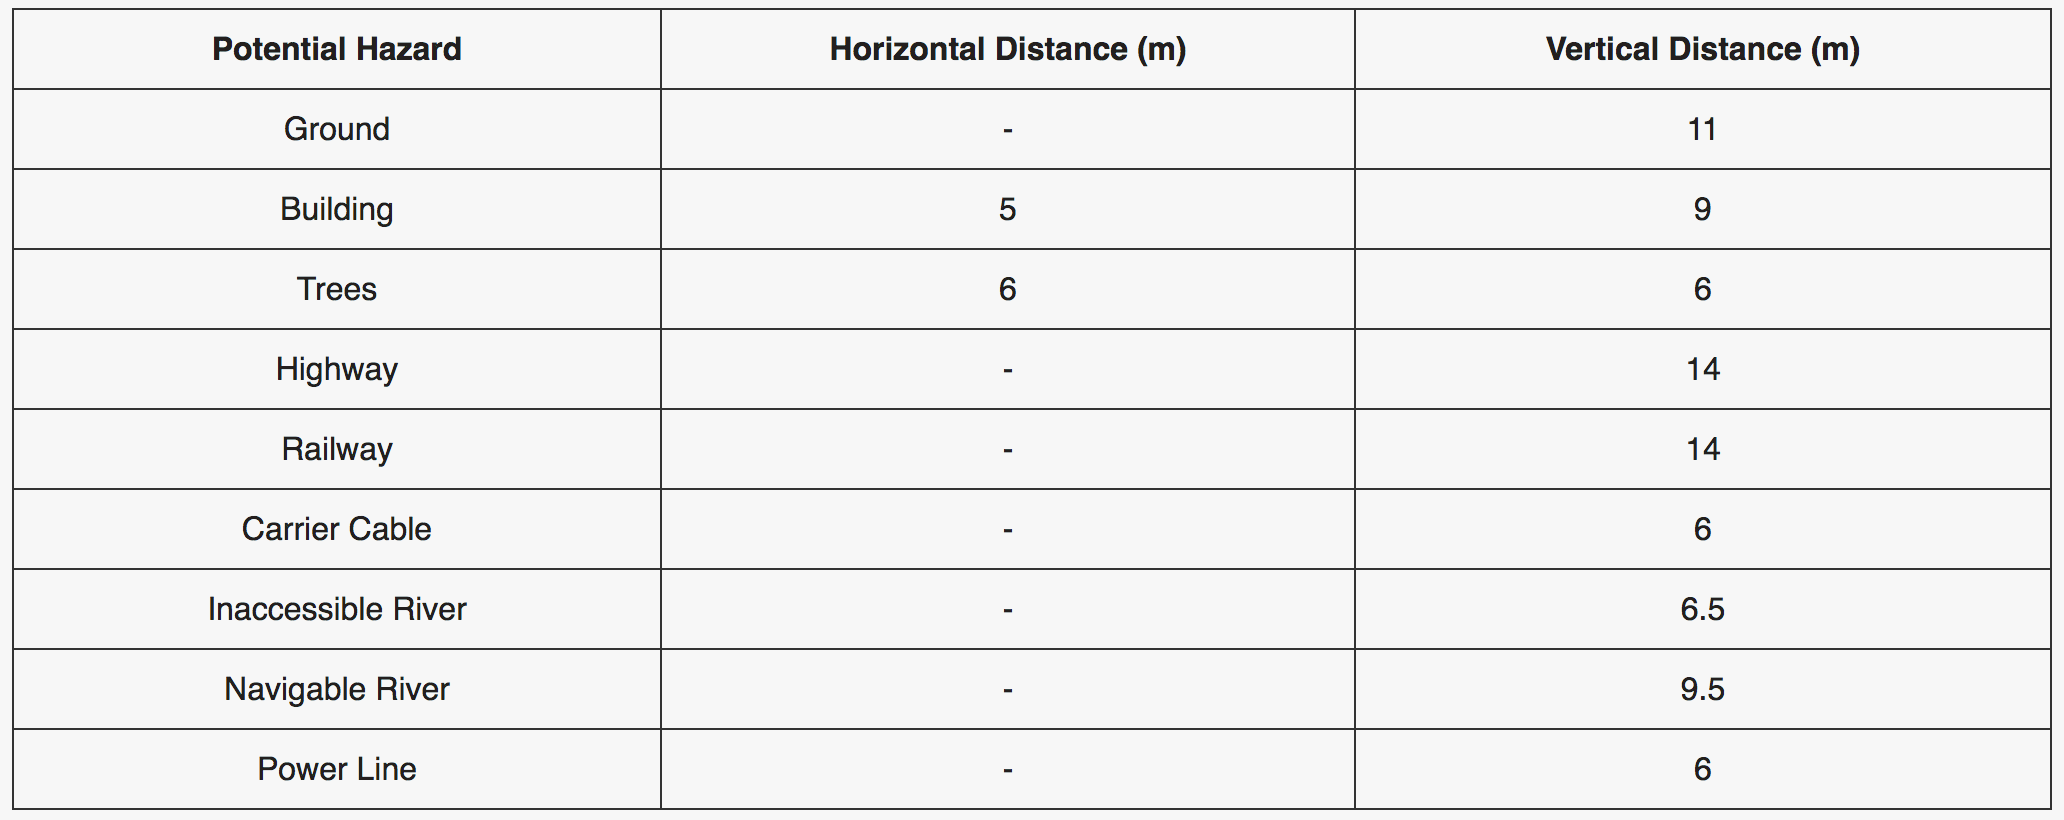
Fg 3. Hazardous point threshold defined by the user
The workflow for generating the aforementioned results firstly requires the user to determine the basic settings and detection parameter settings. Basic settings include working directory, target coordinate system and point cloud coordinate system. Detection parameter settings include category settings and voltage level settings. Once the parameters are set, the user may start tower editing. Functions are included for adding transmission towers sequentially.
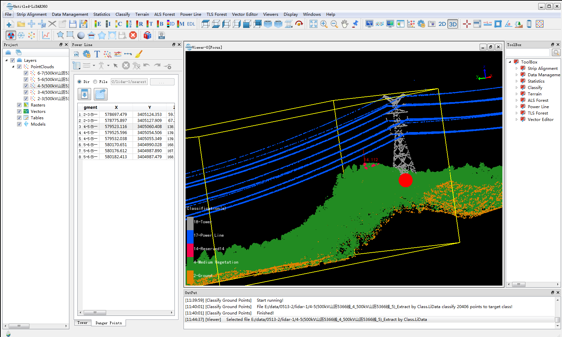
After editing the transmission towers, the file can then be saved. The next step is to generate a training dataset for automatically classifying power line, transmission tower, vegetation and other objects, if applicable. To do this, activate the Profile tool in order to select an area of interest and in the pop-up window, set the target class.
Fg 4. Editing tower along a stretch of the corridor
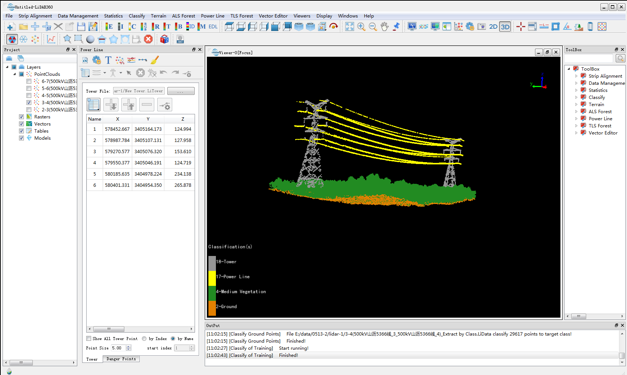
Fg 5. Classification results within LiDAR360
The selection tools within the Profile toolbar allow the user to set power line and tower target classes. As to the training samples of ground points and vegetation points, users can use the Classify Ground tool (previously used to generate training samples). After this, users may generate the training file. Accuracy will continue to improve based on the richness of the training datasets.
After collecting the training samples, the next step is to clip and classify point cloud data into tower, power line, ground points, noise and unclassified data according to the tower file and training samples. Here users can use different colors denoting features i.e. blue – towers, yellow – power line, red – outliers and green – mid-height vegetation.
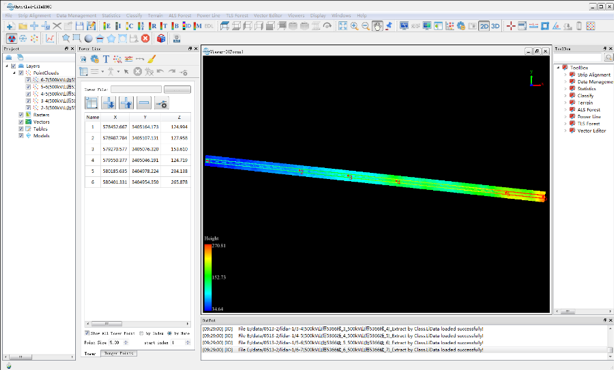
After processing, the Lidar data will be divided into several separate files, each of which represents the point cloud of a powerline segment (see Fg. 6). From here, users may further examine the results and manually correct the results if there are any errors.
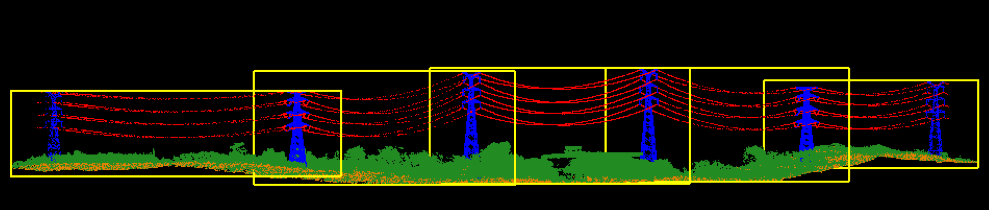
Fg 6. Segments of the training sample data
Report Generation
The final step is to automatically detect hazardous points and generate a user report in order to review and assess both the current clearance violations and simulate the imminent risks. From here, field teams can now clear hazardous areas more efficiently and effectively.
The parameters include:
1. Hazard Detection
Fg 7. Detecting hazardous points
Detecting clearance danger points according to the user-defined, ‘safe distance’ threshold. These include minimum distance, safe distance, cluster threshold and maximum cluster range.
Segmenting trees through spacing thresholds, height above ground and buffer size for expanding a buffer area around clustered danger points. On the right, each color represents an individual segmented tree after a growth rate simulation.
2. Tree Segmentation
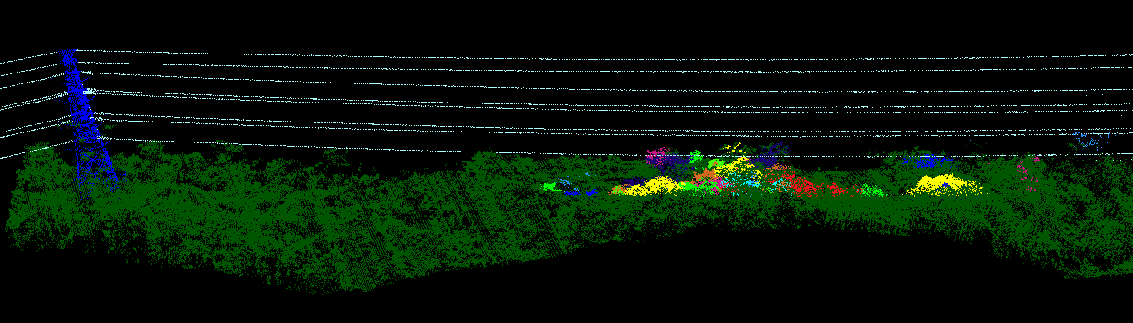
Fg 8. Individual Tree Segmentation
3. Simulated Conditions
The user can also generate reports which simulate power line sag under strenuous conditions such as strong side-wind, ice-coverage and high temperatures. This will allow surveyors to be aware of future threats and meet safety conditions without any unforeseen variables.
4. More Parameters
Tree Growth: Detecting hazardous points caused by tree growth. These include yearly growth, growth rate (meters/year) and growth rate for both bamboo and eucalyptus.
Render Image: Rendering images of both front and aerial views, in both width and height.
Generate Report: Reporting and analysis including details such as power line ID, voltage, point cloud coordinates and target coordinates.
Tree Fall: Detecting the location of hazardous area caused by falling trees.
Cross Powerline:Detecting intersecting power lines which includes the safety distance threshold.
Water: Detecting water bodies including the safety distance, density threshold and area threshold.
Results
Over the 2,500 kilometers corridor, this workflow was able to detect 40 hazardous points. The majority of hazardous points were due to overgrown vegetation or extreme transmission line sag. In Figure 11, we can see the vegetation hazardous point between tower 48 and 49 at 6.76m, 0.76m over the defined vertical distance threshold. Future simulated conditions allowed Qingyuan Power Supply Bureau to recognize how both strong side winds and high temperatures were affecting functionality and ultimately decreasing transmission efficiency. The speed at which surveying and analysis can be completed was also a major selling point for the ESCO.
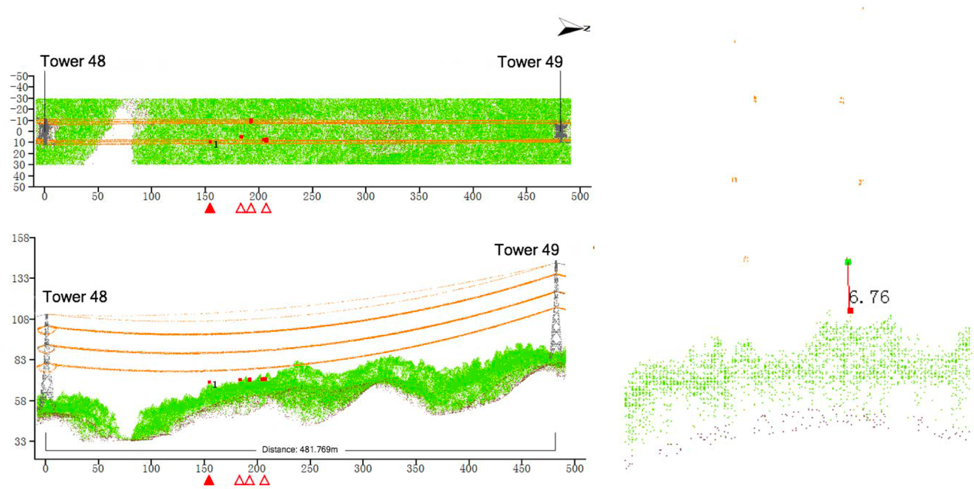
Fg 9. Generated project report containing a hazardous point
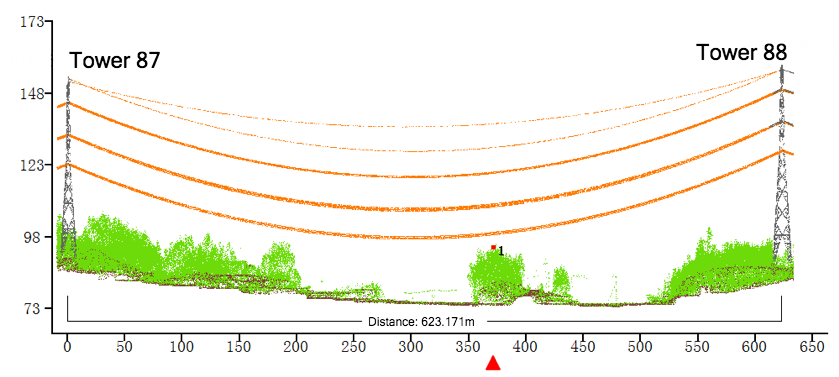
Fg 10. Generated project report containing a hazardous point