When I went into the office today, I had to write an amazing blog about the QGIS 2.5D functionality and how it was the beginning of QGIS’ journey into the 3rd dimension.
Only I can’t, because Anita Graser, the author of “Learning QGIS 2.0” and owner of the Free and open source ramblings blog beat me to it. I was not only beaten but she added a temporal element to it all. I can’t be upset; I have a lot of time and respect for Anita. In this case it worked in my favor: my competitiveness came out and I sat and thought of just how I was going to do something better.
First let’s discuss the “2.5” functionality: why haven’t you seen it and why is it gaining publicity?
The 2.5D rendering is a new function added to the styling options in QGIS 2.14, which will be released (approx.) March 25. This is available now, primarily for testing purposes through the QGIS 2.13 development release on OSGEO, so what you are reading might change further before release.
Last year Matthias Kuhn set up a crowdfunding campaign to provide oblique 3D rendering as an option to the QGIS output but most importantly to enable a way to print/output the result, as many of the plugins available in QGIS are just visualization tools. Little did Matthias realize how popular this idea was, and it was funded by November 30, 2015.
“This project aims to improve the internal possibilities of QGIS to give an oblique view 3D effect based on a height attribute and an angle while fully preserving all the possibilities which the QGIS styling offers. But it doesn’t stop there, the whole rendering is built in a modular way so you can use all of its parts for countless other possibilities.”
As stated earlier, it is still in a development test phase, but being QGIS it is still very stable. Oh yes, it is a fully functional death star. Let’s look at the process for using this function.
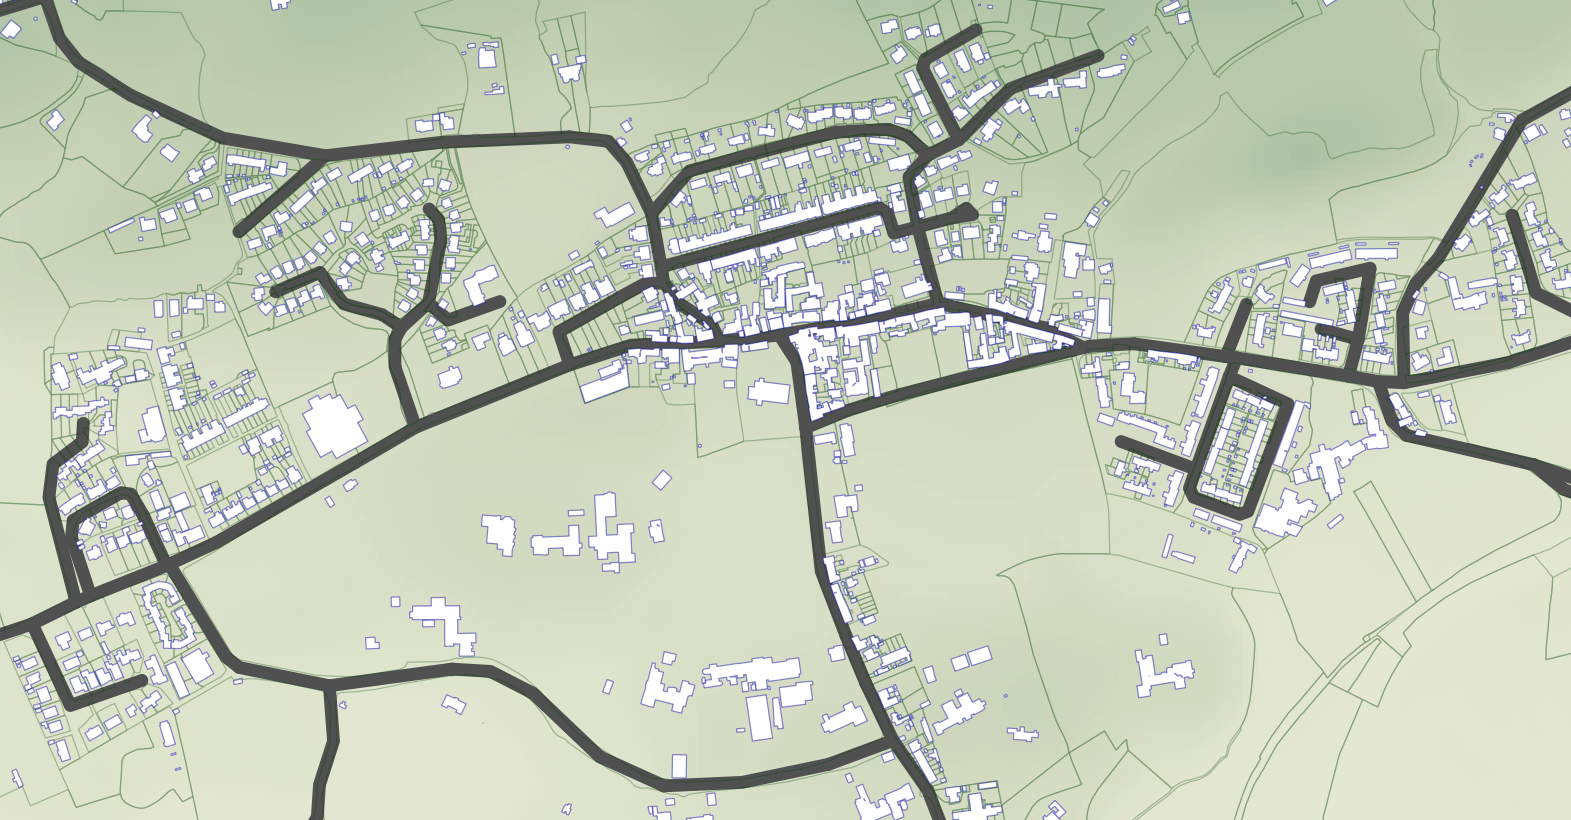
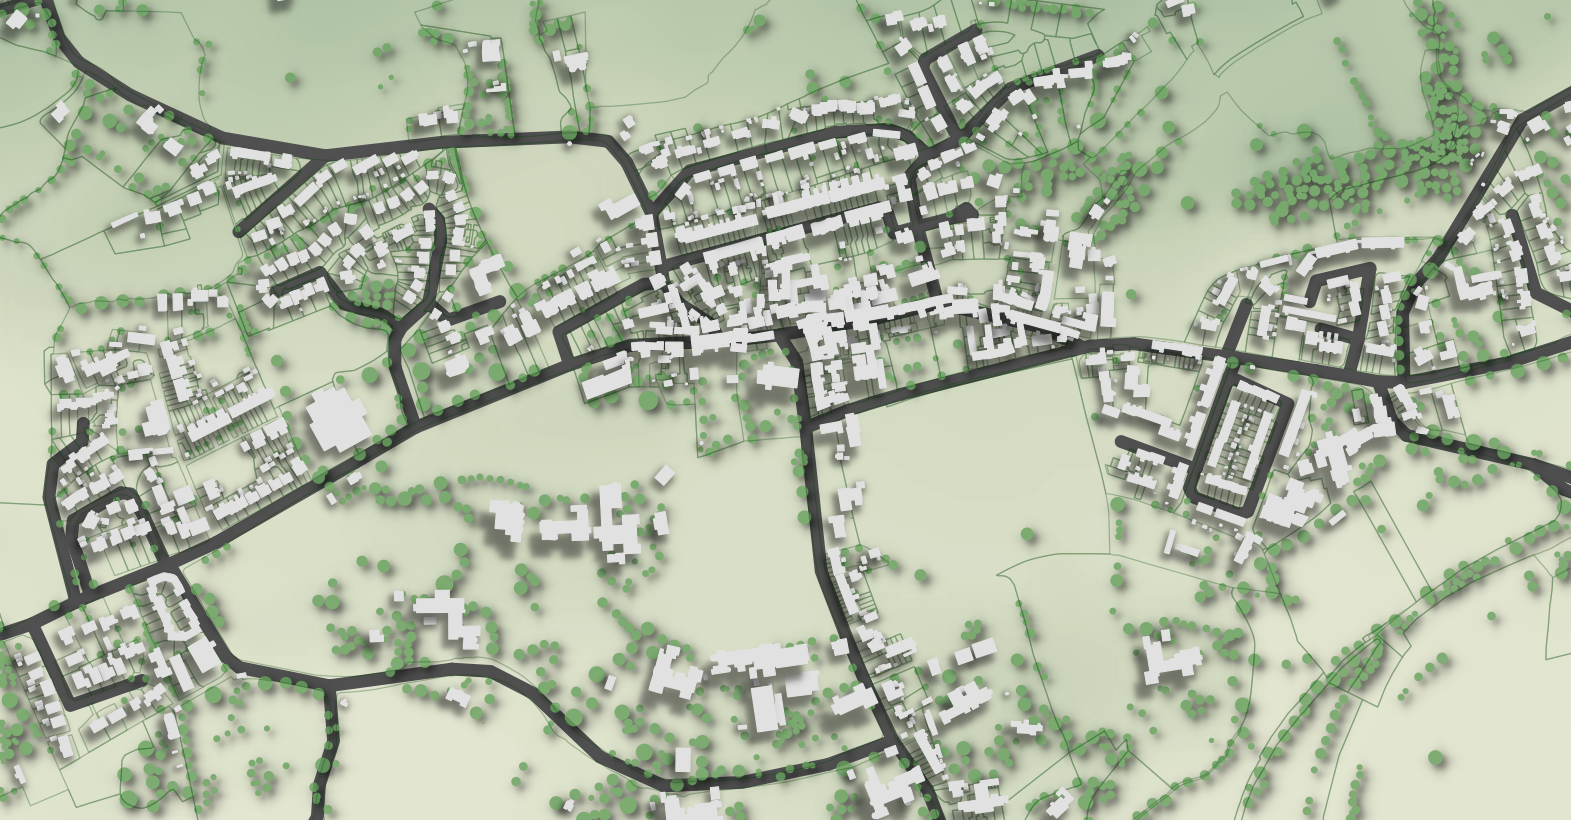
Buildings without the 2.5D effect applied
The standard interface we are all used to.
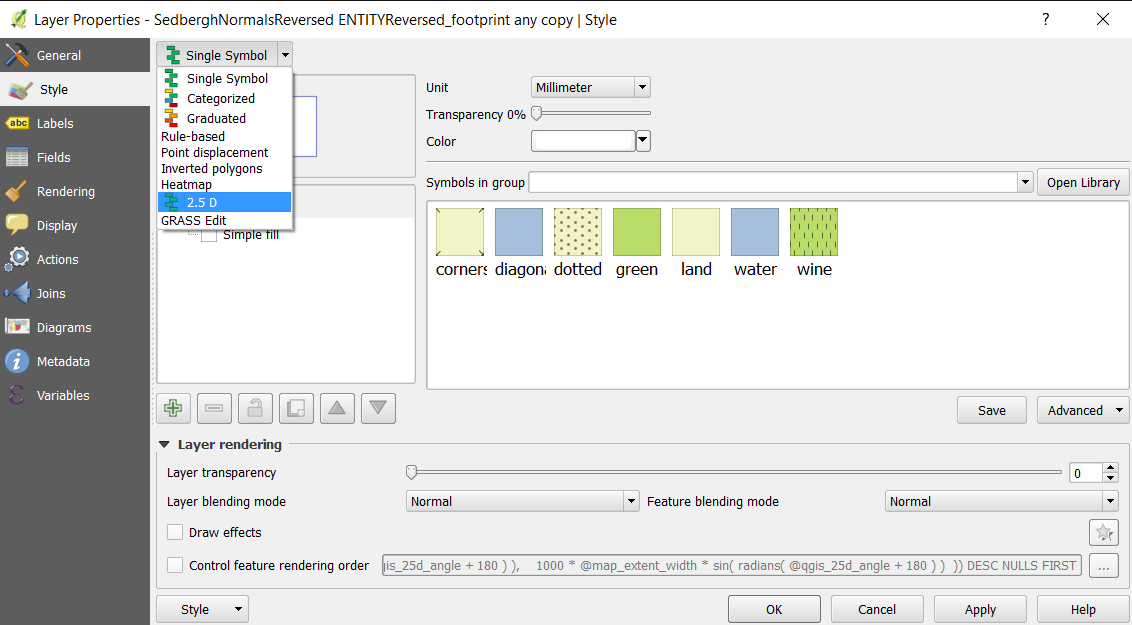
A look in the dropdown shows a new function – 2.5D rendering!
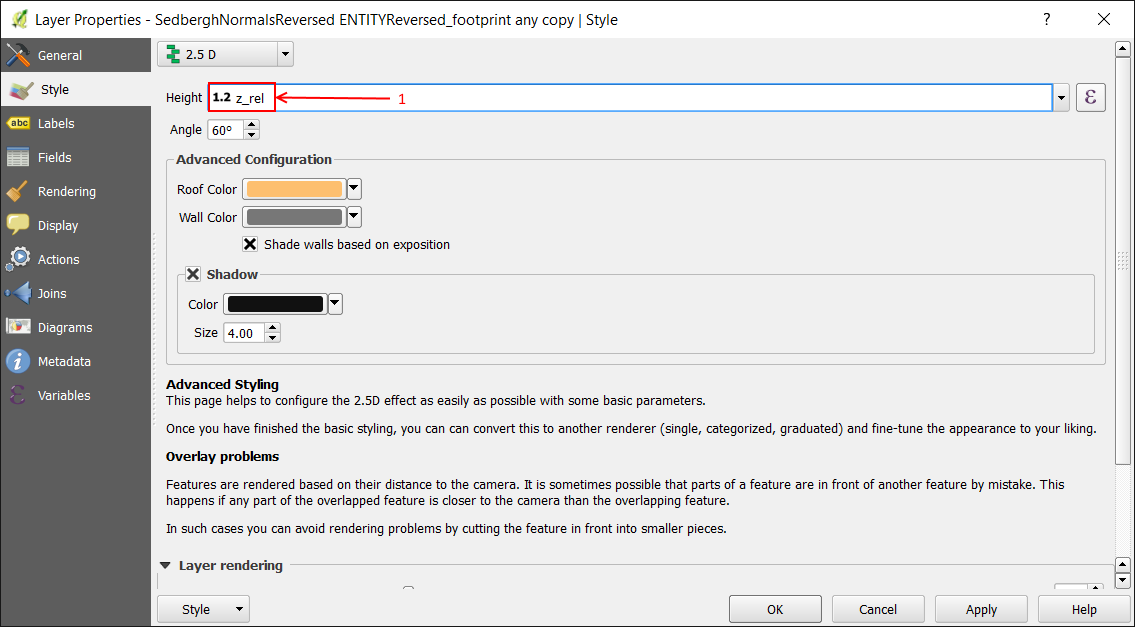
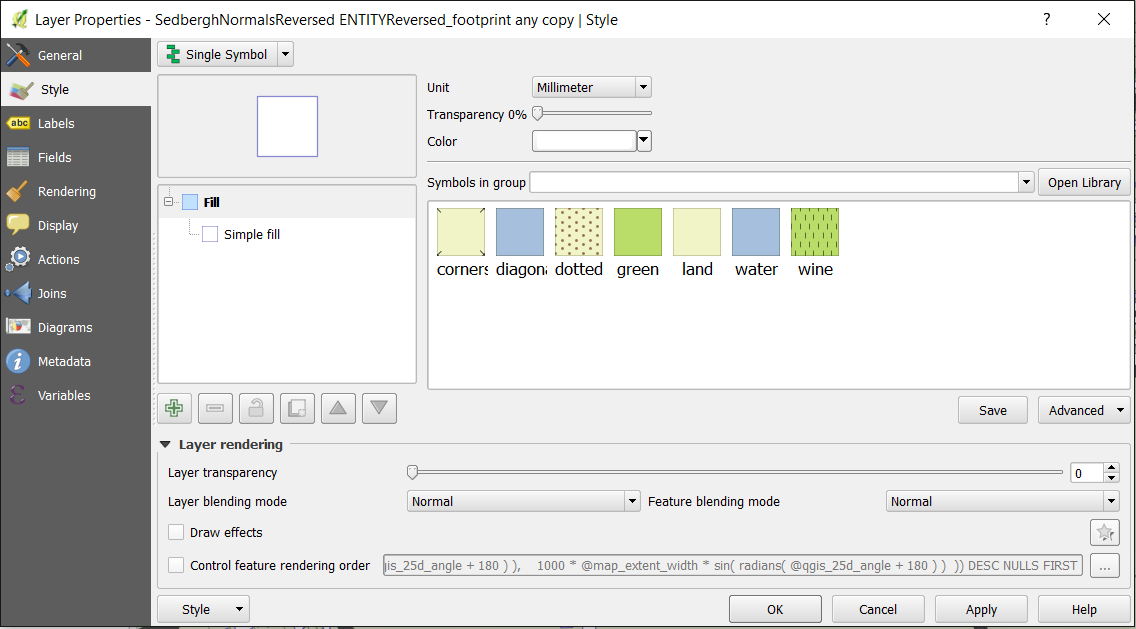
New options.
As you can see, there are a new interface and options when you select the 2.5D option.
Height of the “effect” is based on either a field in the attribution or a z (height) geometry. In this case [1] it is based on a field that I had to create based on the geometry called “z_rel” (short for relative z).
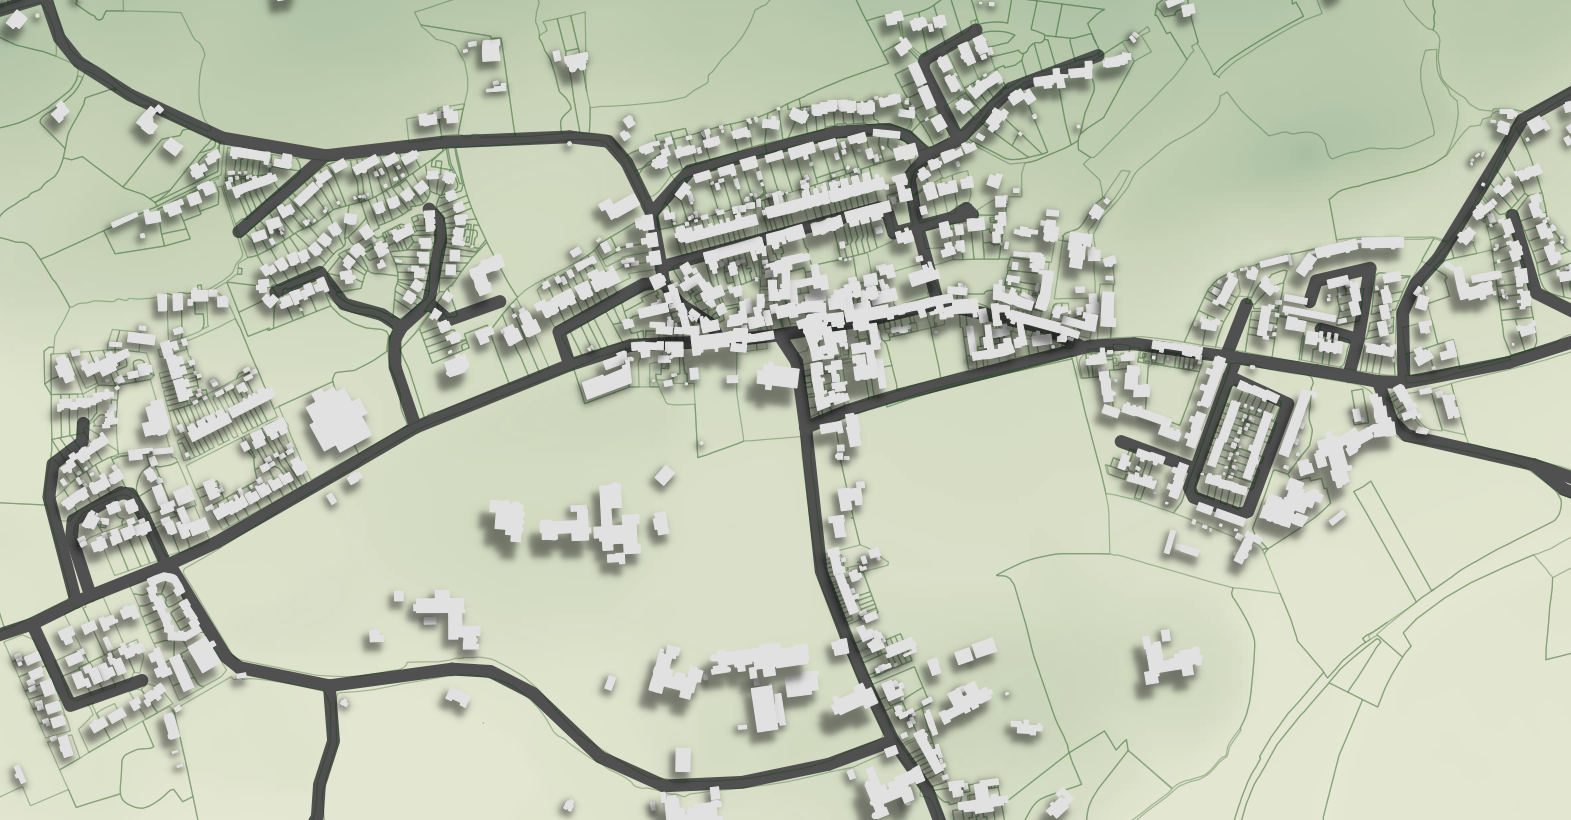
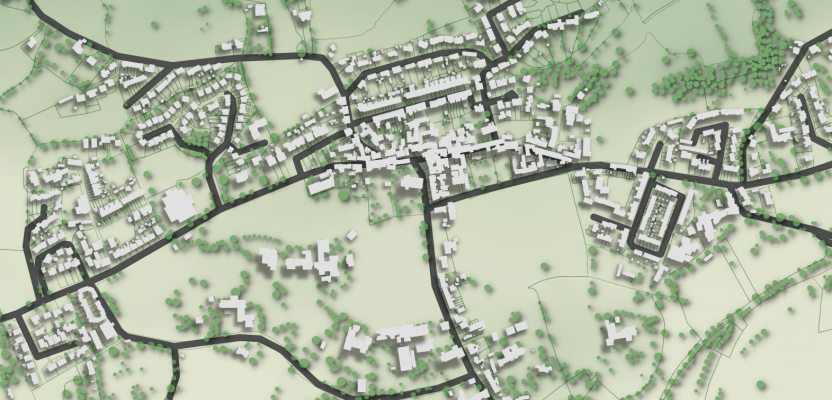
The end result of using 2.5D with the buildings.
Now, here is something interesting. I was using 3D data; in fact I was using 3D geospatial shapefiles in ArcGIS filegdb format with roof detail and even windows, but it wouldn’t work. Not because of anything major but because the plugin only supports simple extrusion, or simple z geometry (meaning no multipatch!). Once the z values for the buildings were extracted to a field and the footprints extracted from the multipatch data, the result was good, as you can see here.
We can add a little more detail by using trees. I first tried using the 2.5D render to display the trees and found that it would provide an “extrude effect” down the side of the tree.
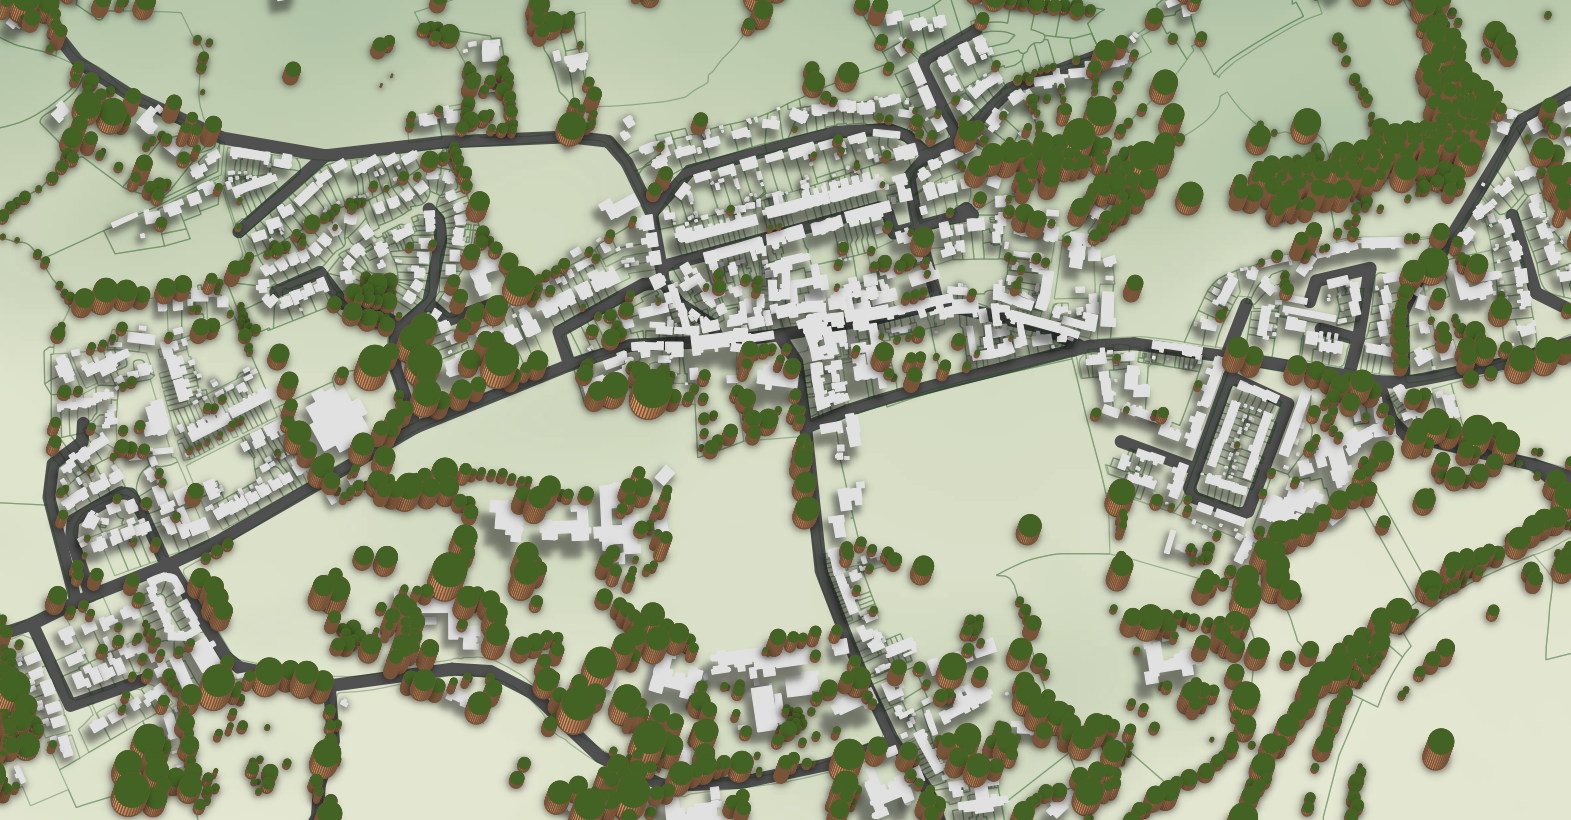
You can see the extrude effect on the side of the trees.
Trying to mask the effect
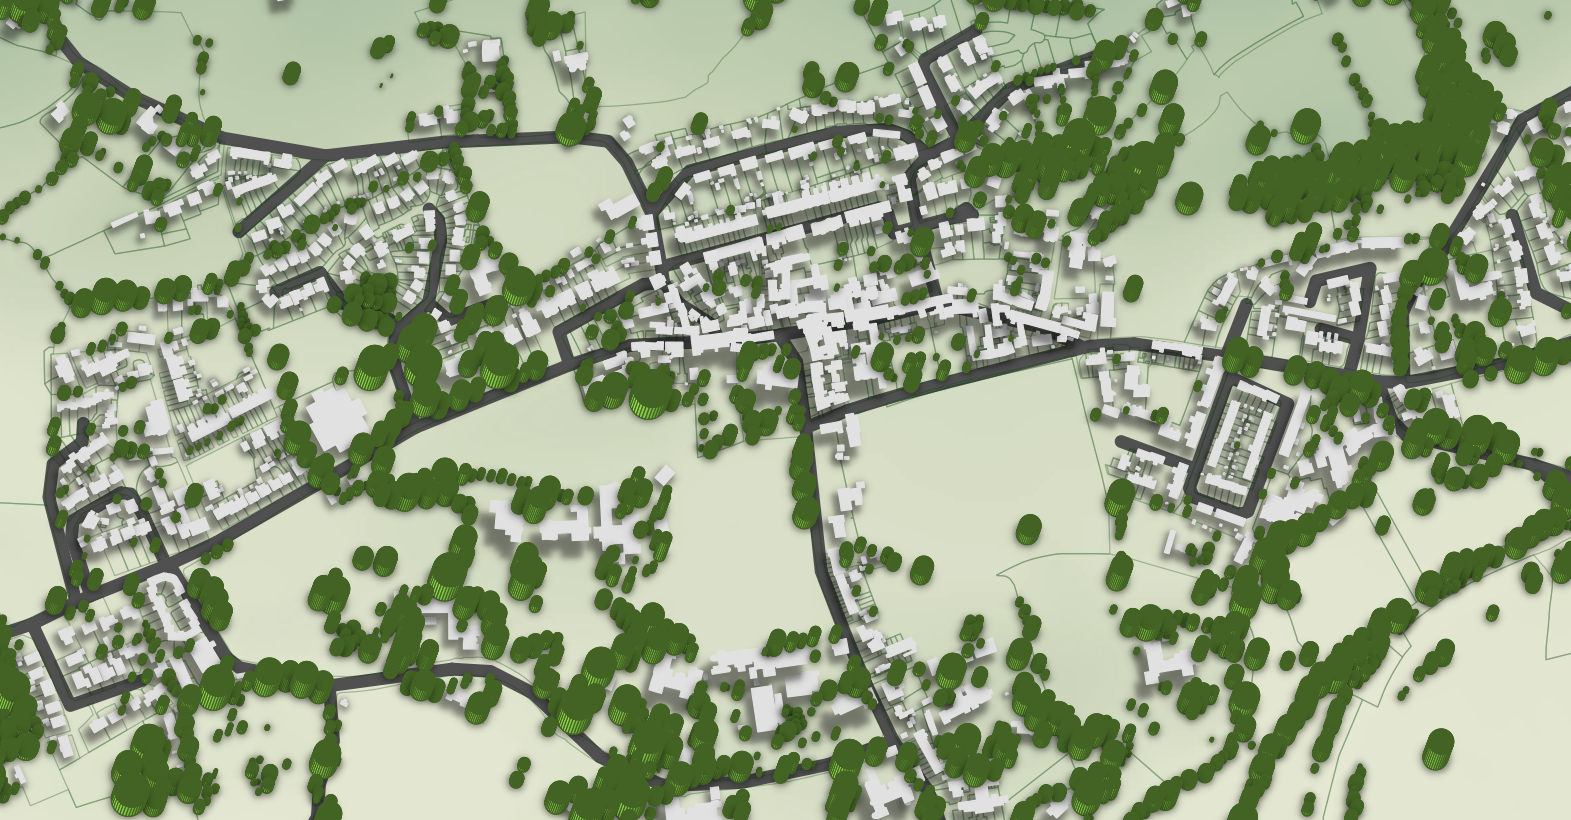
Final attempt with just shadow on the tree canopies.
Here you can see in the two images side by side that the trees look too heavy, whereas by taking the tree canopy and applying a simple shadow, it is easy to make the trees come to life. Note that there is no option to remove the extrusion effect or side of the isometric option (referred to as the wall color). If this were possible I believe a fairly realistic effect could be created as you could base the 2.5D on the height of the canopy and then add another vector data to simulate a trunk (or not, if it looks bad).
From a cartographic point of view, I think this effect works well, and with a little adjustment and refinement we could create some magical maps. My only question is that when we are trying to simulate 3D, why don’t we just draw 3D? After all, using exactly the same data I created the below using QGIS2Threejs, you can play with it yourself here.
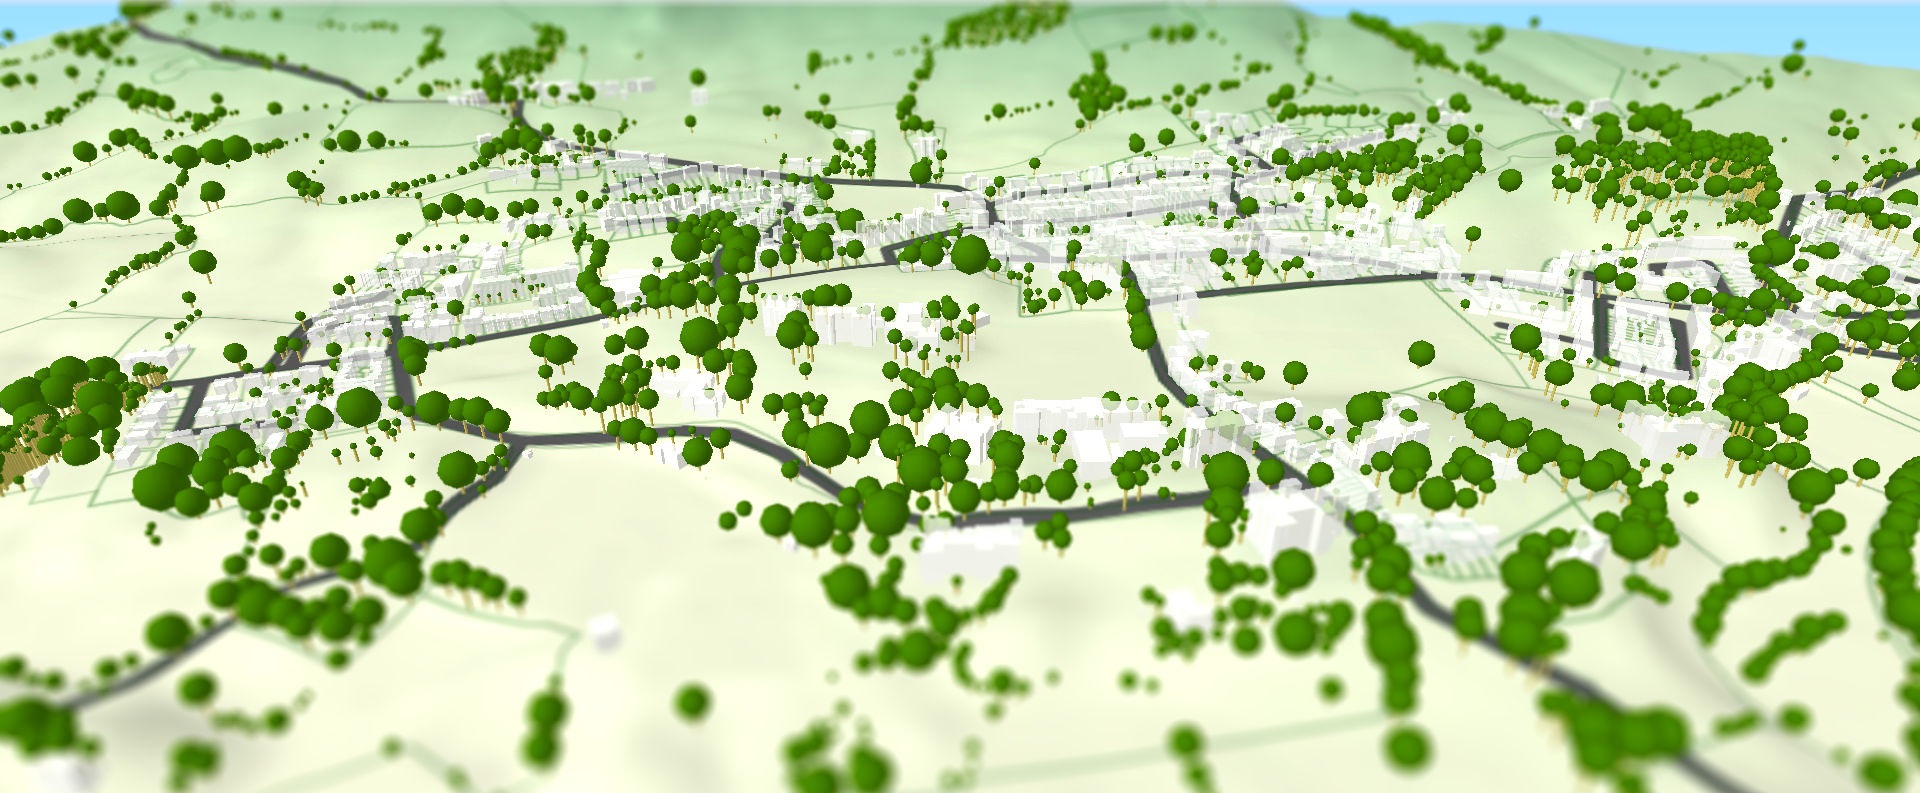
Using the same data.
One thing is for sure: I will be watching this closely and seeing what develops. I suggest you do the same!