Ever wonder who makes those maps you see in the newspaper? Ben has made maps for the Telegraph, the Guardian, and BBC News, and best of all (to me) he’s from the UK!
Ben is like a ninja—not many people know about him but those that do are avid fans of his work. It was some of these people who pushed for me to interview Ben, and I was glad I did.
Nick Duggan: What is your role at Esri?
Ben Flanagan: I joined Esri UK around four years ago as a cartographer, with no formal qualifications in the subject—you could call me a fraud! I’d fallen into GIS at university whilst studying geography and became fascinated with its potential. I’d previously studied graphic design and fine art, so when an opportunity came up which married my two passions, it was a no brainer.
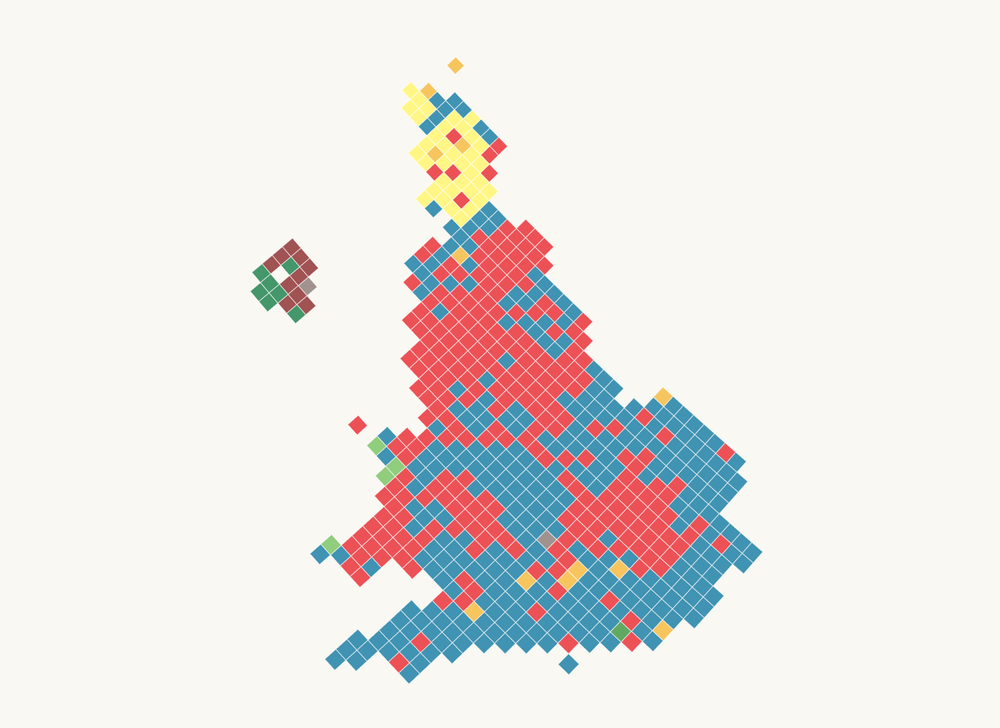
My initial role focused on creating interesting maps and data visualizations for the British media. I’ve been involved in some pretty cool projects, such as the Brexit referendum and the 2017 UK General Election where I worked closely with The Times of London to develop their election maps.
More recently, I’ve become involved in other projects across the business so am less involved with our public-facing maps than I used to be. This means that most of the maps I now create are done in my spare time for fun.
I do miss being regularly hands-on with the map-design process. However, I don’t miss pulling all-nighters to make sure live election maps don’t fall over!
ND: What do you find inspires you for making your maps?
BF: I would definitely say the work of other cartographers and data vis practitioners. I’ve found social media (particularly twitter) to be a great place to build a data vis network.
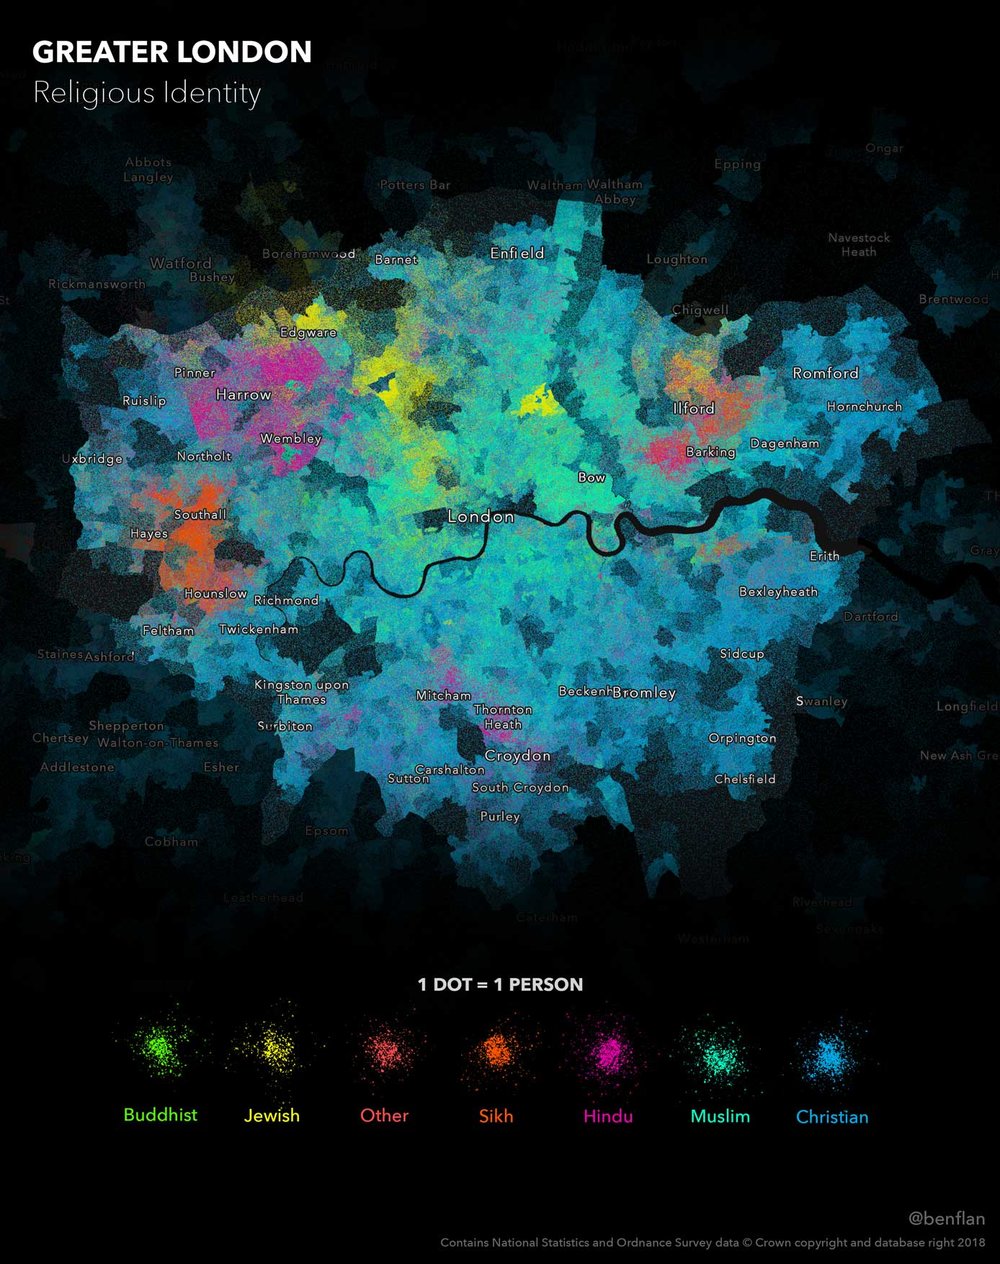
For example, earlier this year I saw Ken Field and John Nelson [both Esri colleagues] create maps using the new Dot Density capability in ArcGIS Pro. Not wanting to be left out, I knew I had to give this tool a try! I threw some data at it, and that’s where the idea for my recent Religious Identity map was born.
ND: Social media has been really, really helpful to the cartographic and geospatial community. Already it has pushed things so people can see what they can do instantly.
BF: Yes exactly. It’s a great place to boast about your work but also to get valuable feedback—which can be hard to take sometimes! It may be too late to change your current design, but it’s really useful to hear what others have to say and ideas they may have. These can then be banked for future maps!
It’s also interesting to observe what becomes popular on social media. Often, I will spend a long time crafting a map, only to share it and get little response. Then I’ll share something that’s half baked, and it blows up, and I’m kicking myself as I know I could have made it better. I guess there’s something in that.
I’d encourage anyone starting out in cartography, data vis or GIS, to head over to twitter to start building a social network. It’s really helped me to develop and improve my work.
ND: if you couldn’t make maps, what would you do?
BF: Interesting. When I was younger, whilst most of my mates were dreaming of playing football for Manchester United, I wanted to be a landscape architect. As kids, we were always encouraged to be outdoors, and my parents enjoy gardening, so I guess that’s where it started. I even got my own greenhouse for my 16th birthday!
I did end up designing a garden for my parents’ friends, which to my surprise they liked and actually paid to be built —crazy right?
I guess there’s a lot of crossover with maps: picking the right colors, textures, visual hierarchy, and structure. They are also both processes where the outcomes are tangible and live on.
ND: Do you have a map of your garden?
BF: Unfortunately, I currently live in a first-floor flat [basement apartment] so gardening is difficult!
ND: Whom do you make maps for?
BF: Good question—it depends. I sometimes help Esri users with their maps, so in this situation I’m obviously making the maps for them. When it’s for my blog, I guess it’s for myself as I’m testing my ability and experimenting with new techniques. There is something fairly rewarding about the whole process.
ND: What are you working on at present?
BF: There are a few maps currently in play, although the most interesting thing I’m working on is a blog post featuring some of the maps I have come across in television and movies—the “cartography of Netflix” if you like. I feel that these maps, often created by people who wouldn’t identify as cartographers, are poorly documented if at all. Maps created for web and print are widely circulated and accessible, so why not those on screen? The blog I’m writing will feature several maps from different series, but hopefully this will inspire people to start sharing maps they see on TV, too.
ND: Are there any maps that you’d like to do? Something you haven’t done yet?
BF: I’d like to play with the new Equal Earth Projection and design a political world map to hang in my living room. Nothing revolutionary, and visitors probably wouldn’t even notice that I’d made it, let alone that it was using the Equal Earth Projection! I just enjoy the process of creating things, and having one of your own maps hanging in your home seems pretty cool to me.
ND: Awesome. Thank you very much.
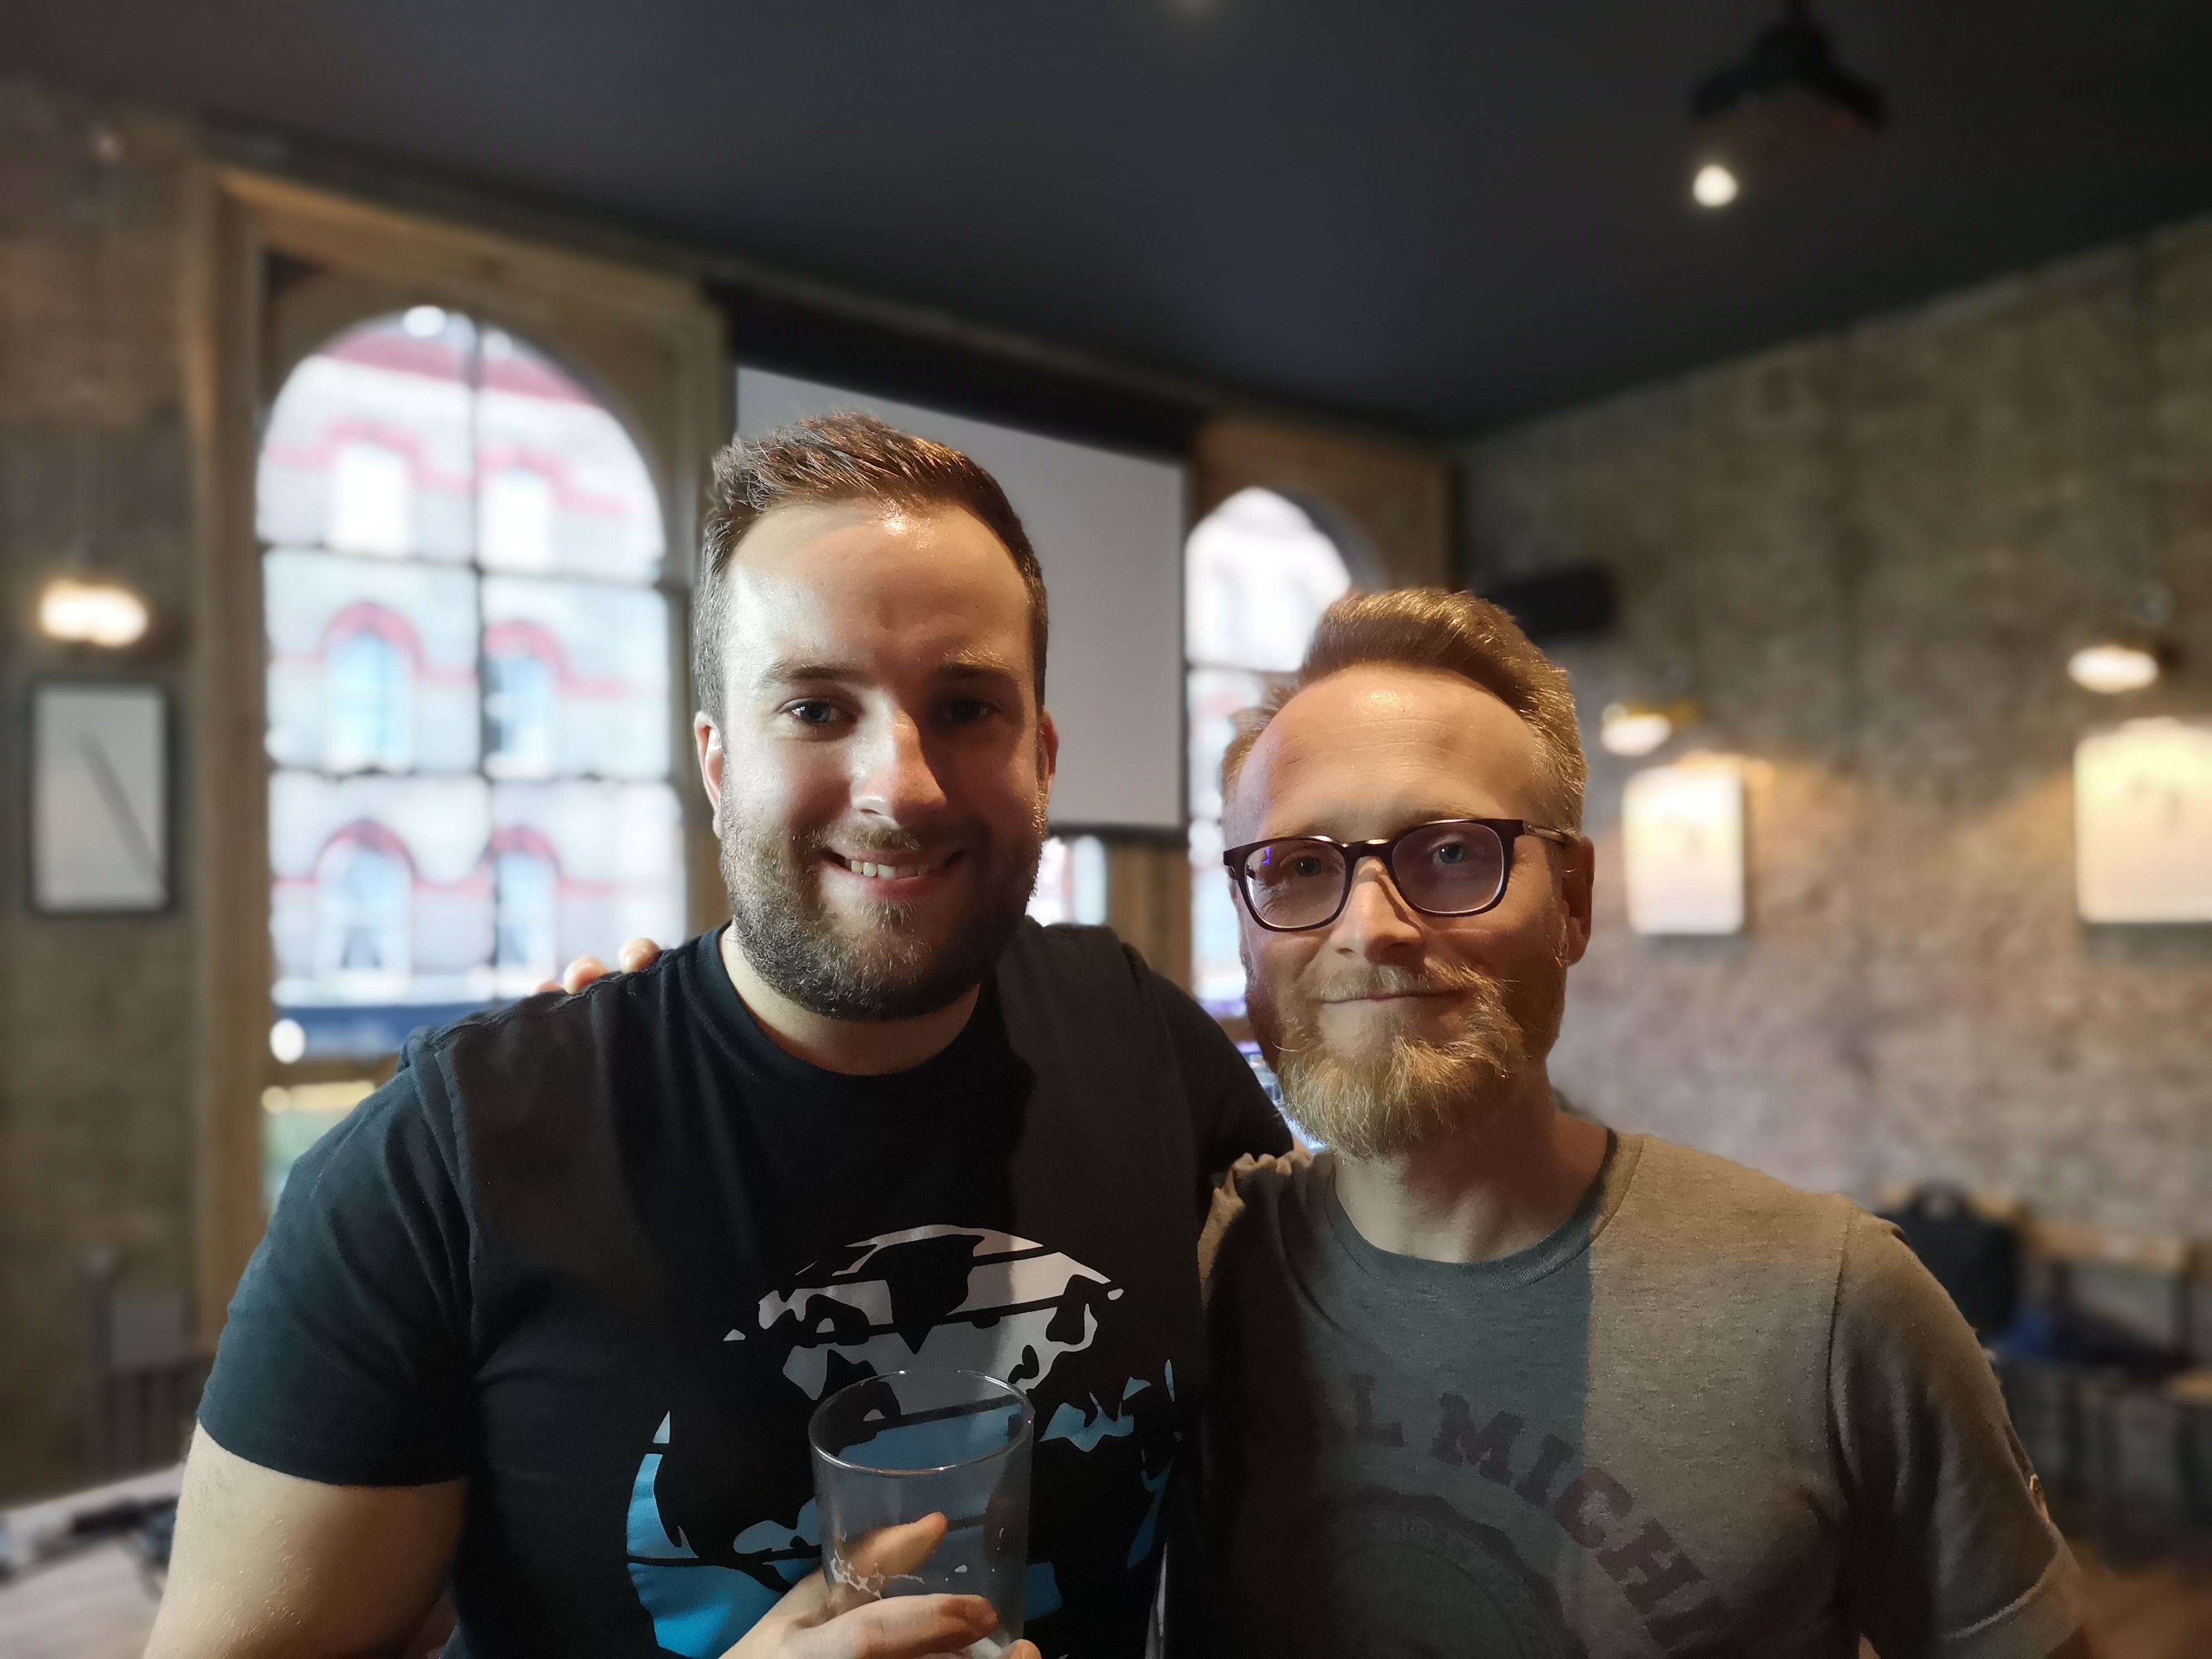
Ben Flanagan with John Nelson