With help from GIS, these five megacities are future-proofing their water infrastructures so that sufficient water supply will no longer be a pipe dream.
Megacities are a thirsty lot. These large and overpopulated metropolises have greater than 10 million inhabitants who consume more water than what their reservoirs can supply. Water shortages are commonplace, and city dwellers often blame their woes to long drought spells that lead to dry rivers, parched lakes, and empty aquifers.
But too much water can also affect supplies. Strong floods can damage pipes and cause major leakages. And when storm runoff mixes with sewage, potable water sources can be contaminated rendering them undrinkable.
Yet there’s another important factor that leaves megacities high and dry: their aging water infrastructures. Buried underneath the ground, the state of pipes and sewer tubes can be out of sight for most of us, yet it’s never out of mind for city managers. High water loss due to leakage, faulty metering, and even water theft, are alarmingly prevalent in these outsized urban areas, causing lost revenues for utility companies and higher water bills for customers.
In many U.S. cities, the estimated average age of pipes is 45 years. While in several European and Asian ones, most pipes have been in service for almost a century. These old networks of tubes are surely not designed to meet the demands of millions of water users. The bad news is that additional water needs to be conveyed down these aging pipes soon because according to the United Nations there will be more than 40 megacities by the end of this decade.
Nonetheless, there is still something to cheer about. Many megacities are now upgrading their water infrastructures through the innovative use of geographic information systems (GIS). The pairing of GIS with existing smart technologies supports water utility managers in tasks from monitoring reservoirs to real-time pipeline management. Here are five megacities that are turning the tide toward water sufficiency:
Los Angeles: Streamlining operations
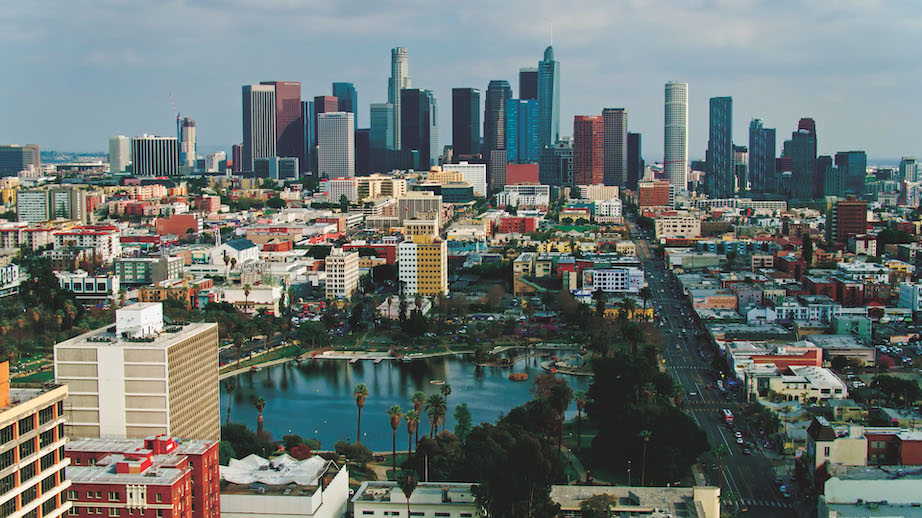
Aerial view of Los Angeles looking toward the downtown skyline.
West Coast cities in the U.S. have been plagued with record-breaking droughts for two decades now, with each year drier than the previous ones. And nowhere is the water crisis more evident than in the area of Greater Los Angeles (population 18 million). At the height of the dry season last year, a drought emergency was declared by Gov. Gavin Newsom, pleading its citizens to reduce their water use.
Because Los Angeles imports 60 to 90 percent of its water supply from outside its boundaries, the city has been looking for sensible ways to use its remaining groundwater sources while simultaneously relying on water recycling efforts.
For example, Los Angeles County passed the Safe Clean Water Program in 2018 to fund projects that will enhance the capture and re-use of storm water. At the heart of this program is an interactive GIS mapping dashboard that can help citizens locate areas with open spaces and create green projects in them to harvest rain.
This is not the first time that Angelenos have turned to geospatial tech to support their water assets. In the 2000s, the Los Angeles Department of Water and Power (LADWP), the nation’s largest municipal utility, started to digitize the maps of its water infrastructures using GIS. This legacy electronic mapping database is now the backbone of LADWP’s quick response system to stop water leaks and outages.
By integrating a network incident and event management software with digital maps, LADWP now operates a centralized GIS-based mapping solution that can pinpoint water leakages so that teams can be immediately sent to repair them. Thanks to this seamless web mapping system, the utility company’s average leak rate is now 20 percent lower than the U.S. average. And, in this seemingly unquenchable megacity, that’s already a good number.
São Paulo: IoT means fewer IOUs
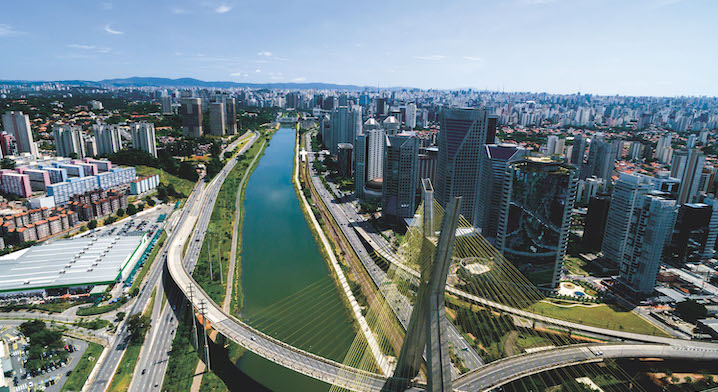
Aerial view of the most famous bridge in Sao Paulo, Brazil
Think of Brazil and images of refreshing beach water holidays come to mind. But not in metropolitan São Paulo (population 23 million), the economic powerhouse of South America and the country’s most populated city. There, its citizens are constantly thinking about a different type of water, the one that they can actually drink.
During the water crisis of 2014 that struck the city, taps ran so dry that schools and shops had to close, while fears of water rationing loomed over households. People still talk about it, and although they say that droughts were to blame, the city’s inadequate infrastructure and flawed urban planning also contributed to the shortage of drinking water.
To help solve the crisis, the Sanitation Company of the State of São Paulo (SABESP), the agency responsible for operating most of the region’s water system, relied on GIS for solutions. By combining the GIS maps of the São Paulo water network with a powerful hydraulic model, they were able to determine the best scenarios for increasing water supplies with the lowest operational risks. And by further linking this geo-referenced hydro model to the existing water monitoring and plant information systems from its reservoirs, the company was able to quickly manage the problem and avoided the much-feared water rationing.
Soon after the crisis, SABESP went on an upgrading spree. Not only did it invest on installing new water and sewage pipes, but SABESP also modernized its GIS resources. SABESP’s GIS mobile mapping solution, for example, now covers the entire water network of the city, allowing the company to quickly dispatch and monitor its teams in the field for repairs. And by using Internet-connected tablets, workers can also access their job orders, as well as view and update the same water network map.
The improvement of São Paulo’s water network still continues. Since 2020, SABESP has been using a combination of GIS web mapping, Internet-of-Things (IoT) sensors, and open-source technology to measure and analyze water consumption in real-time and ultimately help reduce water costs. SABESP has even turned to artificial intelligence to help predict leakage. The incident of water shortages has now decreased from 14 percent in 2015 to five percent, showing that these groundwork improvements are helping the Brazilian megacity get out of troubled waters.
Dhaka: Thirsty for smart solutions
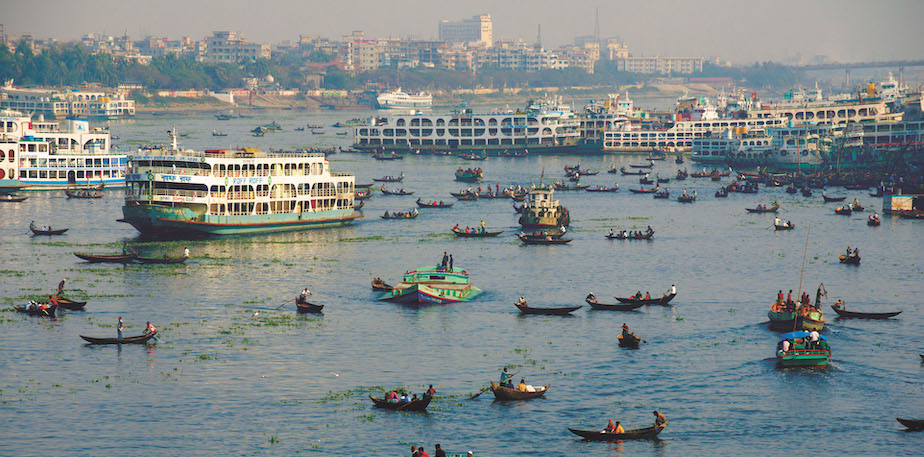
Commuters cross the Buriganga River by boats in Dhaka, Bangladesh.
In this densely populated capital of Bangladesh, access to drinking water is a daily challenge. But compared to drier cities, the water crisis in Dhaka (population 21 million) is caused by having too much of this vital resource.
Flooding is part of life here. Its yearly average rainfall of 1,875 mm (73.8 inches) drenches the city for 136 days, leaving the rivers and canals of Dhaka swollen with floods during the monsoon season. Floods can cause not just transportation problems, but they can also adversely affect the quality of water supply by contaminating it with sewage. Sadly, the city’s water bodies remain stagnant for most of the year because the natural drainage system has been clogged by decades of urbanization and population growth.
To solve the city’s flooding problems, the public water agency Dhaka Water and Sewerage Authority (DWASA), started a 10-year dredging program in 2014 with the goal of cleaning all the canals of the city. Essential to this program is the use of a dynamic web-based GIS tool that not only stores data about the drainage system of Dhaka, but it also contains important modules that can help managers compute the amount of material that can be dredged out of the canals and monitor the work remotely. All this can be operated within a GIS mapping dashboard to help engineers plan for upcoming dredging operations. Several rivers and canals are now cleaner and navigable as a result of this GIS project.
What’s more, Dhaka will start installing smart meters so that household water consumption can be correctly measured and fair revenues can be collected from customers. The location of the smart meters will be logged using GPS with a view to map the entire water utilities network in GIS. A pilot project begins this year.
Mumbai: Testing twin technology
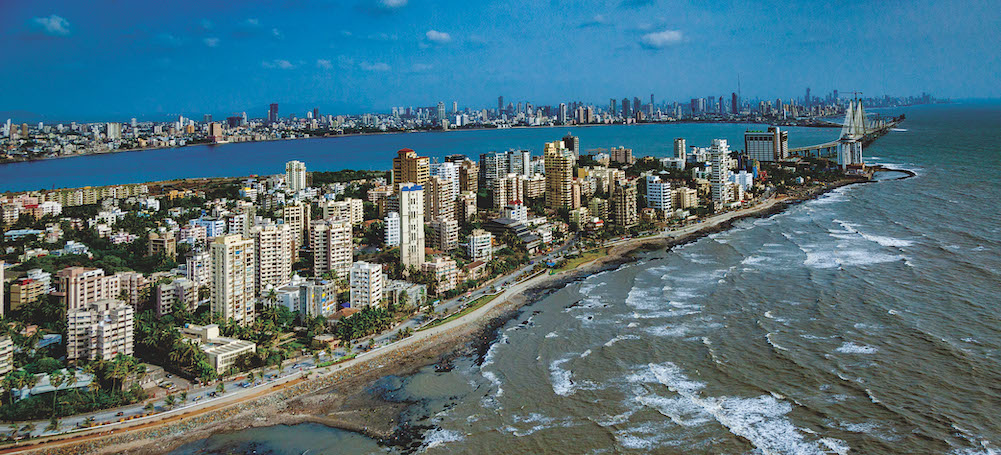
Aerial view of Mumbai Coastline from helicopter
It’s easier to trace the history of India in the centuries-old city of Mumbai (population 18 million)than to track down the city’s own underground network of water and sewage pipes.
For decades, Mumbai’s lack of maps that can provide the exact location of the city’s subterranean utilities system has resulted in frequently damaged pipelines during road works and maintenance operations. Mapping the placement of pipes will greatly avoid accidental ruptures to the system and save the city from wasting water.
To do just that, the Brihanmumbai Municipal Corporation (BMC), the agency that manages the city’s utilities, launched a project in 2016 to digitally map and geo-reference all of the city’s pipelines. Once fully finished, the project will help reduce the estimated 700 million liters of water that are lost to leakage and theft.
This mapping project is part of Mumbai’s long engagement with GIS. Since 2009, the BMC has been continuously mapping and digitizing its assets, from its roads to its land cover. The digital maps are now freely available to the public via a dedicated geospatial web portal.
More recently, Mumbai has taken the 3D mapping route when it unveiled one of India’s first urban digital twins. Mapping the sea-facing sections of the city’s G-South ward using a combination of GIS, lidar, and high-resolution drone imagery, BMC has effectively created a 10-square kilometer scaled digital copy of the zone’s land cover and built-up areas. One of the aims of this digital twin is to help the city prepare against water calamities such as storms, floods, and sea-level rise. And if these initial digital twinning projects become successful, the future goal is to extend the 3D mapping technology to the rest of Mumbai.
Tokyo: The Big One in mind
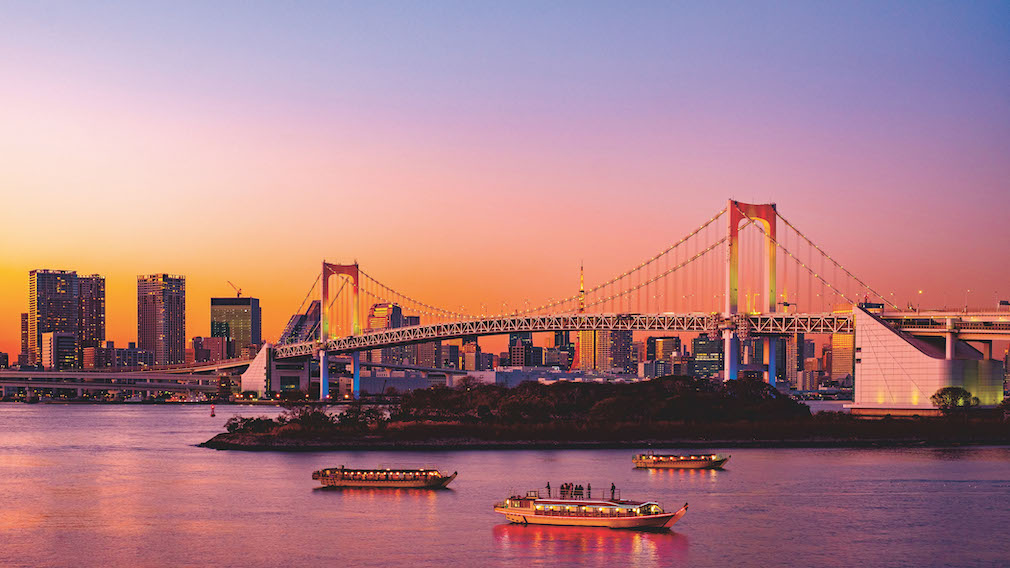
Rainbow Bridge and Symbolic Tokyo Tower at night time.
The most populated megacity is also the most prepared against future water crises. For the last two decades, Japan’s capital and its biggest city, Tokyo (population 38 million) has been regularly updating its water infrastructure network to combat large-scale water shortages that happen about once every decade. The devastating drought of 1994 that caused rationing of household water supplies, has forced Tokyo to look for other viable sources.
And that they did. With the help a GIS-based sewage mapping system developed by the Tokyo Bureau of Waterworks, the megacity was able to execute various projects that continuously reclaim and recycle water. Currently 61 percent of water for non-potable purposes comes from reused water.
Aside from droughts, Tokyo’s water managers are also preoccupied by what citizens call the Big One, or a strong earthquake that could knock out the city’s infrastructure. Found within the Pacific Ring of Fire, Japan experiences ground tremors regularly, so engineers are right to expect that a high-magnitude earthquake can damage its 27,000-kilometer underground water supply network.
As such, the Bureau of Waterworks has not only replaced old pipelines and made them earthquake-resistant, it has also built a GIS-supported water pipeline database that allows city officials to maintain and manage these critical tubing assets, even in the event of earthquakes.
This groundbreaking GIS database has also been used to find damaged pipes caused by seismic events because it can combine various data layers such as pipe material and dimensions, as well as maps of the epicenter of earthquakes. Overlaying all this location-specific information in GIS has been helping engineers to pinpoint spots of pipe failures in the water network in real-time, letting them effectively organize emergency repairs and restoration works.
Do you need to report a leak fast? The Bureau’s well-organized GIS database is also connected to Twitter, allowing water engineers to act fast when citizens tweet about the location of busted pipes and leaks. This blending of better physical infrastructure, Big Data, and GIS seem to be working. In the last decade, the rate of leakage from Tokyo’s water utility has stayed below five percent. And even if it has one of the lowest leakage rates in the world, it is a drop in the bucket that this megacity still wants to reduce.