Cities are now creating their own subsurface utility maps to manage their underground assets. But the lack of an open-based geospatial model means that data are often not interoperable. A new mapping standard aims to fix that.
In the years since 2004 when a leaking gas pipeline exploded in Ghislenghien, an industrial town in Belgium, local authorities have become more serious about safety.
The tragedy, the country’s worst industrial disaster in decades, happened when a heavy power shovel accidentally struck a subsurface gas pipeline. At least 24 people lost their lives, including industrial workers and firefighters. Many more suffered burn injuries.
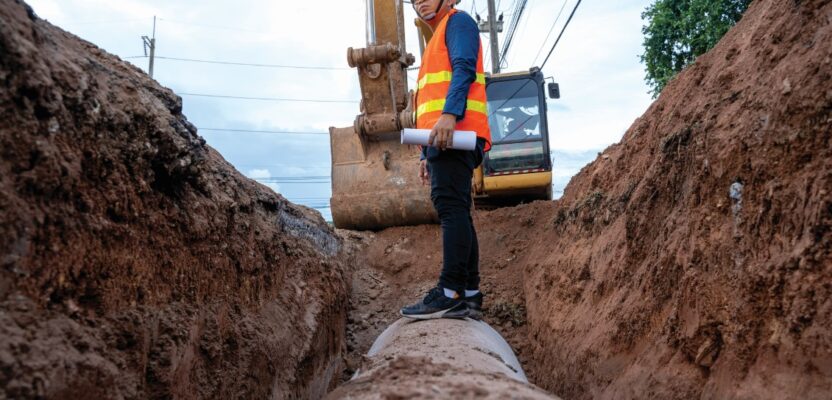
Excavating without subsurface utility maps can cause accidental pipe strikes.
In the wake of this tragedy, engineers and geospatial experts in the country sought to find solutions to avoid similar mishaps during excavation works. But that is not an easy task in this small and densely populated country. In the northern part of Belgium, for example, there are more than 600,000 kilometers of ducts and wires buried underneath the region’s soil. That includes pipelines for water, sewage, and gas utilities, as well as cables for electricity and telecommunications.
The Flemish Information Agency, the government office tasked to support its region’s digitization activities, knew that finding the exact location of underground utilities is critical to public safety. They developed KLIP, or the Flanders Underground Utility Location System (Kabel-en Leiding Informatie Portaal in Dutch), a digital portal that provides a seamless exchange of underground utility maps between utility operators and excavators. The agency rolled out the initial version of KLIP in 2007.
With the KLIP platform, individuals who want to do excavation work can request maps of underground cables and pipelines within the zone where they plan to dig. All these maps can then be viewed and downloaded. One advantage to KLIP users is they can access highly detailed underground utility maps as the KLIP database contains all the available utility plans from every utility company that has buried its cables and pipelines.
Now, more than a decade after its launch, the KLIP platform has become fully digital and cloud-based, making it more scalable to handle numerous map requests. The demand for underground utility maps has already reached 200,000 annually, a clear indicator of its worth.
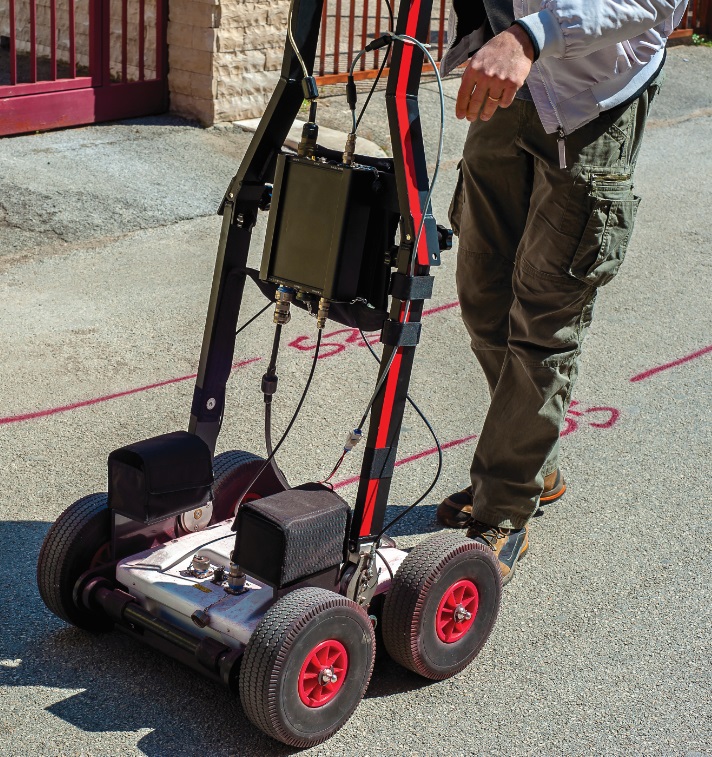
Ground penetrating radar (GPR) provides an accurate and non-destructive solution to mapping the subsurface.
Another exciting development to look forward to in the future, according to the latest report of the Flemish Information Agency, is their plan to turn their underground utility maps into 3D. An enhanced visual depiction of subterranean infrastructures will surely improve everyone’s safety above ground.
Spaghetti junction
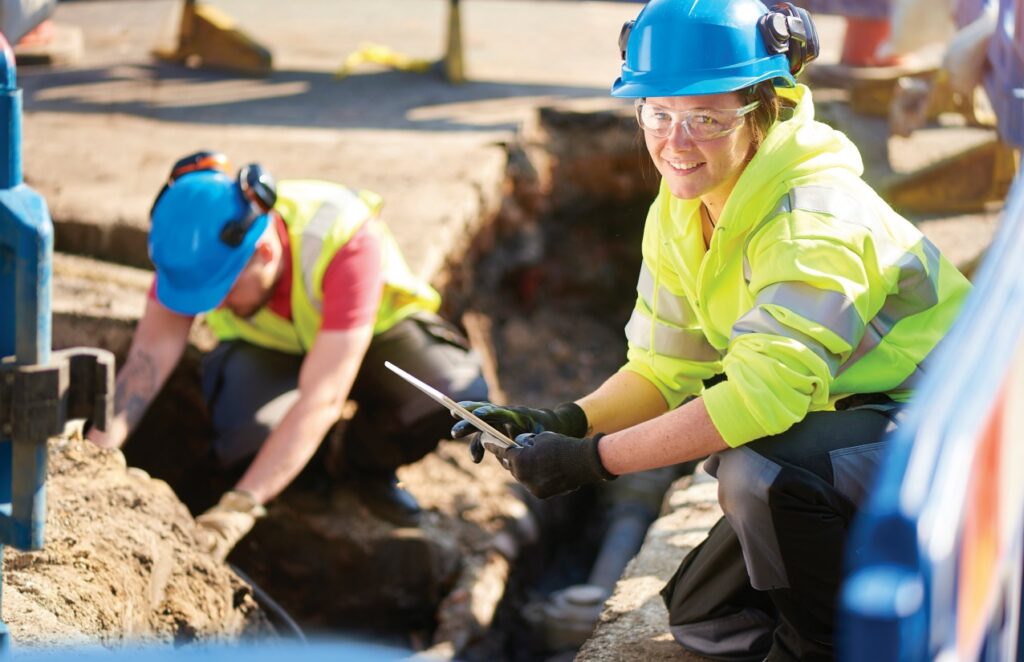
Although they are not seen, utility workers and their supervisors pay much attention to these hidden assets. And they certainly should because identifying the location of underground utilities prior to digging is important for the well-being of workers and the general public. These maps can also help construction and engineering managers make critical project choices.
Apart from lessening the chance of striking unlisted utilities during the excavation and construction phases of a project, accurate maps of underground utilities can also provide information that will minimize architectural design conflicts, as well as avoid additional project costs and time delays. Subsurface activities can be carried out precisely while making sure that other adjacent infrastructures remain undamaged during works.
However, old underground utilities may not have been properly documented over time. Subsurface maps in sites that have been abandoned, or where pipes and cables have been moved several times, may be inaccurate, incomplete, or worse, missing.
As such, any construction project that will carry out excavation works bears the ever-present risk of hitting and damaging buried infrastructures. And while workers of utility companies are tasked to record the occurrence of strikes as part of their health and safety reporting procedures, at that point the damage to the utilities has already been done. Workers must then secure the accident and contain the damage as soon as possible.
The importance of obtaining subsurface utility plans during excavation works has been the focus of a 2015 U.K. study by Nicole Metje, a senior lecturer at the University of Birmingham, and engineers Bilal Ahmad and Michael Crossland. The trio found out that of the 187 utility strike incidents recorded between 2002 and 2012, a staggering 52 percent of accidents happened when the underground utilities were not shown on the maps prior to excavation. What’s even more worrying is that from those buried pipes and cables that were drawn on the maps, 84 percent were erroneously plotted, causing the utility strikes to happen.
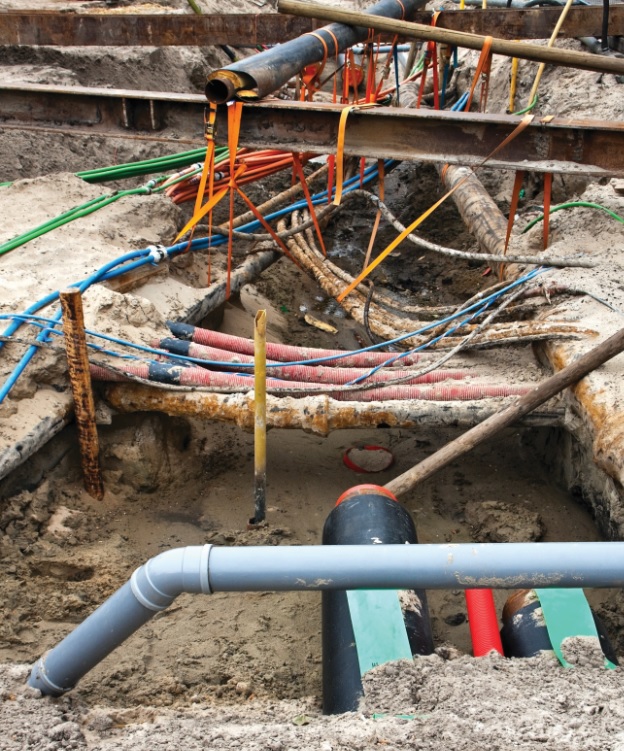
Confusing networks of underground pipes and cables is a common problem in cities around the world.
Direct damages from utility strikes not only lead to injuries or casualties to workers and people living in nearby areas. They can also have a wider impact beyond the location of the accident as the consequences can be passed on to the customers of the damaged utilities.
For example, disruption to water and electricity services often follows utility strikes, as well as traffic congestion and closure of roads for repairs. But the more concerning impact of these accidents are the long-term health and environmental losses once toxic substances escape into the air and seep into water sources.
While these impacts can be daunting, the good news is that preventing utility strikes is not an unpromising task. It still remains an important issue to the civil engineering and construction sectors as they tirelessly attempt to reduce the strikes by continuously training workers in safety procedures and by using state-of-the-art tools.
Under the radar
The success of any excavation project will depend on specialized underground scanning tools that can identify the complex layout of utilities hidden in the subsurface. While the tools available for mapping underground utilities are many, each of them has its own specific uses, as well as a list of pros and cons. What’s important is to first know if these instruments can be used to acquire the most accurate information of underground utilities for a particular location.
The cable avoidance tool (CAT), also often called Cat & Genny, is one popular instrument for subsurface utility detection. It uses electromagnetic induction to find out the presence and estimate the location of buried utilities with an accuracy of 10 percent, both horizontally and vertically. One main limitation of CATs, however, is that it can only detect conductible materials, meaning pipes made of plastics cannot be traced belowground. Despite this, CATs is still good for preliminary exploratory work.
Ground penetrating radar (GPR) is a better alternative, although it requires more expertise in handling. GPR can detect subsurface pipes and cables by inducing powerful pulses of electromagnetic energy (radar) into the ground, allowing it to function on various ground surfaces such as soil, concrete, and asphalt. Aside from being able to detect pipes and cables made of plastic or metal, it can also be used to detect gas, water, and oil leaks.
The usefulness of GPR becomes more apparent when combined with real-time kinematic and survey-grade global positioning system (GPS) receivers. This GPR-GPS combo can provide highly accurate results that can help discover unmarked utilities and structures below ground. Subsequent post-processing procedures are then performed by importing the GPR radargram data into CAD or GIS platforms to create the subsurface utility maps.
Underground Seen
There is no doubt the commercial availability of tools is a boon for city engineers and planners who want to develop their own subsurface utility maps. Apart from Belgium, other places such as Hong Kong, Singapore, and Scotland, as well as cities like Chicago, Rotterdam, Toronto, and Zurich are now managing their underground assets.
 However, the cities mentioned above use different mapping data models to trace their pipes and cables. Aside from that, they also have dissimilar means of describing and assigning attributes to the various underground elements.
Another critical issue is the delivery of the subsurface map products in disparate formats, from GIS to BIM as well as 2D CAD. Although these traditional mapping platforms are well-matched to describe the elements found above ground, they may

The water pipes and other underground assets of Singapore are now mapped in 3D.
not be always suitable in tracing the subsurface environment.
Take Belgium’s KLIP, for example. It uses the IMKL Data Model, which is also the underground utility standard for the Netherlands. Because IMKL is not a data format, it uses GML to transfer its underground utility data. GML, or geography markup language, is an open-data format that allows the exchange of geographic information over the Internet.
Singapore, on the other hand, uses the Land Administration Domain Model (LADM) for its 3D underground utility mapping. LADM is an international ISO 19152 standard for cadastral systems, which the country has adapted for subsurface use. Singapore’s LADM data model is designed using Unified Modeling Language (UML) and then exported to the ArcGIS (Esri) platform to visualize in 3D its subterranean assets.
Another country using GIS to map its underground assets is Scotland. Its Community Apparatus Data Vault (Vault) makes maps of the location of underground pipes and is accessible to all road authorities and network operators. It went live online in 2012 and has since improved the safety and speed of public works. Unlike the initiatives in other countries, however, the Scottish model is used to map both above and below ground assets.
Under control
With such different underground data mapping models in use, it is inevitable that the utility maps are also kept in various data storage formats. As such, these records are hardly interoperable. Data managers often have to transform the formats of their original utility data in order to view, distribute, and retrieve them. Such fragmentation in data formats reduces data scalability and can lead to loss of data quality.
Since 2017, the Open Geospatial Consortium (OGC), an international association of experts that aims to improve access to location information, has been at the forefront of developing an international standard for mapping geospatial data underground.
Calling the new geospatial standard MUDDI (Model for Underground Data Definition and Integration), the OGC and its members are pushing toward a universal template that can be used to visualize any infrastructure found in the subsurface, as well as represent its subterranean surroundings, while at the same time postulating a uniform solution to store all this data.
Because it is an OGC-led initiative, it is vital to the MUDDI to be accessible and interoperable. This means that all underground information should be easily transformed into maps using open-source formats, while at the same time allowing anyone working in the same underground location to have access to the maps of buried assets.
One of the early testers of the MUDDI model is New York City, where geospatial experts assessed the practicality of the new geospatial model in the city’s 3D underground mapping project. Another initiative, UNUM (Unification for Underground Resiliency Measures), which is spearheaded by New York University, is also using the MUDDI to identify the common areas between the open standard model with the prevailing underground infrastructure standards set by the American Society of Civil Engineers (ASCE).
But one country that is adopting the usefulness of the MUDDI standard is the United Kingdom. Initial tests of MUDDI conducted last year in various locations showed positive results. And with the approaching full implementation of its National Underground Asset Register (NUAR), a digital map of the country’s underground pipes and cables, the timing of the tests was fitting.
Just last April, the first NUAR maps went live online, making it possible for utility workers to safely dig up the grounds of Northeast England, Wales, and London. More sites will be uploaded to the NUAR website soon.
According to Chris Popplestone, senior data architect at Ordnance Survey, Great Britain’s national mapping agency, the pilot testing in the U.K. used a prototype of the MUDDI. Popplestone collaborates in both the MUDDI and NUAR initiatives.
“The NUAR pilot was based on an earlier version of MUDDI, and the feedback we got from the pilot phase has fed into a new iteration of the MUDDI model. That is now forming the basis of the national roll out of NUAR,” he said in a separate interview.
Clearly, the big advantage of the MUDDI standard is that it can easily be adapted to different underground situations, wherever the site may be. And that’s great news for countries that are just about to embark on their first underground asset mapping.
“We have tried to make it quite modular and quite flexible,” said Popplestone.
Meanwhile back in Belgium, the success of its underground asset mapping has made urban planners think of better ways to use the new technology. City authorities in Brussels, Belgium’s capital, will use subsurface utility maps to support their tree-planting initiatives.
Their plan is to plant 2,000 trees over the next five years, focusing on neighborhoods dominated by office buildings. But there’s a holdup.
“It turns out that we cannot place trees where we want them,” said Brussels City councilor Ans Persoons in an interview with local magazine Bruzz. “That is because our subsurface is so chaotic. There are pipes for gas, telecom, and water, not to mention parking garages, metro lines, or stations,” she said.
Their engineering office is now mapping out the subsurface to trace all the suitable sites where trees can be planted and where their roots can grow without damaging the city’s underground assets.
“If we make a neighborhood greener, it can become more attractive to live in,” added Persoons.