To improve urban air quality monitoring and help keep their citizens healthy, cities around the world are now combining traditional data capture techniques with geospatial technologies.
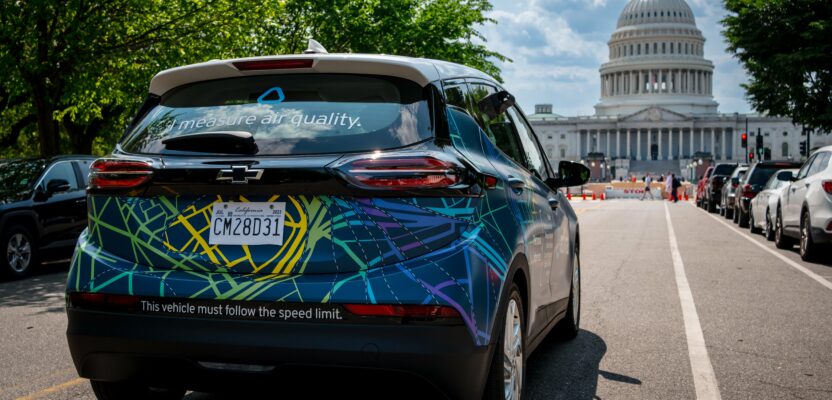
If you happen to be driving or walking around Washington. D.C., this past summer, then there is a good chance that you crossed paths with one of the blue and white cars that were cruising along the streets of the U.S. capital. And although the vehicles may look like another ride-hailing car, they are definitely not out and about to fetch passengers. Rather, they are scooping samples of air, which will then be analyzed and mapped for traces of harmful chemicals and particles.
These pollution-detecting vehicles are part of a program between the city’s Department of Energy and Environment (DOEE) and climate tech company Aclima. They aim to gather data on air pollution at the scale of neighborhoods and help improve air quality. Since 2015, the company has been collaborating with Google’s Street View platform to map air pollution in various urban locations including Dublin, Hamburg, New York, and San Francisco.
An Aclima car collecting air quality data in Washington D.C. Credit: Brittany Diliberto / Aclima
Charting air pollution at the street-level is made possible by Aclima’s mobile-mapping technology that captures billions of air quality data points as the cars move along the roads, while at the same time effectively ascribing location information to them. Once these data points are plotted in two-dimensional detail, they reveal what the company calls “hyperlocal maps” that provide urban air quality conditions at very high temporal and spatial resolutions.
Hyperlocal maps have an advantage over traditional air quality maps derived from stationary sensors because the information they provide comes from a larger area. Stationary sensors, on the other hand, are usually hoisted high up on city light poles or attached to buildings. As such the air quality information that they can provide is only valid for a particular zone, and generally within a narrow radius.
Mobile sensors, similar to those employed by Aclima, can actively monitor pollutants in the air over a wider area and take into account the round-the-clock changes in vehicular traffic. The resulting street-level snapshots of emissions captured by these mobile sensors can reveal varying levels of air contamination block by city block and at different times of the day. Access to this important source of air pollution information can thus help authorities and citizens create local-level air quality mitigation strategies for their own neighborhoods.
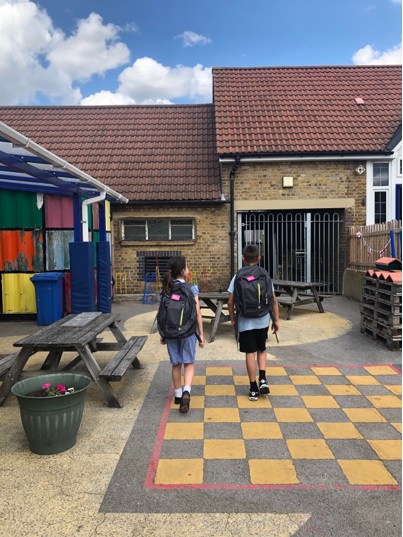
Students in London wear backpacks equipped with air quality sensors. Credit: Environmental Research Group
In the U.S., air pollution is still a problem that plagues many areas. According to the latest State of the Air report by the American Lung Association, a non-profit health organization, more than one in three Americans live in places with unhealthy levels of air pollution. But while D.C. may not be on top of the most-grimy places on the list, the city still experiences spikes in levels of ozone and particle pollution, which are unsafe for people’s health.
These two pollutants will be measured and mapped by the project, along with other noxious chemicals like nitrogen dioxide, carbon monoxide, carbon dioxide, and black carbon. The vehicles have been busy collecting air samples around the four pilot neighborhoods of Ivy City, Brentwood, Buzzard Point, and Mayfair. More areas will be included next summer.
DOEE’s interim director Richard Jackson says the city is looking forward to Aclima’s insights and hoping they will provide data on “reducing air pollution and promoting healthier District Wards.”
Other cities around the world are likewise leveraging geospatial technologies to improve urban air monitoring activities. From deploying location-aware sensors, to employing maps and apps, as well as commissioning Earth Observation satellites, there are plenty of geospatial ways to make the air in our cities cleaner and healthier. Here are some of
them.
Learning from London
School kids in London who are reading Charles Dickens’s famous stories will always be transported to a time when their city was black and grimy. The tales were often set when foggy weather mixed up with the dark smoke and soot from the burning of coal that came from heating houses and powering factories. Fortunately for everyone, the use of coal in London is now restricted.
There is, however, a new pollutant that is tarnishing the air of the city: road transport. Roughly half of the nitrogen dioxide (NO2) emissions in London comes from vehicles, and the concentration of this gaseous pollutant is highest along busy roads.
Aside from causing acid rain, NO2 can harm the lungs of children who are most vulnerable to the effects of air pollution compared to adults. And even if children spend most of their time inside schools, they are still not spared from exposure to this contaminant, especially during their daily journeys to attend classes. According to a report in 2017, one in five of London’s schools are located in areas with poor air quality.
In an effort to measure and map the exposure of school children to air pollution, 250 students from five London primary schools took part in the Breathe London Wearables project sponsored by the mayor of London.
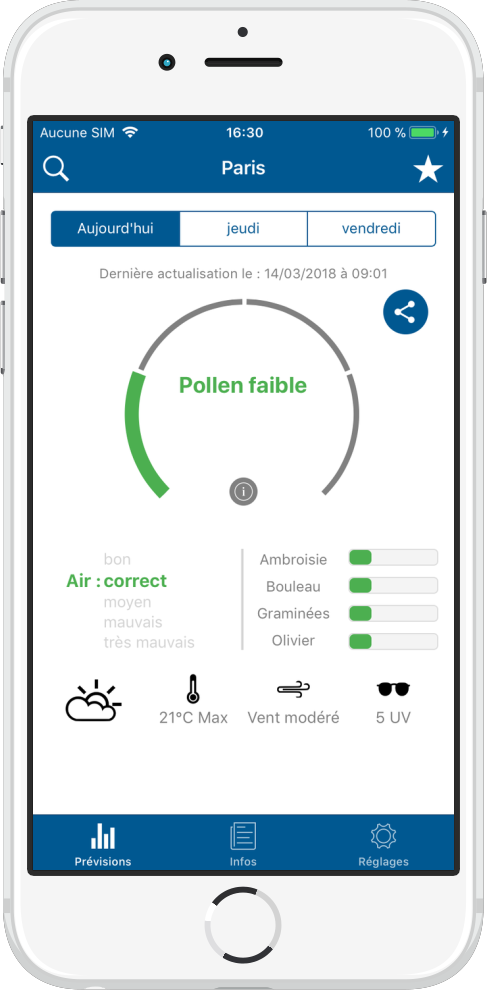
Interface of the French Météo Pollen app. Credit: Météo Pollen
For a week, each student carried a backpack equipped with air quality sensors that measured particulate matter and nitrogen dioxide (NO2) levels, and which then were automatically geo-tagged using built-in GPS trackers. After scientists at Kings College London analyzed the data, the resulting maps showed not only the trajectories of the students from home to school and back, but also the corresponding pollution measurements at street level.
The maps created from the study confirmed what most parents and teachers already assumed: the children that walked to and from school through busy main roads were exposed to higher levels of air pollution than those who chose to travel through back streets.
Such valuable information provided by the air quality mapping project has now been used as one of the factors in demarcating the boundaries of Ultra-Low Emission Zones (ULEZ) in the city. London’s ULEZs are special areas where non-compliant and highly polluting vehicles have to pay to enter. Based on last year’s data alone, the measured impact of the zones to the city’s air quality has been very positive, showing a 46 percent reduction in nitrogen dioxide pollution from traffic. The ULEZ has now since expanded to include all of London.
“I hope the success of this scheme will act as a blueprint for cities around the world to battle their own toxic air emergencies,” said mayor Sadiq Khan.
Pollens in Paris
Come springtime, most Parisians start updating their smartphones with specially designed apps to help them check the one main thing that makes them say “atchoum!” during the season: Pollen.
Allergy to pollen, however, is prevalent not just in the French capital. According to the country’s National Aerobiological Surveillance Network (RNSA for its acronym in French), at least one adult in three suffers from allergy in the entire country due to these microscopic-sized grains. But the poor air quality in the City of Light makes allergies to pollen even worse for people living there.
In most of Europe, plants release their pollen from springtime through autumn, resulting in high pollen concentrations that can affect human health for about six months. Combining that with ozone and particulate matter pollution, similar to the levels found in cities like Paris, often leads to higher severity of allergic symptoms among sufferers.
Pollen counts are also affected by weather patterns. In general, flowers bloom during warmer and windy periods, resulting in more pollen in the air. But pollen’s relationship with rain is quite special.
Although rainwater can wash away pollens from the atmosphere and cause a lowering of pollen concentration immediately after a rain event, the physical impact of the raindrops can also trigger big clumps of pollen to break apart and release even smaller pollen particles into the air, causing another problem for allergy sufferers.
Incorporating this interplay of weather and air quality is crucial to effectively track the levels of pollen in the air.
“It is very important to act on these two factors, especially near the ring road (of Paris) where there are 11 percent more children who are asthmatic,” said Anne Souyris, deputy mayor of the city in charge of health, in an interview with the French website Geo.
In France, there are at least nine pollen-tracking mobile apps that cover the entire country, and each one has its pros and cons. Météo Pollen app is one of them and could just be the most geospatially complete.
Created by the French start-up Weather Force, the app pools pollen forecasts from Europe’s Copernicus Atmosphere Monitoring Service (CAMS) and the latest local weather information from space-based weather satellites operated by the French National Meteorological Service (Météo-France). Such an approach, which combines high volume data, is definitely nothing to sneeze at, especially when calculations are updated several times a day to achieve even more accurate pollen forecasts.
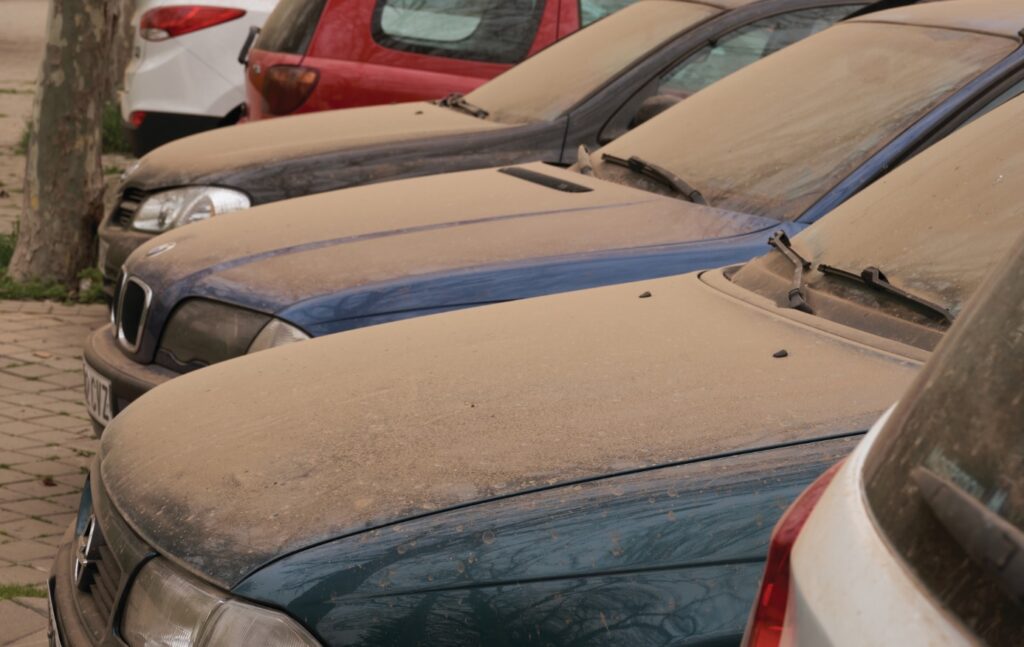
Cars in Spain covered by dust from last year’s storm. Credit: iStock
What’s more, by using data sources obtained from different locations, the Météo Pollen app can deliver air pollen information at a greater detail that adapts to the user’s whereabouts. Pollen information is also forecasted two days in advance for plants like grasses, birch, olive, and ragweed. This highly geo-localized and time-sensitive approach makes the app very useful.
These forecasts do not take the health impact into account, but they provide the pollen information at much higher spatial resolution for the specific area than other methods.
Forecasting Dust Storms in Barcelona
A supercomputer that operates inside a former chapel is helping Barcelona and other cities around the Mediterranean predict when the next dust storm will strike. It does this by combining data from a network of ground-based sensors and several earth observing satellites in space to predict the movement of dust storms in the atmosphere.
MareNostrum (“our sea” in Latin) is one of the most powerful supercomputers in the world. It can operate at a peak power of 11.15 Petaflops, meaning it can perform more than 11,000 trillion operations per second. Scientists working at the Barcelona Dust Regional Center are using this high-speed computing power to provide daily dust forecasts that cover much of Europe, Northern Africa, and the Middle East.
During last year’s dust storm in southern Europe, for example, the center’s forecasts were vital in helping people in Spain prepare days before the dust reached their area. Citizens took travel precautions stayed mostly indoors during the storm.
Excessive dust in the air is harmful to human health and can cause respiratory ailments. Dust storms can also impede sea, land, and air transport, as well as decrease solar energy output. Timely forecasts are important to prevent the risks associated with such storms, but ultimately the reliability of these forecasts will depend on the quality of available data and technological advancements in computing.
According to Carlos Pérez García-Pando, an expert on sand and dust storms at the Barcelona Dust Center, new improvements in global observation systems and techniques show promising prospects.
“Dust forecasts that use actual satellite aerosol data perform better than forecasts that depend only on modeling to define initial conditions,” he wrote in The Conversation.
Other Developments
This year’s launch of NASA’s latest satellite, the TEMPO (Tropospheric Emissions: Monitoring of Pollution) is exciting news for scientists and urban residents. It’s the first space-based instrument to provide hourly measurements in cities of aerosol as well as other air pollutants such as ozone, nitrogen dioxide, formaldehyde, water vapor, and several trace gases. Initial air quality data has already been released, but its coverage is limited only to cities in North America.
Closer to Earth, another proof of geospatial technology’s enduring utility in air quality monitoring is the latest Application Programming Interface by Google, Aclima’s long-time collaborator. Made public last August, this new Air Quality API is available from the Google Maps Platform and it will allow developers to map air pollution and pollen information based on the company’s artificial intelligence algorithms and multiple data sources, including monitoring stations, sensors, models, meteorological data, satellites, land cover maps, and live traffic information.
“We’re dedicated to building tools that organize environmental information and make this data useful for companies, cities, and partners,” said Yael Maguire, Google’s vice president and general manager for Geo Sustainability.
The search company’s latest foray into air quality mapping is another win for urbanites who may now have the option to follow least-polluted routes using their smartphones. And with AI now making inroads to improve pollution forecasting, it’s good to keep in mind that these high-tech tools can only gauge how dirty the air is. The next logical step is to actually clean our environment, and it will require us all to roll up our sleeves.