
Part 2
By Juan B. Plaza and Giulio Maffini
Before we can even attempt to describe what AI can do for GIS, we need to understand what a GIS is and how it is used. What do these three letters mean? A pretty good definition is: A geographic information system consists of integrated computer hardware and software that store, manage, analyze, edit, output, and visualize geographic data. Much of this often happens within a spatial database, however, this is not essential to meet the definition of a GIS.
GIS is a big-umbrella term for literally hundreds of software tools, developed over the past 60 years, each with strengths and focus to support particular disciplines. But many GIS share basic spatial functionality. Unfortunately, despite efforts to develop cross-industry standards, GIS brands using different computer languages, terminology, and interfaces make them all dissimilar. Commercial GIS and their internal algorithms are proprietary and not open to scrutiny.
One of the principal differences between the types of GIS is the underlying data model used to represent the real world. The two GIS data models are vector vs. raster. Each has advantages and disadvantages.
In a vector-based GIS, points, lines, and areas (defined as polygons) are used to represent the real world. Geographic features like property parcels and jurisdictional boundaries are precisely and accurately represented. However, defining the boundary between a field and forest edge, deciding where to put the demarcation line is difficult. If the decision to place the line is made by someone who digitizes these features over an aerial photograph or satellite image, the resulting accuracy of the line placement depends on the scale of the underlying image and the skill of the digitizer.
Vector data is very precise. That is both an advantage and weakness. How can it be a weakness? Well, if 10 people digitize over a photograph to define where the fields and forests are, you are likely to find that they do not overlap very well. When vector layers are topologically overlaid, spurious slivers of polygons will be created.
In the vector data world, we need to understand the difference between precision and accuracy. Vector based representations of real-world features are always very precise, but that should not be confused with accurate.
 Raster-based GIS data works with pixels and attributes associated with that pixel. X, Y, Z, and some thematic attributes. The X and Y accuracy is limited to the pixel size. If the pixel size is one meter, raster is not a very good way to represent a legal survey of property parcels. Raster data are well suited for thematic data. Raster data inherently has a built-in statement of their spatial (the size of the pixel) and the thematic measurement accuracy of the sensor.
For many years vector- and raster-based GIS evolved in separate silos. Vector GIS for legal boundaries and cadasters and raster GIS for image analysis software. Today vector and raster data models are accessible and integrated in many GIS.
Two developments in the vector data world are worth noting. The first is that there are huge repositories of CAD (vector) digital files that have been created by surveyors, engineers, and architects to represent roads, utilities water, sewer, gas and electrical, and communications infrastructure and building and structures. While CAD data is vector based it is important to recognize the difference with vector GIS data.
CAD data are digital drawings of lines that may look like a map but when you zoom in, are often spaghetti like vectors that may lack topology, such as closed polygons or connected networks. There has been a lot of human and technical effort invested in converting CAD drawings into georeferenced and topological GIS vector data. This continues to this day.
A second major development is the massive increase in the exponential acquisition of lidar point data for densification of urban environments and transportation networks using truck-mounted equipment, drones, and satellites. Being able to combine these massive point clouds requires new GIS functionality because legacy tools lack the algorithms to manage the massive volume of data. Entirely new sets of skills are required to understand how to combine these point clouds in a way that extracts the desired features and preserves the accuracy and precision of the source data.
GIS software has become complex. It takes years of training to learn how to properly use modern GIS. The education and training of GIS professionals requires a basic understanding of spatial analysis and a very detailed understanding of the internal capabilities of all the GIS that are out there.
Thus far, we have just been discussing data collection and integration. Let us move on to actually using GIS for analysis. To do this we will use two examples.
The first is a traditional one involving a very powerful basic GIS capability—overlaying thematic layers of GIS data to perform a suitability analysis. The GIS layers in this simple example is for a region in Italy. For this region we have:
- a DEM Digital Elevation Model from Agency X,
- a soil map from Agency Y,
- Rainfall precipitation records for several weather stations from Agency Z, and
- Property parcels from Agency W.
The analytical task is to find the places that are most suitable for growing a particular crop, say grapes for making wine. You know the best slope and aspect conditions, the rating of soils and the ideal precipitation for growing grapes. You specify these as rated conditions, and you want the GIS to make a map showing where the best to worst conditions are for growing grapes.
You also want a tabular report that calculates how much land in each property parcel falls into the suitability categories. This is a simple task and tens of thousands of GIS trained professionals can do this analysis within an hour. That is of course, if all the input data layers have the same projection systems and are aligned and rectified.
That is a big if.
Map projections are a challenge. Representing a 3D surface on 2D requires making decisions about what map projection system to use. There are literally hundreds of map projections. These are the standard ones, and each can have very specific parameters that increase the possibilities to the thousands.
All GIS work is in 3D so a drawing of a map may look like 2D but every point in a vector has a Z or height coordinate. The Z-axis elevation can be captured at the time of digitizing, or it can be added to a 2D vector layer by assigning a height to each vertex. This can be done by overlaying the 2D geographical layer from a baseline Digital Elevation Model (DEM).
Another challenge relates to ensuring consistency in the attribution of thematic classes. If the GIS data layer has not been preprocessed, we are talking (depending on the number of input data layers), many hours or days to make them ready for analysis. This is just for a GIS analysis with four layers. If you increase the number of layers to 10 or 100, there is an exponential increase in time required to prepare to perform a proper analysis.
Humans require lots of training to do this, and it is easy to make simple mistakes. Such mistakes can accumulate and make any analysis incorrect or misleading. For the GIS specialist this grunt work takes a lot of time. An AI application that understands all these basic rules would be a huge benefit.
If AI is trained to have the knowledge and capability to rectify separate data sources, it will expedite the speed and quality with which GIS users can perform their work. The economic and financial benefit of using AI to expedite the data preparation process prior to GIS analysis is very large.
Preparing spatial data for GIS analysis is probably 80 percent to 90 percent of the work effort of a GIS specialist during a year. If AI could cut the amount of time a GIS specialist spends on data preparation by 50 percent, you would increase the GIS analyst’s output productivity in doing analysis by more than 400 percent. Worldwide, that is likely worth billions of dollars in economic benefits.
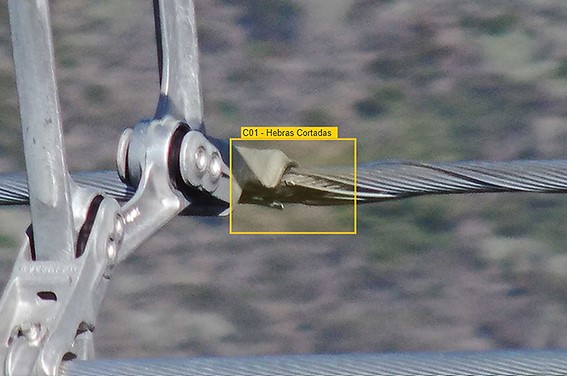
Image Courtesy of Automapp.cloud
The second example is about increasing the efficiency and accuracy of spatial data during the acquisition stage. The example is from the electric utility sector, specifically inspecting transmission and distribution networks for preventative maintenance.
Basically, artificial intelligence is the capacity of software algorithms to identify patterns and make conclusions based on them. This process of “teaching” software algorithm to recognize patterns is called machine learning (ML) and is based on a repetitive sequence of examples that “teach” the AI engine that certain items belong to certain categories. For example, in electric utilities’ high voltage conductors, wire threads tend to brake when exposed to certain elements like wind, corrosion, and constant bending.
By photographing hundreds if not thousands of these different broken threads, ML can create an intelligent database of instances where that image means “broken thread.” It is estimated that 750 images can provide 80 percent accuracy guaranteed, with thousands more needed to approach 95 percent.
Once the AI algorithm has been taught what a broken thread looks like, the software can quickly scan endless images of electric conductors and determine which sections are broken at a speed that greatly exceeds the capacity of humans to do a similar job.
But does AI have the capacity to understand all this about GIS?
To put it to the test we had a dialogue with Chat GPT 3.5 one of the available public AI apps. Like GIS there are many AI apps available, and you can now even build your own. The strength of Chat GPT is that it has a two-way natural language interface, and it has already been trained on a general basis.
We put 20 very detailed questions to Chat GPT 3.5.
From the answers we received, we can confirm that even this natural-language AI application is trained, and it has deep knowledge of GIS spatial analysis. For example, it:
- Has detailed operational knowledge of 10 of the top GIS in the industry.
- Knows how to perform thematic GIS overlays.
- Knows how to ensure that spatial data layers are in a consistent map projection.
- Knows how to perform rubber sheeting to align the layer with other layers.
- Knows how to derive slope and aspect layers from a DEM.
- Knows how to append a height to the vertices of a 2D polygon using a registered DEM.
- Knows 10 GIS scripting languages for GIS analysis.
- Knows the scripting language of ARC/GIS.
- Knows how to write scripts for ARC/GIS and QGIS?
- Understands the practical limit of the number of GIS layers that can be overlaid in ARC/GIS and QGIS.
- Knows how to clean up CAD data for use in GIS.
- Is able to use both vector and raster data layers for spatial analysis.
- Is able to assist in editing large lidar point clouds.
Because Chat GPT is a text-based AI model, it can only process and generate text-based information. This introduces some limitations. For example:
- Chat GPT does not have access to GIS software and cannot accept GIS data to actually perform GIS operations directly.
- Chat GPT does not have the capability to analyze the content of photographs or images.
However, Chat GPT can still give you advice on how to get what it cannot do directly, like:
- How to set up an AI application with direct access to your GIS spatial data and software and perform operations on your own computer.
- Which other AI models are available to analyze the content of photographs.
- How to access the AI models and systems specifically designed for analyzing the content of photographs and images.
If you are interested, you can read the full responses that Chat GPT provided to our questions by following this QR code.
So, in conclusion, GIS professionals are uniquely positioned to benefit from AI given the enormous amounts of data that are gathered and collectively rendered into spatial databases that in essence are the background for all geographical analysis and representations, common in a GIS and also by expediting inspections of enormous amounts of data faster than humans. ν
Giulio Maffini started his career in the 70s as an urban and regional planner. Later he founded a company (TYDAC) to build Spatial Analysis PC desktop software (SPANS). In the early 90s he was part of team that commercialized an all-relational, multi user, Oracle-based enterprise GIS (VISION*) for Utilities, Telecom’s, and Municipalities. He is now an advisor to spatial technology companies. Juan B. Plaza is the CEO of Plaza Aerospace, a drone and general aviation consultant firm that specializes in modern uses for manned and unmanned aviation in the areas of mapping, lidar, and precision GNSS.