(And the Inevitability of New Geodetic and Tidal Datums)
Since the arrival of the first pilgrims to the North American continent, there has been a need for precise knowledge of the coastline of the new country, and the reasons are obvious. Arrival by boat was the only alternative when crossing the Atlantic and escaping religious persecution while looking for new opportunities.
Traditionally, mapping the contours of a new land mass is the first task falling on the surveying component of any landing party. Then comes the establishment of the settlement according to rigorous parameters such as proximity to water, flat land, and the ability of soldiers to protect against threats.

NOAA Hurricane Hunter Miss Piggy flew over NOAA ship Rainier when conducting missions in the Mariana Islands. The scientist and crew on Miss Piggy captured measurements to better understand sea level change and improve flood plain management. Credit: NOAA/Lt. Dylan Kosten
Over the years coastal mapping became a matter of national security and of vital importance when planning for the maritime defenses of the new nation. It even played a role in the naming of communities, as is the case with the City of Boca Raton, Florida, where the initial map of the inlet reminded the newly arrived Spanish conquistadores of the mouth of a rat (boca de raton in Spanish).
Now this responsibility of mapping and updating this constantly changing geographic feature falls on the shoulders of the National Oceanic and Atmospheric Administration (NOAA), more specifically to the National Geodetic Survey (NGS). NGS creates the National Shoreline for use on the nautical charts produced by the Office of Coast Survey (OCS), using data provided by the Center for Operational Oceanographic Products and Services (CO-OPS).
These three “navigation services” offices all fall within NOAA’s National Ocean Service (NOS), and they and their predecessors have been surveying and mapping the U.S. domestic waters and territories, including the outer coast, the estuaries, and the Great Lakes since those offices were established in 1807.
The United States has approximately 95,000 miles of coastline and one mission of the NGS is to survey these coastal regions to provide the nation with accurate, consistent, and up-to-date national shoreline data.
These shoreline data are considered authoritative when determining the official shoreline for the United States. Until recently, acceptance of NOAA’s shoreline data as a legal authority has been based upon NOAA’s recognized expertise and court cases, but the public law passed by the U.S. Congress in 1998 provides NOAA with explicit authority to promulgate national standards for all information acquired for nautical charting purposes.
 But what really is the coast or shoreline, and by definition the maritime borders of a country? The legal definition of coast that rules NOAA’s mandate is the line where the average high tide, known as Mean High Water (MHW), intersects the coast. In addition to this legal definition, the NGS shoreline mapping program uses the tide-coordinated aerial imagery and lidar data they collect to provide the line where Mean Lower Low Water (MLLW) intersects the coast.
NOAA has invested an incredible amount of financial and human resources to not only ensuring that the coasts are well mapped and up to date but also in the creation of tools accessible to the public with products that enable coastal managers to make informed decisions.
Given that the shoreline is a dynamic interface between land and water, the website “NOAA Shoreline Data Explorer” (https://nsde.ngs.noaa.gov/), allows users to download both the National Shoreline found on the nautical charts and a continually updated shoreline product (CUSP), the most up-to-date shoreline of the United States and its territories.
Galen Scott, NGS constituent resources manager at NOAA, gave a new perspective on the importance of these coastal surveys and the constant monitoring of shoreline changes.
“The legal boundaries between private and public property are important to define for state and local governments, property owners, and resource managers, and the lines where tide datums intersect the land are the foundation those boundaries are built on,” said Gale. “In this age of rapidly rising sea levels, accurate and precise data where the sea meets the land and how that is changing over time, differently in different places, is critical information that NOAA’s navigation services offices provide the nation.”
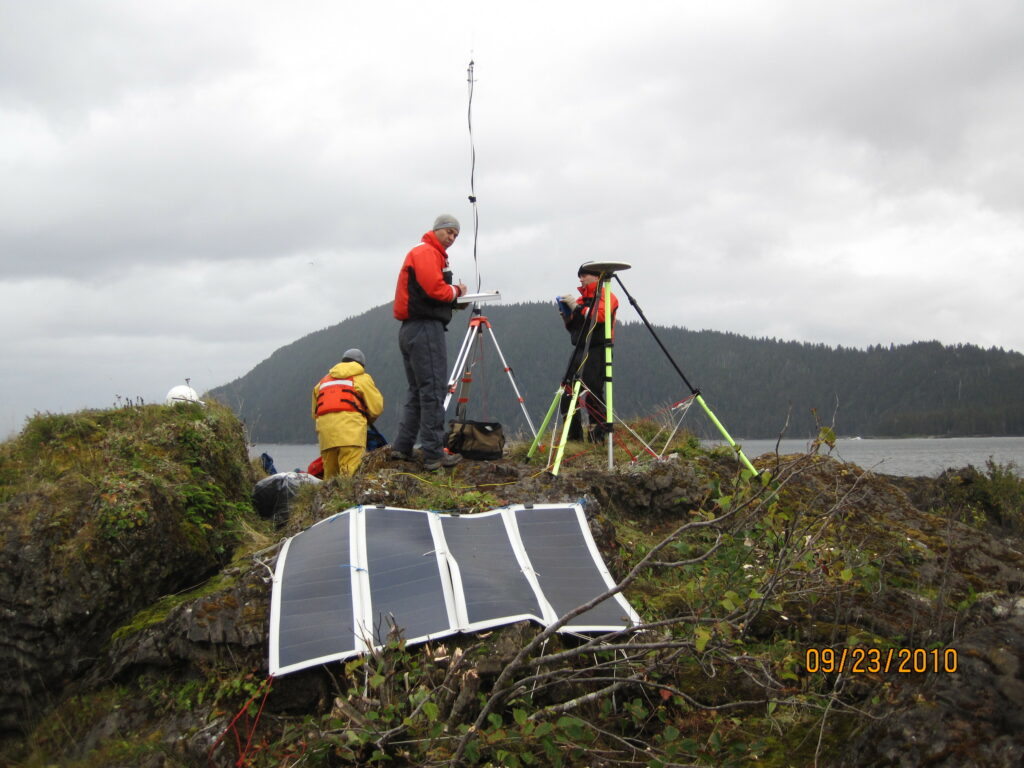
A team establishes a horizontal control station before surveying a section of coastline.
Some of these variations in mean sea level heights could have devastating consequences when combined with heavy rains or storms, which create the perfect conditions for flooding. NOAA has created an interactive tool to illustrate the impact that sea level rise is having on coastal areas, and it is available to the general public for free on NOAA’s website page Sea Level Rise Viewer.
Apart from the awesome responsibility of mapping the shoreline of the country, NOAA’s Office of Coast Survey is also in charge of creating accurate navigational charts that are used
NOAA ships like Bell Shimada play a crucial role in mapping both the coastline and sea floor.
daily to safely navigate the different waterways that make commerce possible.
“It is NOAA’s responsibility to create and maintain the nation’s navigational charts that allow mariners to use our oceans and coasts safely,” said Galen. “Every ship moving in and out of U.S. ports relies on navigation charts and water level information that NOS alone provides. Now, that same science, technology, and data collected to support safe navigation is being used many times over by scientific and management professionals addressing a wide variety of important applications.”
One of the most profound effects of these ‘coastal changes’ is that water, as it gets re-distributed over the planet due to the melting of glaciers and polar ice caps, is making noticeable changes to the gravimetric models that define the geoid.
“The Earth is a dynamic place, and these changes can have tremendous impacts on communities and even society as a whole. Measuring and understanding these changes at the spatial and temporal scales that we need to, is now possible with modern surveying and mapping technology,” said Galen. “However, the accuracy of these new surveying systems has exposed the limitations of our current datums, which were created with older technology and decades old data. In 2025, NGS will release a modernized National Spatial Reference System (NSRS), replacing the North American Datum of 1983 (NAD83) and the North American Vertical Datum of 1988 (NAVD88), with four tectonic plate-based reference frames and a geopotential datum that will cover the entire northwest quadrant of the Earth. In addition, CO-OPS will update tidal datums around the nation based on observations taken between 2002 and 2020.”
 More detailed information on these changes and the effect that they will have in future surveys can be found on the NOAA website geodesy pages.
“These new reference frames will rely primarily on Global Navigation Satellite Systems (GNSS), such as the Global Positioning System (GPS), as well as on a gravimetric geoid model that will provide accurate heights seamlessly across the lands and water of the U.S,” said Galen. “These new reference frames will be easier to access and to maintain than the current NSRS and will be purpose-built to enable surveyors to better account for the changes happening on our dynamic planet.”
In short, NOAA’s responsibility goes well beyond navigational charts and determination of wet boundaries, these mapping duties have driven innovation and changed the way we use satellite data in our daily land surveying responsibilities, as we continue doing our jobs in coastal cities with funny names like Boca Raton.