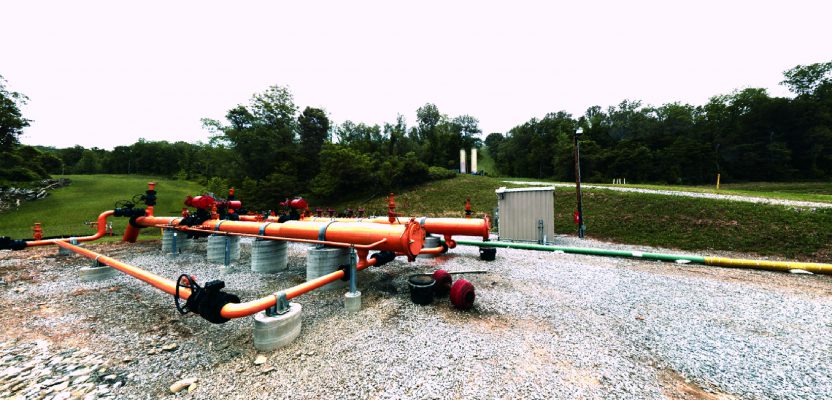
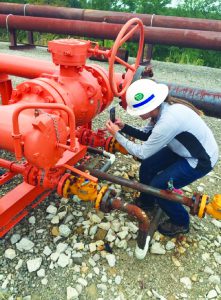
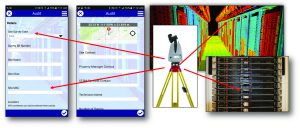
GIS applications can involve detailed asset tag capture in addition to scanning a site, its piping, and its equipment. Credit: Civil and Environmental Consultants.
On the surface, rich laser- scan data seems like a natural, valuable addition to GIS and facility management (FM) solutions—and to related operations and maintenance and asset-management capabilities.
Much as the emergence of GPS in the 1990s helped drive GIS adoption and growth, the emergence of laser scanning also feels ready to aid GIS, FM, and related services. After all, scanning’s inherently informative 3D images, accurate spatial data, and valuable context information can surely provide GIS and FM users additional value, right?
Well … not so fast.
While there is a growing number of examples of integrating scans into GIS, FM, and related applications, scanning adoption for these areas has been minimal. Why?
This article describes a few applications where laser scanning has gotten traction in GIS and FM. It also details reasons for its slow adoption for these uses, and, based on my observations, it describes keys for organizations wanting to get into these areas with scanning.
Laser scanning provides the overall 3D geometric skeleton with spatial links to individual, detailed rack and server information. Credit: BPG Designs.
Terrestrial Scanning Applications
Here are examples of specific applications where users have successfully integrated laser scanning into GIS and FM services.
First is one multi-office consulting company’s use of laser scanning on natural gas meter and receiver sites for clients. The service provider scans each site as part of a formal survey but also captures the site’s detailed piping and equipment configuration. While on site, service-provider staff take additional close-up pictures of specific equipment tags.
The scans and asset data are combined in software such that clients can view the overall site, plus details of each site. Within scan images or laser-scan-based panoramic images, users can click onto valves and meters to see specific feature/attribute/asset information for each. This solution uses an online ARC-GIS client interface and has been successfully applied to many sites for pipeline clients.
In an interesting adaptation of this approach, the same service provider applied similar methodology for documenting an historic rural cemetery. Scanning provides the overall 3D visual guide for the cemetery, while close-up photos of each grave marker are linked spatially to the correct marker location within the registered scan cloud. This particular project was done pro bono, but I think the idea has broad potential.
Another application with commercial success is the use of laser scanning for data centers; these are the facilities that house large numbers of servers within rows of racks for clients. Basically, these facilities are “the cloud.”
In these facilities, racks and individual servers may be moved around within the data center or even within a rack as client needs change over time. Keeping accurate track of these servers is serious business.
One enterprising engineering company that services the telecom industry has developed software and data-capture methodologies to provide data-center owners and clients with a convenient way to view what they have and accurately locate specific servers or other key data-center assets. Laser scanning essentially provides the skeleton for the rack and server-detailed information.
As with the natural gas metering sites application, laser-scan data provides the higher-level overall 3D view of the facility, while detailed server information is accurately spatially connected to its proper location within the scans. Again, service provider-staff gather additional detailed information for each server and rack, and specialized field and office software is involved.
An interesting FM example is that of Ecodomus. This company has developed sophisticated BIM-FM software that can take advantage of laser scans of a facility (and the panoramic images based on these scans) to help users quickly navigate a facility to areas or objects of interest. This friendly, visual, scan-based interface and the ability to spatially link areas of scans to specific asset information is the value-add for scanning for this application.
This BIM-FM software does not require that a facility be scanned in order to use it; however, scanning a facility is a relatively easy way to provide a virtual “3D geometry model” of it and simultaneously provide a friendly user navigation interface when a full BIM model is not available. Connectivity of scan geometry to specific asset location and asset information is a key capability of the total software package.
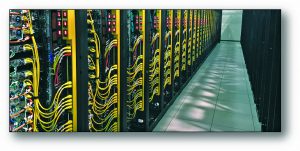
Keeping accurate track of data center assets is critical. Credit: BPG Designs.
Mobile Scanning Applications
Note that many mobile scanning projects are, in fact, asset-management applications. For example, mobile scanning is commonly used for inventorying street signs and/or street furniture. Likewise, mobile scanning is often used to gather bridge clearances whereby the captured bridge clearance data is subsequently used for truck routing purposes.
Although adoption of indoor mobile mapping systems is still in its relatively early stage, one application of interest from the standpoint of this article is the use of these systems for creating accurate 3D maps of buildings to aid first responders in emergency response situations.
A noteworthy advantage of mobile scanning/reality capture for GIS, FM, and related operations and maintenance and asset-management applications is the much higher field efficiency of these systems over static/terrestrial scanning: typically 5 to 10 times. Moreover, lower accuracies of mobile scanning systems are typically not a problem for GIS, FM, and related applications.
This is analogous to the use GPS for GIS: GIS applications can get away with lower-cost, lower-accuracy GPS systems than engineering or construction applications, which typically require higher accuracies than GIS GPS tools provide.
Where’s the Holdup?
If static scanning has such good potential in GIS and FM, why has adoption been so slow? Based on my observations, there are a few reasons.
The first is cost versus the incremental, added value of scanning. As with traditional GPS-based GIS applications, the largest cost of a GIS project is typically field-data collection. When scanning is used, in addition to the cost of scanning, crew also often gather detailed asset information for each key feature.
For many objects and assets, taking close-up photos, gathering tag information, capturing bar codes, etc. requires staff to physically get right up to each object. For such projects, the amount of time involved in that aspect of a project can easily exceed the entire time needed for scanning.
Another reason is software-related. Software that enables efficient connection of “specific spatial volumes within a scan” to asset and feature information is still relatively new and is not yet widely available in most popular GIS or FM packages. Because of this, service providers have to write some of their own software to provide a complete solution for clients, and many service organizations don’t want to take on that type of task.
Finally, I’ve observed that every organization (that I’m aware of) that has successfully developed GIS or FM solutions that include scanning are organizations with key staff who already think like GIS or FM professionals. At this stage of the game, if you don’t have someone available on your staff with a strong GIS or FM background, I would suggest not diving into these types of applications. However, if your organization does have such staff, then this area is worth looking into.