A new hyper-real golf simulator app developed with point clouds calibrates golf greens so golfers can raise their mental game.
Every golfer knows, you “drive for show put for dough.”
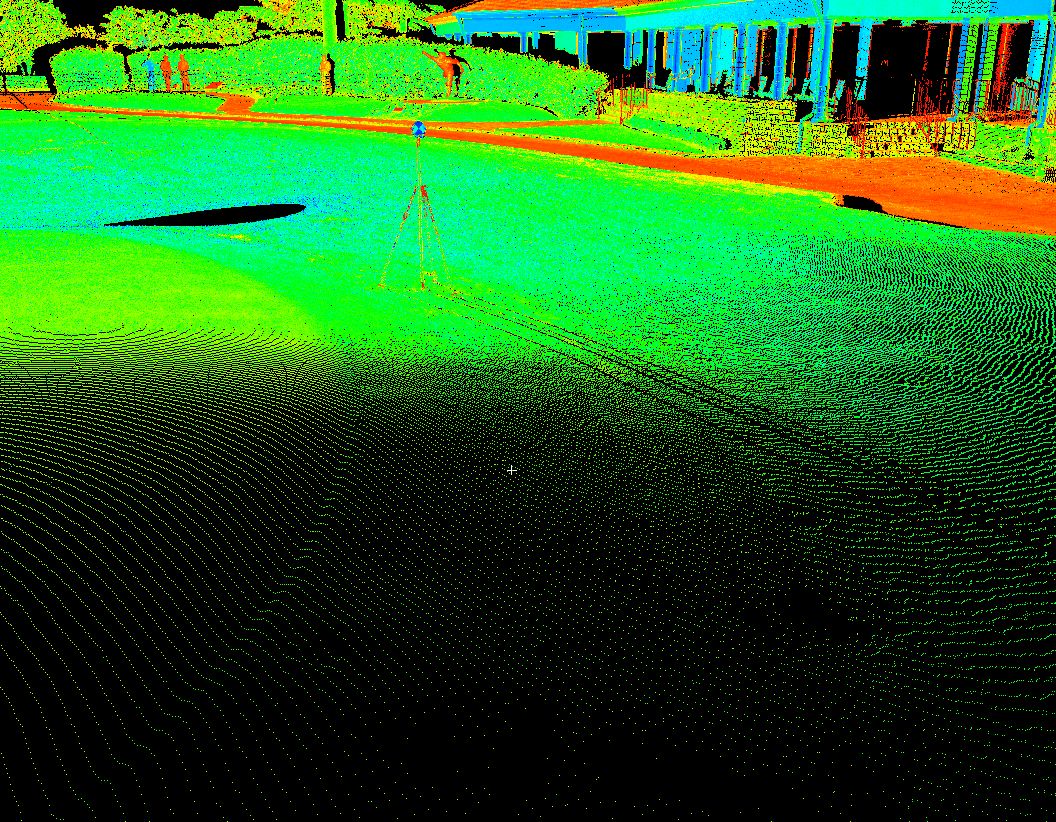
Point cloud detail from a scan displayed in Leica Cyclone with points colored by intensity. The black and white checkboard target is precisely located on the georeferenced mark: Pinehurst No.2, Pinehurst, North Carolina, 18th green, site of the 2014 U.S. Open Men’s and Women’s championship tournaments. © 2015 GolfAR
Yet, once the ball is within several yards of the hole, it seems to take on a mind of its own. It speeds up, slows down, and takes unexpected breaks. Naturally, golfers wonder about the mysteries of the green. Why does this outwardly placid surface behave so unpredictably?
A number of factors play into the ball’s seemingly erratic behavior. No matter how flat golf greens may appear, each has a curvature to it. In addition, the surface friction of the green, known as green speed or stimp, affects how fast the ball rolls and how it breaks.
“Golf is ultimately a challenge between an individual player and artfully designed terrain,” says Michael O’Brien, a landscape architect who has been studying the shape of golf courses for more than a decade.
O’Brien recently set out to unlock the mysteries of the greens, first for professionals with topographic maps and then for amateurs, in a new app, PuttAR, designed to help them understand the challenge of putting.
Capturing the Green in High Definition
O’Brien first started mapping golf courses using survey-grade GPS in 2002 for TerraVea, a professional services firm that provided as-built data for golf course architects. In 2009, to provide the highest detail possible of the greens, he starting using a Leica ScanStation 2 laser scanner to record the data.
By sweeping the laser beam over an area and calculating the distance between the scanner and the objects the laser detects, the scanner enabled him to capture 30,000 points of data per second with survey-grade accuracy. The point cloud it produced included the precise position of each data point, representing the topography of the golfing terrain.
In 2014, a new challenge came O’Brien’s way when he was contracted by Mark Long, author of the PGA Tour professional yardage books, to scan and model the greens of Pinehurst No. 2 for the creation of a series of Greens Contours books for the U.S. Open.
For this illustrious task, O’Brien upgraded to the Leica ScanStation P20 (the newest version is the P30/P40). This particular scanner uses accurately located ground control targets and captures one million points of data per second while overcoming environmental challenges. “The Leica ScanStation P20 was the best instrument for measuring the subtle shapes and slopes of the golf green,” said O’Brien. “That’s because the task not only required accuracy but also high-definition.”

This high-resolution mesh (0.15 meters) was down-sampled from the lidar point cloud with manually edited 3D breaklines, artificial color, and lighting: Ballyhack Golf Course, Roanoke, Virginia, 18th green. © 2015 GOLFAR
Because O’Brien could not scan the greens while golf was in play, he worked at night. The scanner’s backlit onboard display made it simple for him to check his equipment and make adjustments as necessary. Also, the Leica ScanStation is highly water resistant, with an IP54 rating, so O’Brien was confident it would not suffer water damage despite the ever-present threat of rain and the sprinkler system. Finally, because the hardware is seamlessly integrated with Leica Cyclone software, the complete system would save him hours back in the office.
With the data produced, Long created the most accurate, detailed Greens Contours books ever. The books received acclaim from the professional golfers who used them during the tournament. O’Brien appreciated the accolades but wanted to go further and provide the same level of information to amateur golfers.
Unearthing the Greens’ Secrets for Amateurs
In 2013, O’Brien founded rGolf Inc. with the goal of using 3D technology to improve amateur golfers’ performance and enjoyment. rGolf’s innovation enabled golfers to practice virtually, allowing them to become mentally attuned to the speed and direction to hit the ball.
The company recently launched its technology brand, GolfAR, and released the first consumer software with interactive augmented greens simulations on a mobile device, PuttAR. The golf app uses an architectural approach to topography and includes golf-green models based on high-definition data captured by the scanner. In other words, it is real-world data augmented with the information golfers need to understand the secrets of the green.
This screenshot of putting simulation app, PuttAR, shows elevation and gradient texture – blue is lower. Distance units are international-feet. © 2015 GOLFAR
App users access three key pieces of information that help them to understand why their putts move the way they do.
- In one view, the coloring varies from dark blue to yellow, showing the difference between low and high elevation.
- Another color scheme shows patches of color from yellow to dark blue, representing the steepness of the slope, also known as slope analysis. Yellow is the flattest, and dark blue is the steepest.
- The other visualization the app shows is the elevation contours. These are continuous bands of constant elevation, such as a one-foot or two-foot elevation line. In this case, the laser-scanned data enables tenth-foot contours to be mapped. They reveal how the surface of the green curves around its shape.
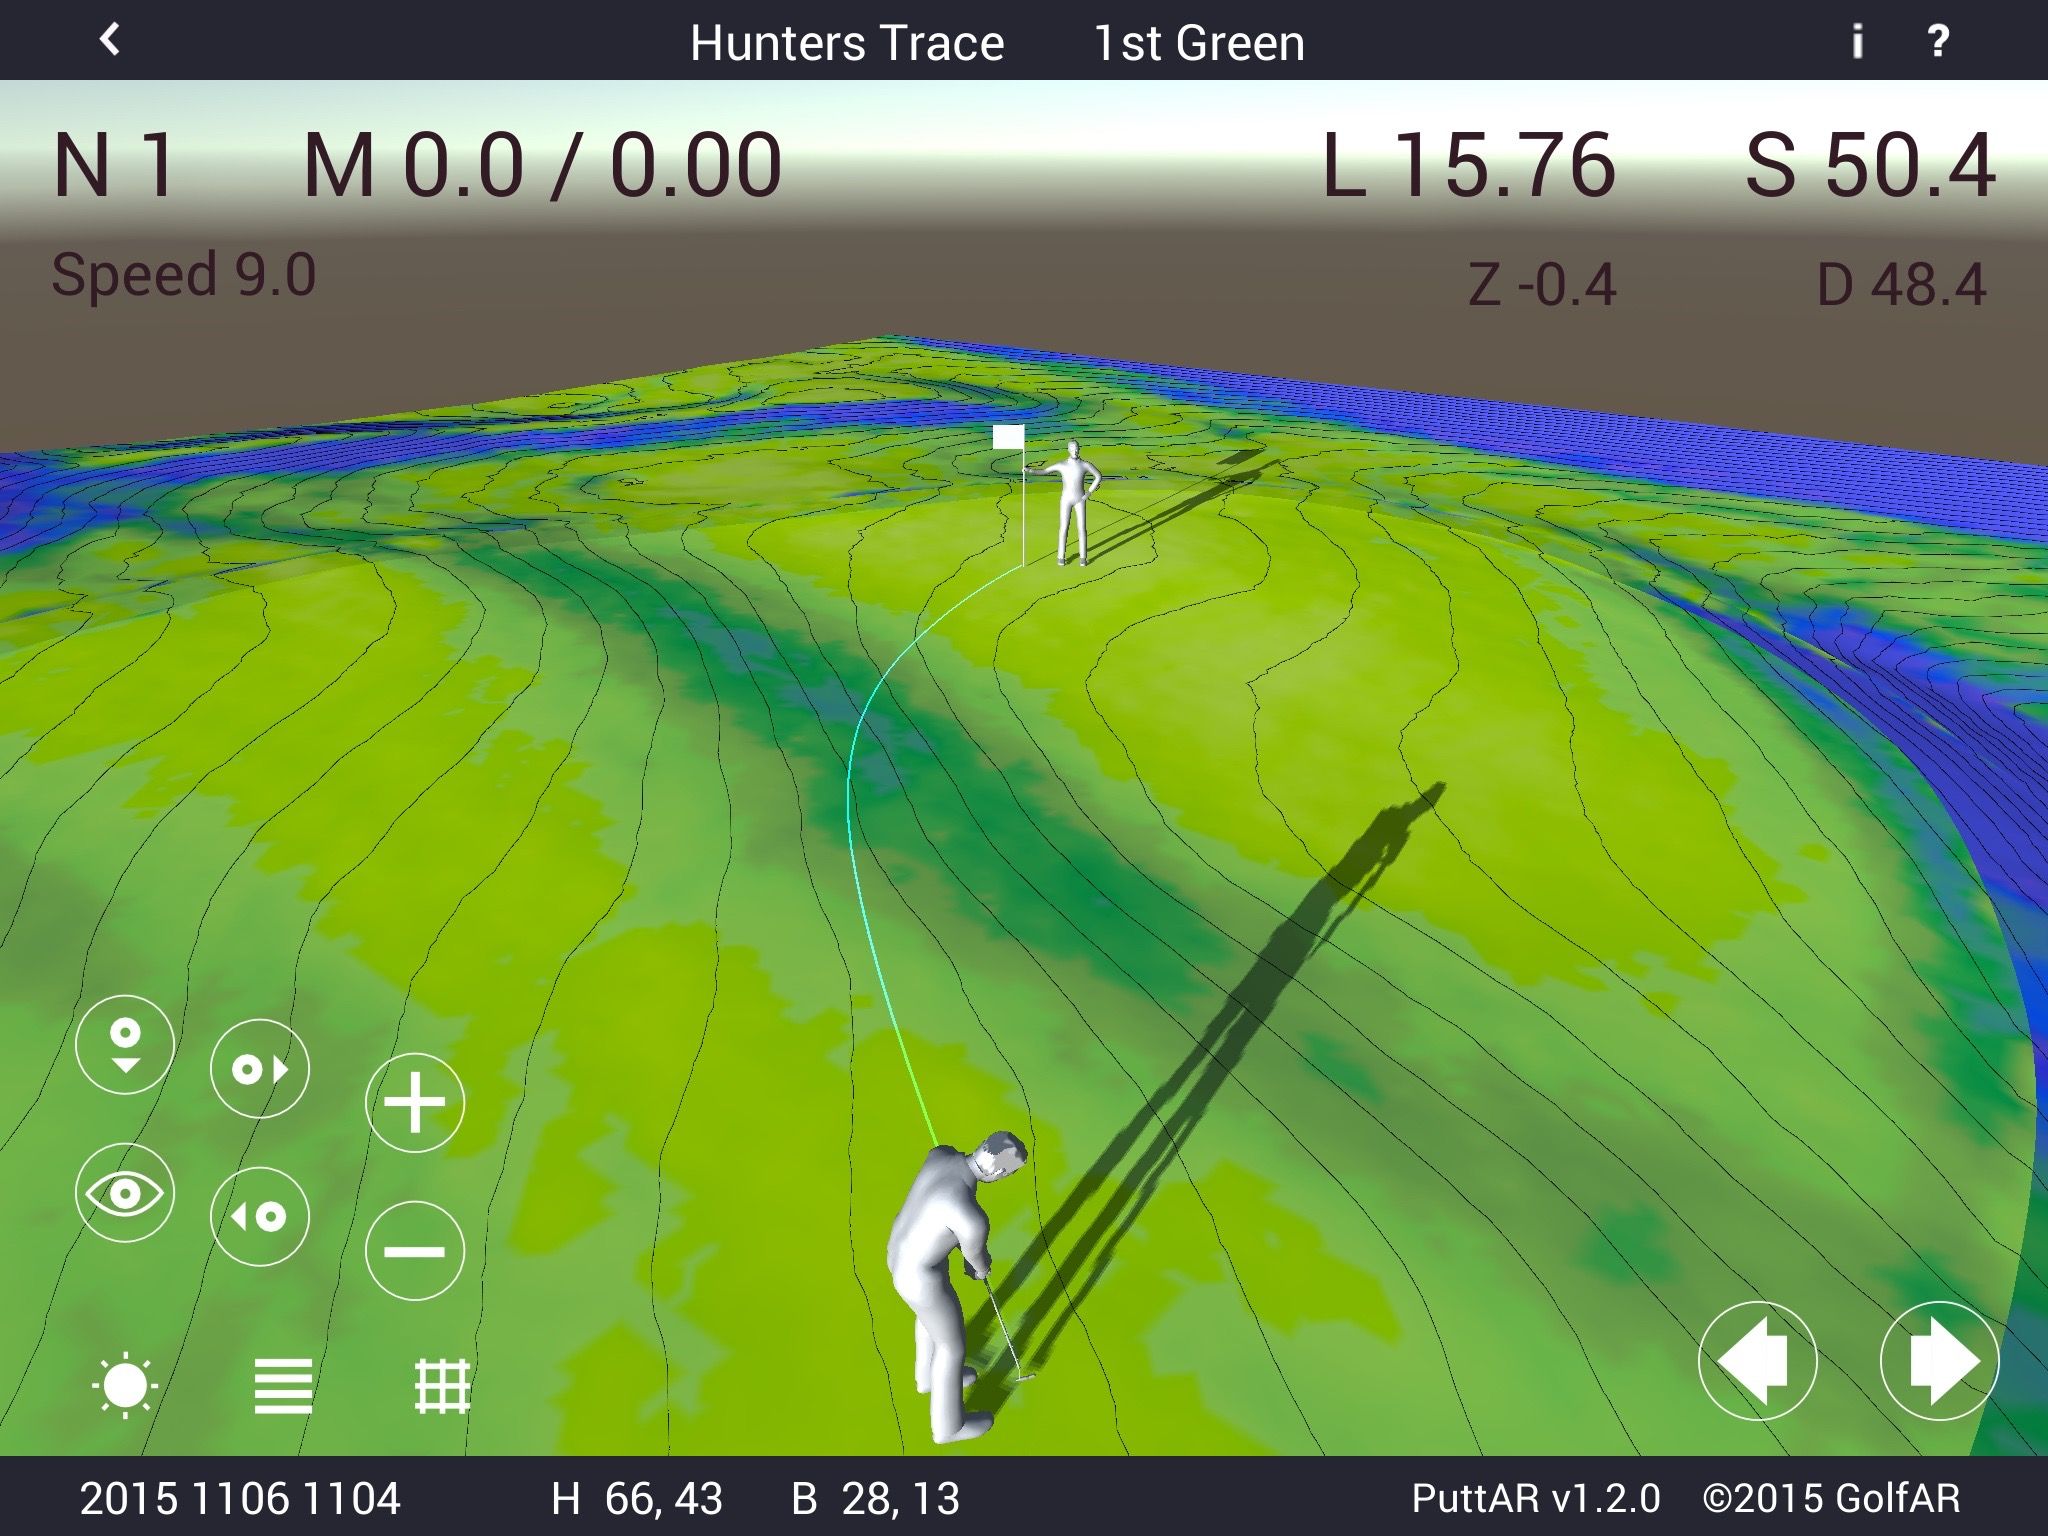
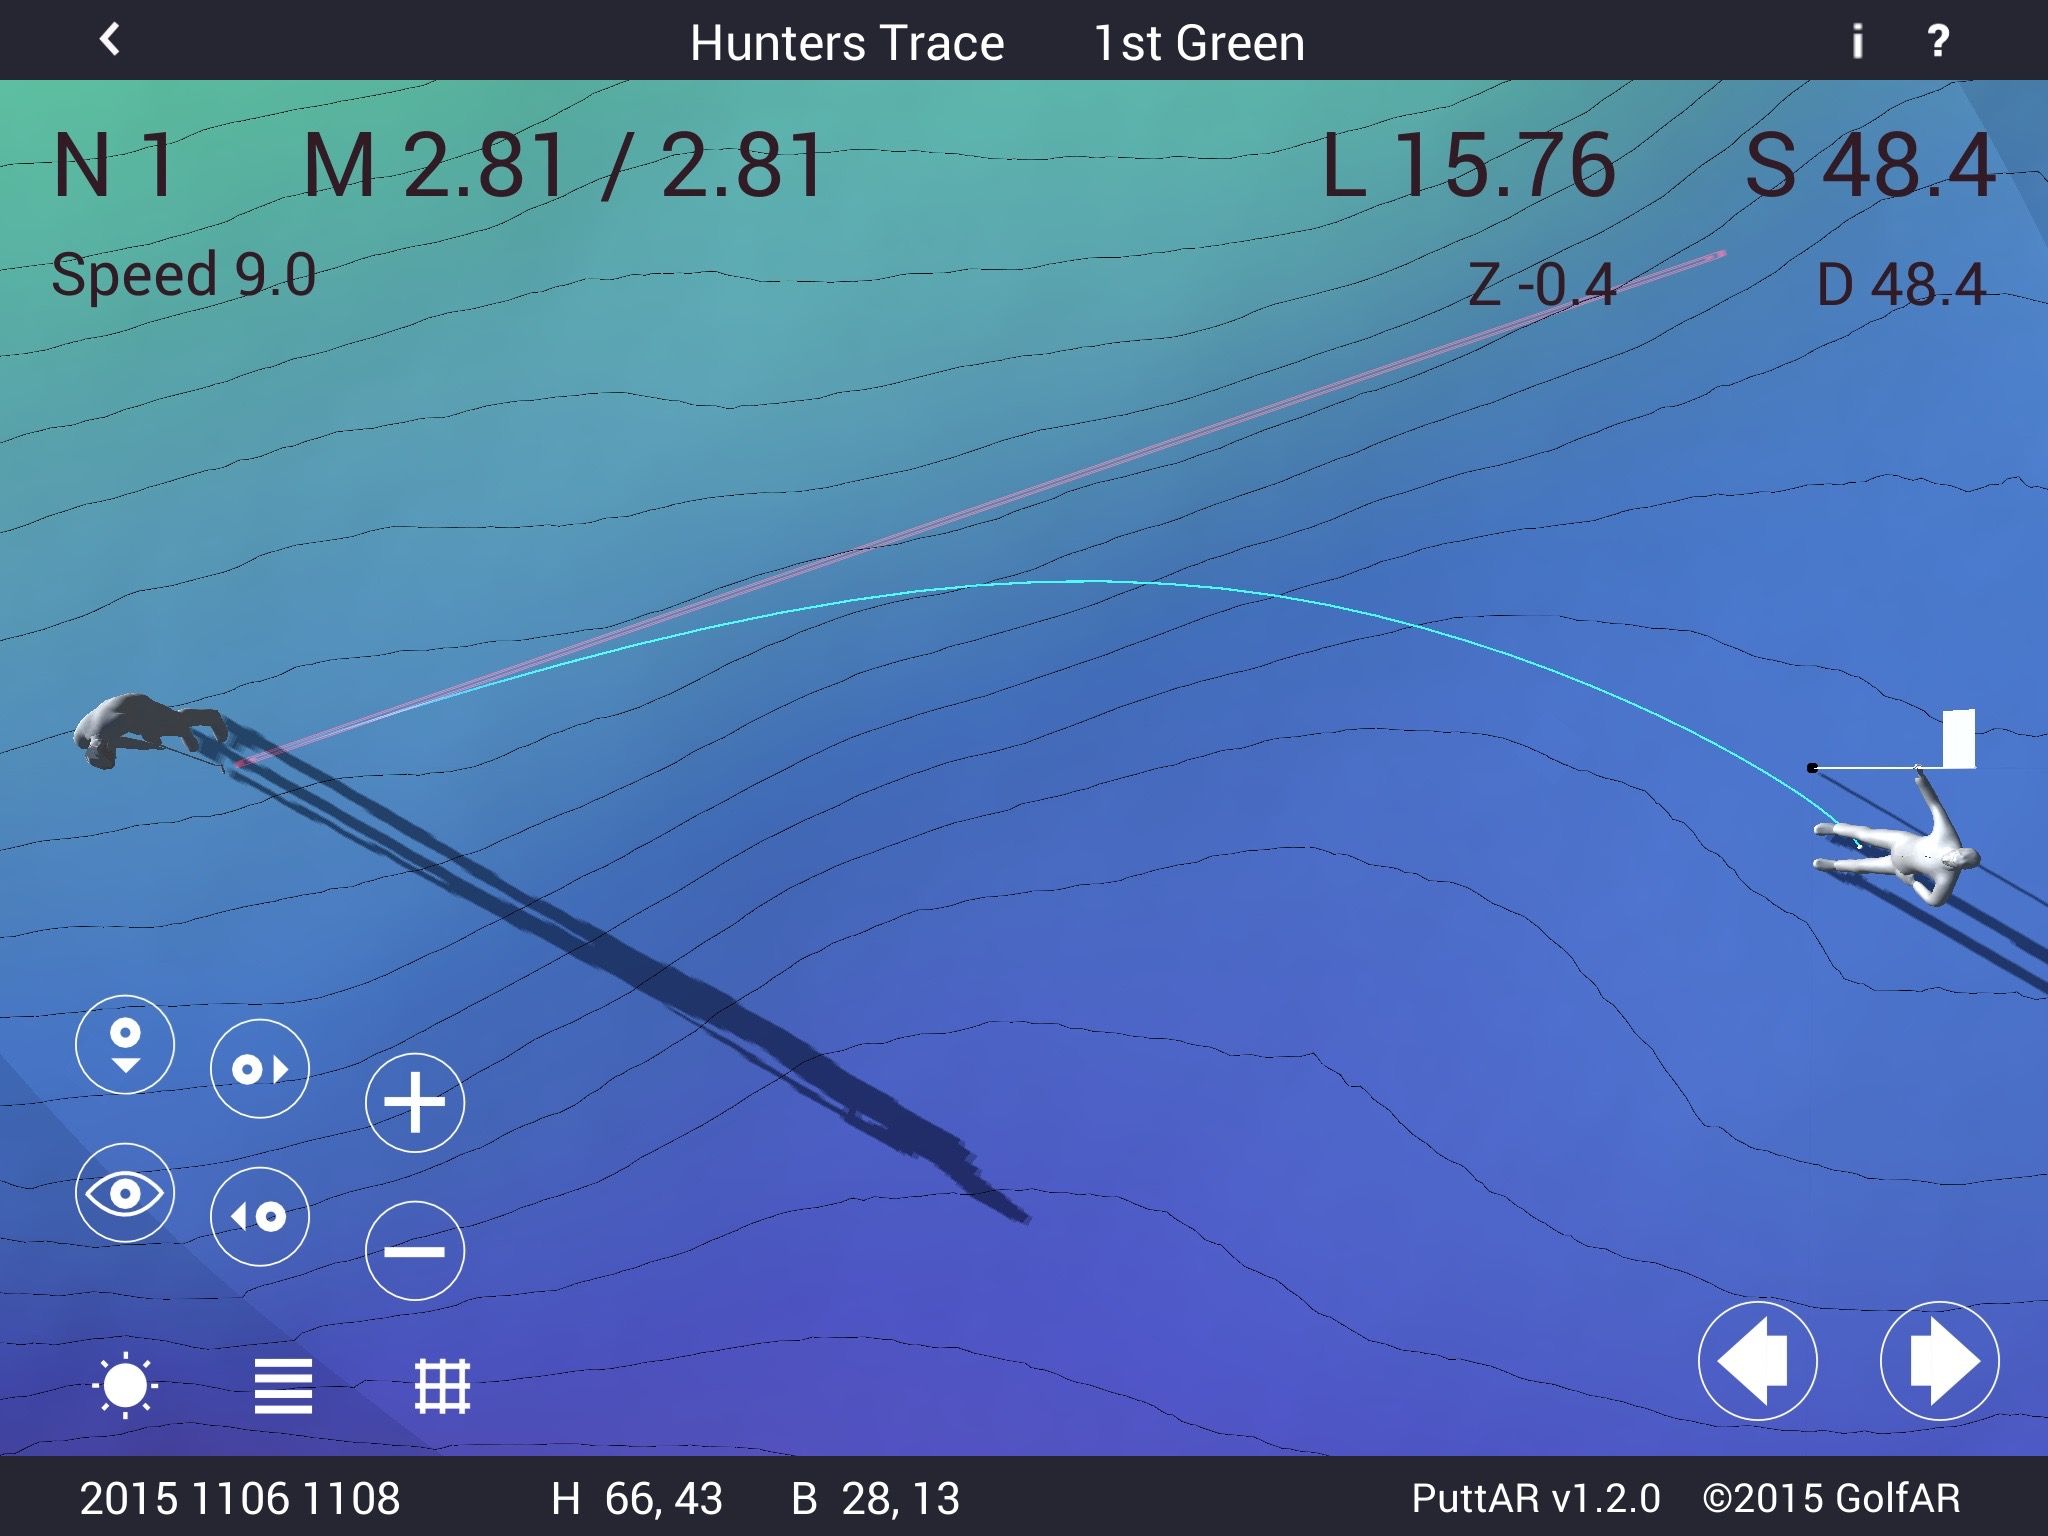
Putt-line trace on a made-putt (where miss “M” = 0′). Slope gradient texture, calculated for 1% classes. Light-yellow is 0-1%. High-definition mesh surface is required to accurately analyze slopes at this interval. This is a very difficult putt: long, downhill and cross-slope (“breaks hard right-to-left”). The simulator enables rapid multiple repetitions. Users test the surface by putting the ball across it, building their own mental model. 2015 GolfAR
While it may be fairly easy to imagine an arrow dissecting the contour line at 90 degrees, golfing adds another layer of complexity. Contour lines curve. Because fall lines follow suit and also curve, it is not a simple slope where gravity draws the ball straight downhill. Over time, app users will learn that the elevation contour line enables them to understand the flow of gravity—the fall line is perpendicular to the contour line.
Taking Simulations to the Real World
The app focuses solely on the mental game and does not ask players to pretend that they’re swinging a golf club. A graphic indicates the direction the player is aiming and an aim line that shortens and lengthens to display the power of the hit. Users execute plays with the tap of a finger on their tablet or mobile device.
Golfers can use PuttAR in practice and play mode. The practice mode allows the player to set up any shot and take unlimited putts, while the play mode enables users to test their skills in a game. There are 15 hole locations on one green for use in games, which are set in realistic locations based on the contour and slope analysis developed through laser scanning.
O’Brien explains that in the real world, course designers will move the hole each day. This procedure spreads out the wear from tracking on the green and allows for variation in play. When in practice mode, app users can set up unlimited hole and ball locations using their newfound knowledge of topographic map reading to put the flags in level areas.
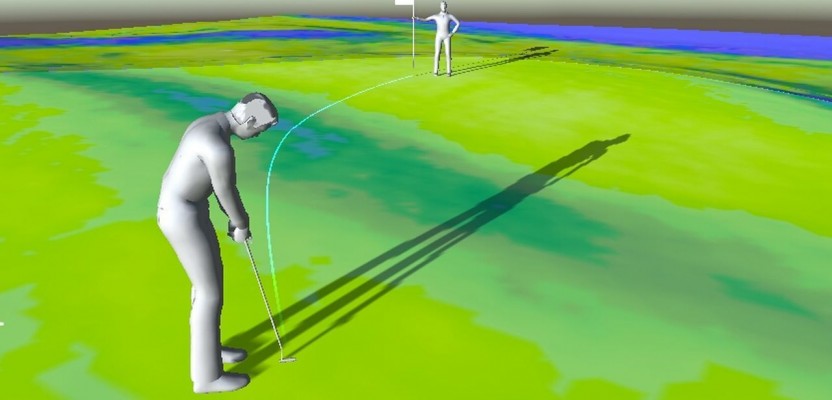
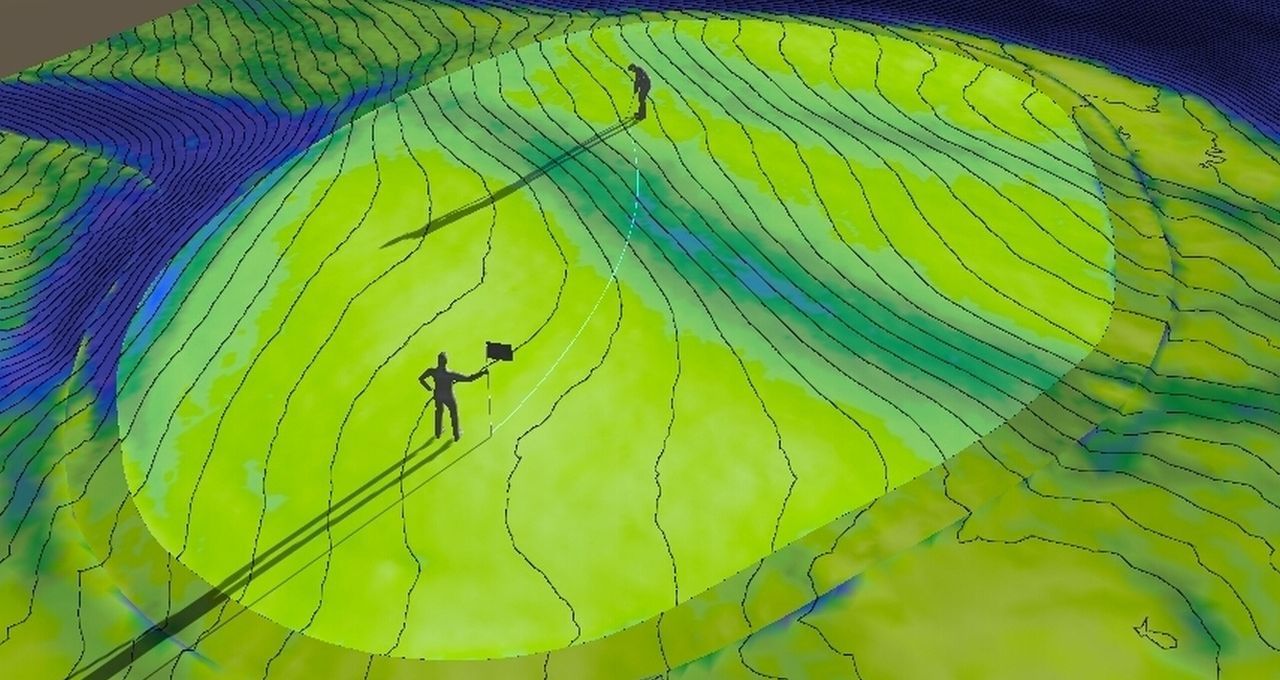
A vertical viewpoint (perspective view, not orthometric) enables users to understand the varying fall-lines of a complex surface. The elevation gradient confirms the topographic orientation of the surface. Multiple viewpoints enable users to build object-oriented mental models like the architect’s. © 2015 GolfAR
To add to the variations and learning experience, the user can also set the green speed. This option is important because, while it is intuitively obvious that green speed affects the roll and distance the ball travels, it is not so obvious that it affects the curvature of the break.
In practice mode, the golfer can play many different iterations and combinations to gain an understanding of the relationship between green speed and the break of the ball. The play mode challenges players’ skills in rounds of preset shots ranging from easy to extreme.
More than 350 different shots are featured on the single green in this inaugural edition of the app. Objective scoring provides an accurate measure of player skill and rank.
O’Brien believes PuttAR users will become expert topographic map readers and develop a general understanding of the terrain of a golf green that will transfer to real-world golf courses. “There’s a general green-reading skill that’s going to transfer to any situation,” says O’Brien. “There is also a universal putt stroking skill. Not only will users learn how a ball breaks on a green, but they will also have a better understanding of how to adjust their strokes to make them softer or harder.” In short, players will develop green-reading and aiming skills.
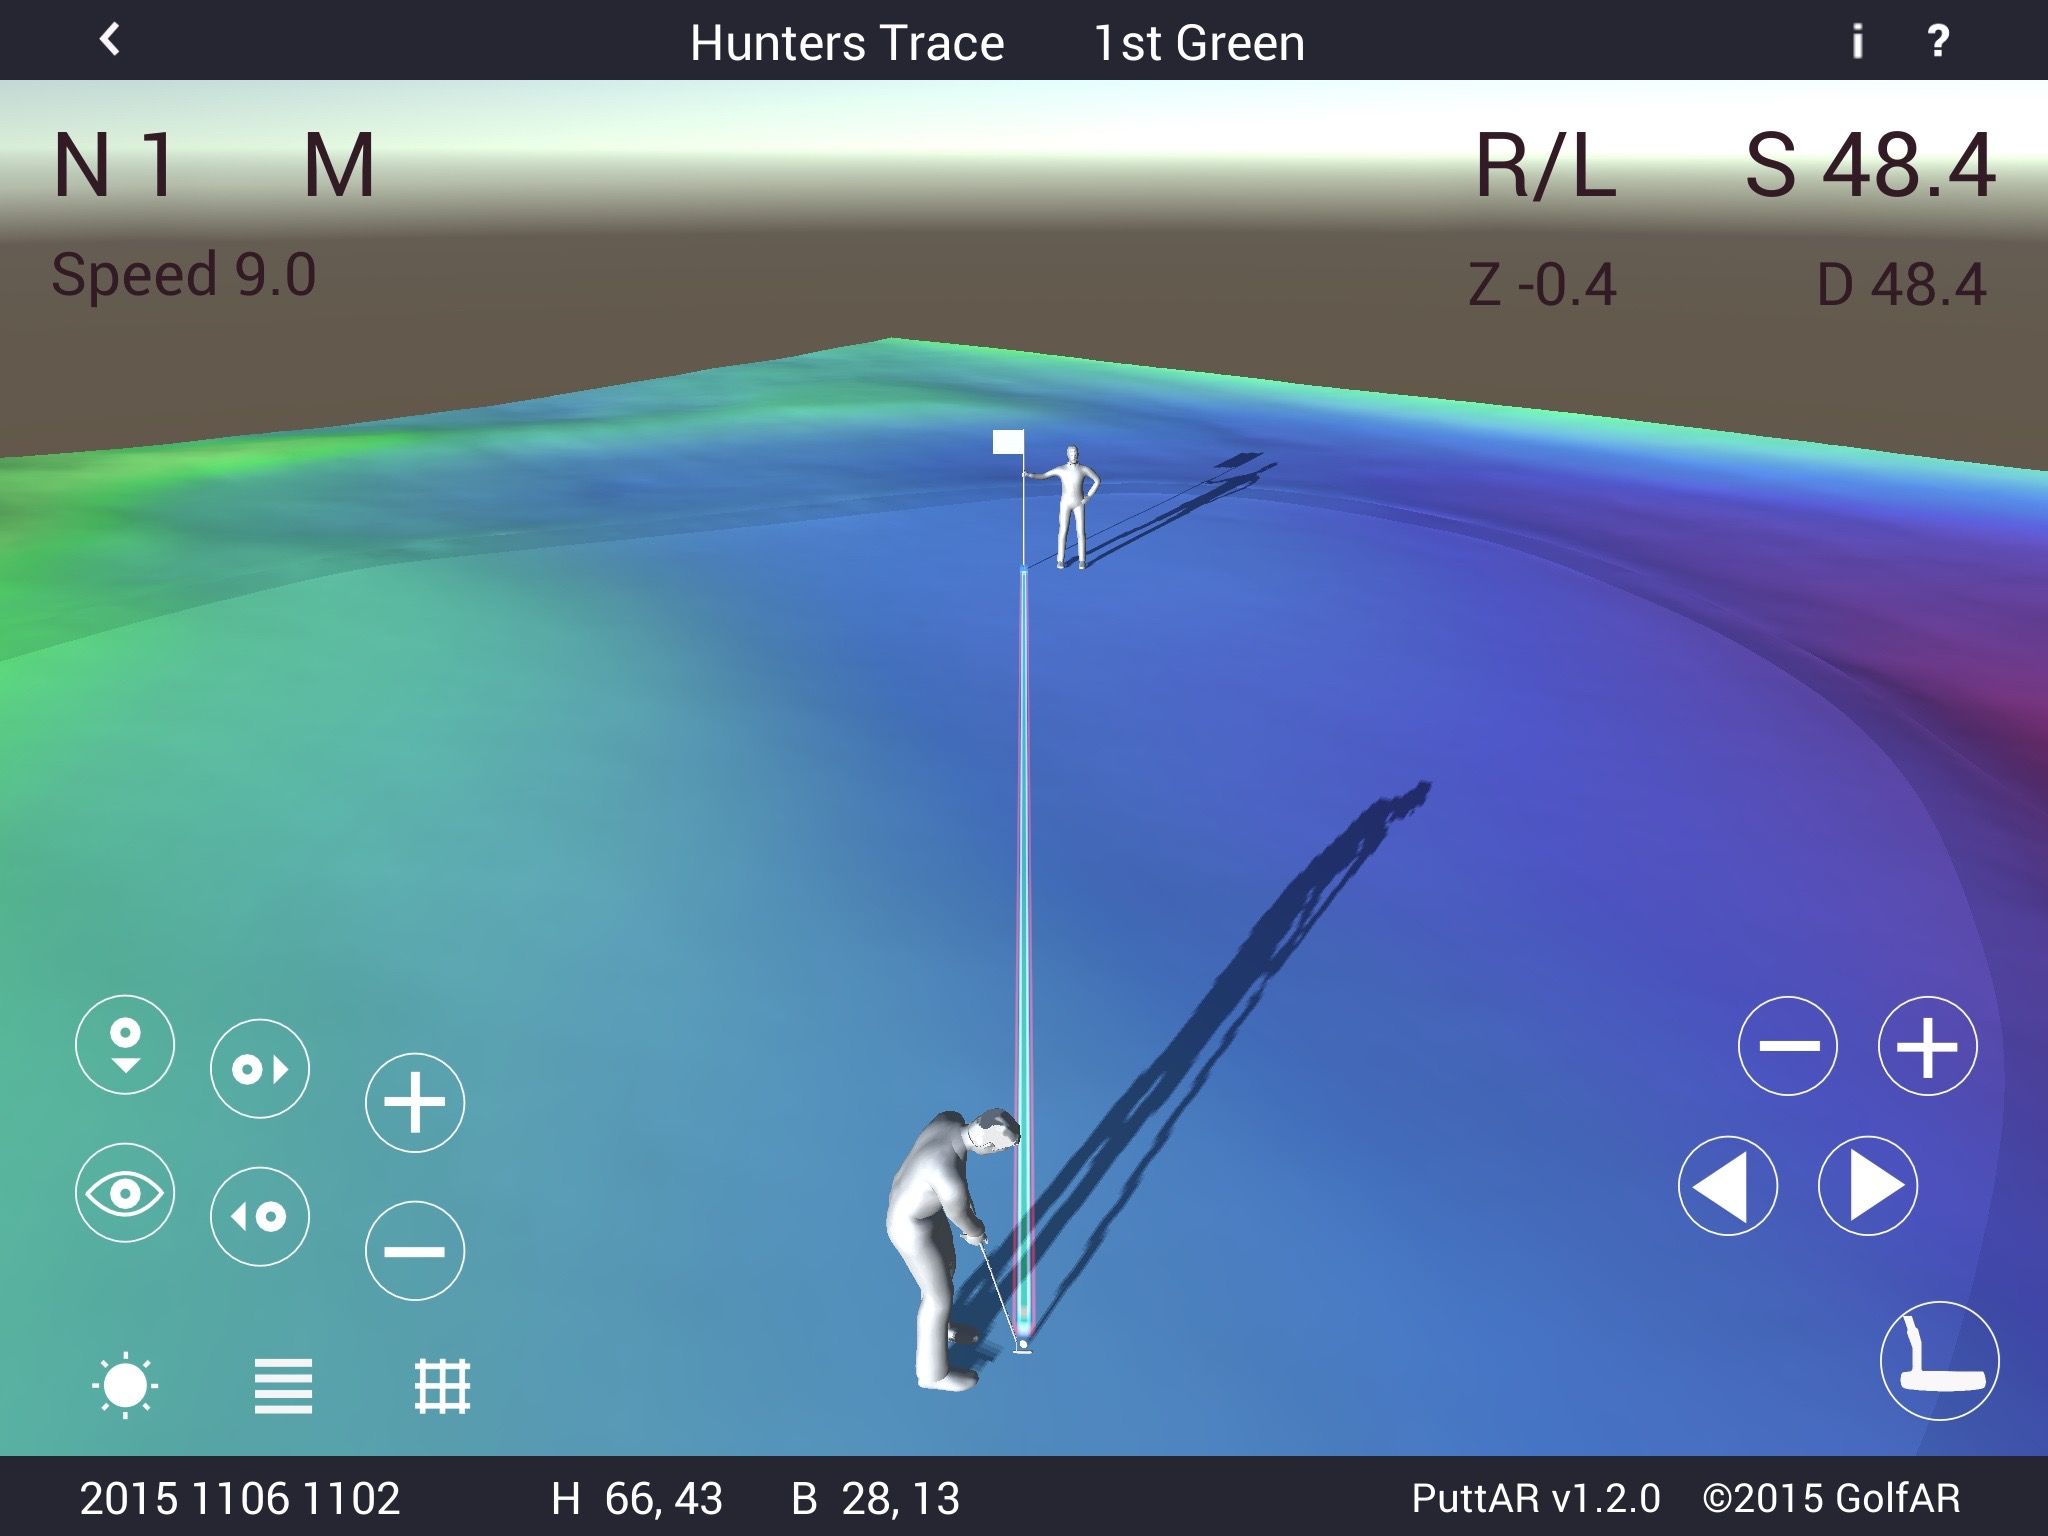
Aerial oblique viewpoints provide overview of the model-space. Slope gradients enhance the perception of the primary variable in the putting surface. © 2015 GolfAR
He adds that PuttAR will soon feature courses that players can play in real life, so they will have a topographic map they can read as they play. Thanks to laser scanning and augmented reality, amateurs will finally have the same intelligence as the pros at the U.S. Open—a high-accuracy and high-definition topographic map and the skill to read it.