Dams are some of America’s biggest and potentially most dangerous civil engineering projects, so engineers need highly accurate models of these structures for testing. In early days, this meant physical scale models made of concrete, and many dams still exist that were designed according to these practical models.
Most governments are now upgrading their old-scale models with new mathematical models, often derived from terrestrial lidar scanners with the help of computers. These mathematical models describe the dams and their surrounding rock faces much more accurately, and therefore are useful in determining how the dam and surrounding rock would interact during a seismic event, something for which the scale models could not always account.
Such is the task that faces Dr. Andrea Tamburini, president and CEO of IMAGEO S.r.l., and a world-renowned expert in geotechnical analysis. Tamburini spun IMAGEO off from the University of Turin in 2007 and made it into one of Europe’s leading survey companies for geomatic and geological surveying and analysis.
This reputation helped IMAGEO secure part of a large government contract to survey several older dams. Many of these dams, originally designed between the 1950s and 1980s, use the early scale-model approach, so IMAGEO needed to execute some as-built surveys before it could create a new mathematical model.
Of course, no survey goes off without a hitch, and the dam project encountered a serious complication with the onset of the COVID-19 pandemic. IMAGEO completed surveys for the first two dams on its 2020 list in the middle of February when the pandemic ground much of society to a halt. With the resulting restrictions on travel and closure of hotels, IMAGEO had to stop the campaign for several months. Surveying restarted in late May, cutting several months out of the schedule. So IMAGEO needed to do a whirlwind of work to cover the remaining eight dams before time ran out at the end of 2020.
Surveying with the Optech Polaris
The terms of the contract allowed each of the surveying companies some freedom in how they collected data from the dams. Some of the companies that won the contracts for other dams decided to use just traditional surveying methods, which involved a handful of field surveys on easily accessible rock near the crest of the dam. The downside of this approach is that they couldn’t survey the less-accessible parts of the gorge without climbing equipment. Instead, these firms used their limited tests at the crest to estimate the general properties of the rock around the dam.
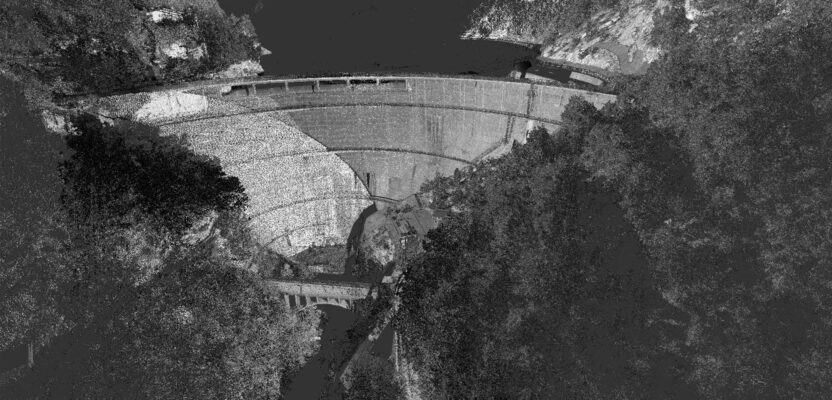
IMAGEO, however, decided to deploy the Optech Polaris terrestrial laser scanner from Teledyne to help fill in the holes in its field surveys. This scanner rapidly fires its laser at a target to measure the range using a time-of-flight technique. The Polaris spreads these pulses out over a wide field of view using a 360-degree rotating
base and a 120-degree scanner mirror, making a highly detailed 3D model of the entire dam’s morphology. This let IMAGEO easily survey an entire dam and its surrounding area, even the most difficult-to-access parts on the wall of the gorge, all from a safe vantage point.
Most of these surveys were done at ranges below 250 meters, which meant that the high maximum range of the Polaris (2,000 meters) was overkill for this particular project. Instead, IMAGEO took advantage of these short ranges to turn the Polaris up to its maximum pulse frequency of 500 kHz, letting it survey the dam section and rock face rapidly and in remarkable detail.
In Tamburini’s experience, the point spacing must be four to five centimeters to perform a detailed geomechanical characterization of the rock face. At its maximum pulse rate, the Polaris easily achieved this point spacing with only a few minutes at each site.
Another time-saving feature of the Polaris was its 360-degree rotating base. IMAGEO’s earlier TLS systems had a limited horizontal field of view, so the operator often had to make multiple surveys from each survey point to capture a full panorama, manually rotating the system between each survey.
Moreover, the operator also had to stitch together the data from these surveys during post-processing to create a single point cloud. The 360-degree FOV of the Polaris meant that IMAGEO could capture the entire panorama in a single survey, including real colors, saving time in the field and in the post-processing office.
This high survey speed was also useful because the morphology of the dam and surrounding rock did not always cooperate with the survey. Oftentimes their initial survey would have parts of the data obscured by outcroppings or other projections, so in these cases IMAGEO needed to capture the scene from multiple survey points to fill in all the gaps. The speed and minimal setup time of the Polaris meant that the addition of multiple points did not add too much time to the survey.
While the lidar was going on with one team, IMAGEO also collected additional field survey data with a second team. These included drilling boreholes in certain key areas of the rock and dam section to collect core samples and perform borehole televiewer (BHTV) logging. They also executed physical surveys, measured the roughness of the discontinuities, and checked for the presence of water. In total, IMAGEO managed to accomplish the full field and lidar survey within just three days per dam site.
Automated mapping
Back at the post-processing office, the task was to use all of these datasets to characterize the rock mass at all parts of the survey area. Much of this workflow is the product of Davide C.G. Martelli, IMAGEO’s rock mechanics expert, who took the standard rock mass rating formulas from the literature (e.g.: Hoek & Brown, 1997; Ulusay & Somnez, 1999; Cai & Kaiser, 2006; Bieniawski, 1976; Barton, 2002; Singh & Goel 1999) and used them to devise a standarized methodological approach to this characterization.
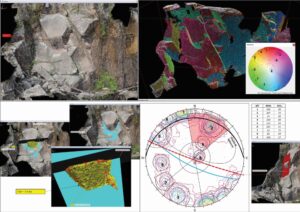
Camera-colorized point cloud of rock face (upper left); False-color according to orientation of discontinuity sets (upper right); Potentially unstable block in yellow with possible sliding surface and release plane at back (lower left); Stereonet showing the main discontinuity sets along which the release of a potentially unstable block could occur (lower right).
Considering the shortened timeframe and the large quantity of data produced by the Polaris, IMAGEO needed to automate this processing workflow as much as possible. After each survey, IMAGEO initially processed the Polaris data using its Optech ATLAScan software, automatically cleaning out the noise and vegetation to get the bare rock face. The software also allowed IMAGEO to merge multiple scan positions together using an automatic iterative closest point (ICP) workflow.
IMAGEO then imported the data into Coltop3D, specialized software from Terranum, a spin-off of the University of Lausanne. Designed to analyze the geometry of rock faces, Coltop3D automatically searched for and defined the discontinuity surfaces in the point cloud and assigned to each point the orientation of its surface.
To get a proper rock mass rating, IMAGEO needed to turn this geometrical analysis into more detailed information. However, few commercial tools exist to automate such specialized work. Instead, IMAGEO has devised its own algorithms in ArcGIS to map these parameters. These algorithms automatically map the fracture density per square meter, the length of the actual traces, the average spacing for each discontinuity set, and the persistence (i.e., lateral continuity) of the discontinuities of the rock mass, greatly accelerating the post-processing workflow.
Finally, IMAGEO combined all of this data with the borehole data and field surveys into standard rock mass rating formulas. This provided a full view of the rock mass rating and its contributing parameters over the entire survey area.
Due to the high level of automation in this process, IMAGEO could process the lidar point cloud rapidly, requiring only about three days per site. Combined with about three days actually surveying, that was a total of six days per site.
With the lidar survey itself taking up so little time, IMAGEO could focus its work on integrating all of the lidar and field survey data together, including the conventional geological, geomorphological and geomechanical studies, borehole data (stratigraphy, BHTV, core analysis), lab tests, and geophysical investigations from the physical survey.
This final integration took up to a month of office and lab work per site, which made for a tight deadline, but IMAGEO still expects to finish by the original delivery date.
Compelling results
When IMAGEO sent the initial few datasets, the government modellers were highly impressed by the level of detail and the fact that the data covered the entire dam and surrounding rock face.
Instead of a generalized characterization of the rock and dam produced by traditional methods, the modellers could see the rating of the rock masses in specific areas, letting them know which parts were prone to instability and needed repairs or reinforcement. The dam engineers could also use the laser scanner point cloud as geometrical input for their mathematical modelling.
The results were impressive enough that the government now requires the use of IMAGEO’s approach, leaving surveyors without a TLS scrambling so that they can continue to work on the dam projects. Such success indicates that terrestrial laser scanners and IMAGEO’s automated post-processing workflow are now the best practice for dam characterization and similar geomechanical surveys.