 Every state with mountains has to deal with rockfall hazards. Helping proactively manage these hazards, i.e. rockfall mitigation, can be an opportunity for service diversification for land surveyors, especially in the mapping and analysis of suspected areas of rockfall hazard. Note that land surveyors, while well equipped to collect data associated with these projects, are not wholly suited to performing the actual hazard analysis. This is a task that should be in the hands of geologists or geotechnical professionals trained in this process (see sidebar).
However, for larger firms with geotechnical professionals on staff, collecting this data could be an excellent opportunity to leverage your resources into an new service offering. For firms without these in-house capabilities, options could include partnering with a geotechnical professional or firm or simply collecting the data, saving it in a compatible format, and then transferring it to the end-user.
3D Photogrammetric Collection
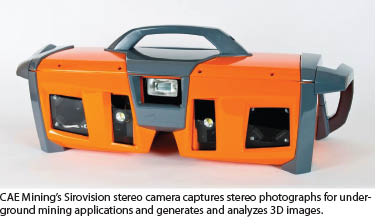
 I recently participated in a demo for a product being used for this application, CAEMining’s Sirovision. While Sirovision’s main application is mining, its open pit mining geology/geotechnical mapping and analysis technology is also well suited for hazard analysis for rockfall risk assessment and slope stabilization projects. Because the hardware portion of the technology is based on off-the-shelf digital cameras, it is an appealing alternative to 3D laser scanners.
To test the technology I traveled to Dinosaur Ridge near the town of Front Range in Morrison, Colorado, to meet with Shane Behanish, a geological consultant with CAE Mining. Dinosaur Ridge (which, contrary to its name, is disappointingly not populated with any living dinosaurs, only their fossils and footprints) is a good example of the unstable rock faces that challenge the state with the ever-present threat of rockfall. Very simply stated, here is how the system works.
Fieldwork. A safe worksite area was selected away from the roadway and overhead boulders with an unobstructed view of the subject area, in this case a typical rock face common to Colorado mountain roadways. Note that the ability to image geological structures well away from the hazards they present is an important safety consideration. 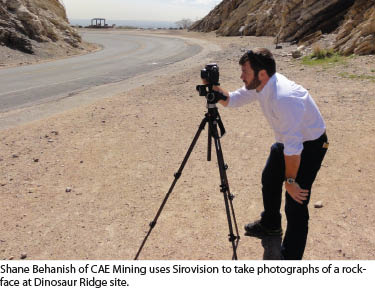 Next, a camera baseline was established by first determining the distance from the rock face and the two camera positions using a laser range finder. Then, using a 1 to 7 ratio (e.g. a 210-foot offset yields a 30-foot camera baseline), two parallel camera positions were defined and marked. Three targets were placed on the rock face for ground control points and located using a handheld GPS unit. The location of the two camera positions were similarly located with the GPS unit, as was the elevation of the camera. (For best results a professional grade tripod is recommended.) Reality capture was accomplished by stereo-paired imagery.
Using a 12.3-megapixel Nikon D300s with a Nikkor 50mm 1:1.8D lens, camera shots were taken from positions at both ends of the camera baseline. First the left-hand side images are taken, taking care to have a 30% image overlap, then the camera and tripod were moved the right-hand side position and the subject area was re-photographed with the same 30% image overlap.
During this process each image filename was carefully noted for reference to assist in the follow-up processing. The team at Sirovision emphasized the need for careful and complete field data collection, a warning I am sure is not lost on land surveyors.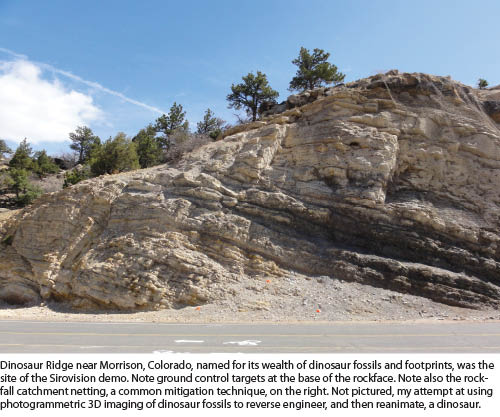 Post processing. Post processing was accomplished using Sirovision version 5 software. Very simply, the process is as follows: first the rockface stereo pair photo images and GPS survey data file were imported. Creation of the 3D images can be accomplished either automatically or manually. Georeferences were added to the imagery using the data collected on site. The images are then combined into a mosaic; this is where the 30% overlap comes into play.
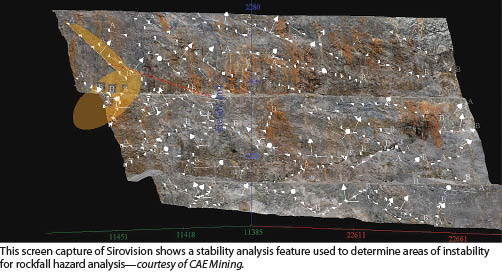
Once the mosaic is complete, the software’s robust structural mapping and analysis tools come into play. In the case of rockfall hazard analysis, the stability analysis tool offers automatic wedge detection; “wedges” are an indicator of possible future failure (refer to sidebar). File export formats include DXF, ASCII (survey data), and a variety of other formats compatible with mining software programs.
System Training
Knowing my (let’s just say less-than-optimal) photography skills, I wondered how much training the typical land surveyor might need to use this system. Shane responded, “It is very easy to teach someone this system. The course is three days, and all that is required is basic knowledge on how to use a digital camera. Technical staff can be trained to take photographs and generate 3D images. Plus, the software is becoming increasingly automated.”
Accuracy Enhancement
 The GPS equipment used in the demo was standard, retail-grade quality which provides the accuracy expected with that level of technology, say approximately three meters. Depending on end-use requirements, land surveyors have the capability to vastly improve accuracy levels using survey-grade technology.
Market Approach
For those surveying firms in areas where these hazards exist, this could well be an opportunity to expand into a new service. If you are already doing DOT and/or roadway projects, you have a foot in the door. For those who don’t, take some time to research this opportunity and the enabling technology behind it (the sidebar below has some excellent resources),
then develop your market approach.
One possibility is to employ a speculative approach similar to the one used by Severn Partners as described in “A Strategic Shift to Ship Scanning” in the April 2013 issue of PSM. Develop a test case using this technology and present the results to your potential end-users.
Speaking of end-users, while we typically consider roadways when we think of rockfalls, other entities can be at risk as well, including transportation (think railroads), infrastructure entities (think transmission lines), and even housing subdivisions and resorts. One needn’t limit one’s thinking to DOT agencies while developing market approaches.
SIDEBAR 1
Geotechnical Aspects of Rockfall Hazard Analysis
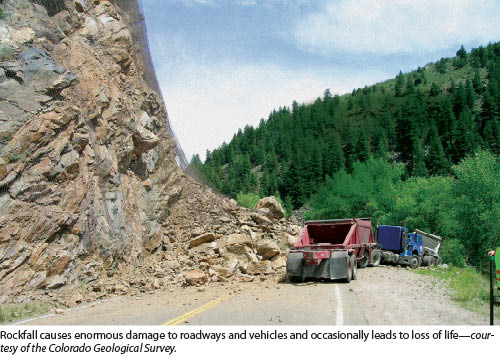
There are four categories of rockfall events: rockfall, rock topple, rock avalanche, and rockslide. For the sake of simplicity I aggregate these into the overall term of “rockfall.” Rockfalls are a subset of landslides and are geologic hazards that occur across the country, most notably in mountainous regions, causing a variety of significant impacts ranging from traffic disruption to damage to roadways and vehicles to (thankfully rare) fatal accidents. In my state of Colorado alone, there are more than 750 locations statewide recognized as having chronic rockfall hazards.
Actual mitigation methods, such as rockfall catchment systems, are beyond the scope of this article, as are high-level risk assessments to gauge the larger areas where these hazards exist. Rather, I focus on in-depth hazard analysis once these areas have been defined.
Once potential rockfall hazard areas are mapped, the resulting data can be examined for potential signs of instability. Shane Behanish explains: “Geotechnical professionals look for fractures, joints, faults, and discontinuity sets to predict slope failure. By doing structural modeling and calculating fracture frequency, they can detect unstable ‘wedges’ that might fail in the future. Geotechs are also continuously monitoring slope movement to assess risk.”
SIDEBAR 2
Learn More
An excellent technical paper that illustrates examples of projects employing 3D photogrammetric technology for rockfall mitigation is “Digital Outcrop Characterization for 3-D Structural Mapping and Rock Slope Design Along Interstate 90 Near Snoqualmie Pass, Washington” by William C. Haneberg, Norman I. Norrish, and David P. Findley.
A second is “Photogrammetric and LiDAR 3-D Rock Slope Discontinuity Mapping and Interpretation Surveys to Improve Baseline Information for Supporting Design and Construction of Capital Improvement Projects at Hydroelectric Facilities” by Kimberly Pate and William C. Haneberg. This paper is interesting because the issue of rockfall is not limited to roadways alone, and a comparison is made between the competing technologies of 3D scanning and 3D photogrammetry. Both of these technical papers are available on Sirovision’s website.
At a more local level, an excellent resource is your state’s Geological Survey, usually a department under your state’s Department of Natural Resources, and of course your state’s Department of Transportation.