A decades-old law requires U.S. states to regulate billboards along the nation’s highways. An Illinois engineering consulting firm recognized the challenge as an opportunity to use GIS and mobile mapping to create added business.
The great American road trip begins in Illinois. The nation’s most famous highway, Route 66, originates in Chicago and travels southwest, ending in Los Angeles. It’s designated as a scenic highway and serves as an iconic reminder of the nation’s most popular form of travel. For decades, families and visitors have used America’s well-developed web of highways to travel for vacations, business, and holidays.
As travel by car increased, so did the number of advertising signs and billboards lining the highways. Concern mounted that the uncontrolled growth in number and size of signboards would obscure the views of the landscape. To manage this, in 1965 Congress passed the Highway Beautification Act (HBA) that regulates outdoor advertising signs along the U.S. highways.
 Enforcing the law fell to the individual states. One aspect requires state departments of transportation (DOTs) to maintain accurate inventories of signs that are subject to audits by the Federal Highway Authority (FHWA). If a state fails to meet federal requirements, it risks losing federal funding for its highway programs. That can be a substantial amount of money, so states work diligently to comply with the law. But it’s not easy. Signboards are spread along thousands of miles of highways, and they can easily be changed and moved. The DOTs have limited funding for the inventory work, and old techniques for manual location and inspection are unable to efficiently handle the job.
A New Database for Illinois
The Illinois Department of Transportation (IDOT) manages roughly 16,000 miles of highways and has an estimated 22,000 signs subject to the HBA. IDOT is divided into nine administrative districts, and for years the signboard data was collected at the district level. Within each district, a signboard coordinator was responsible for permitting and record management for new and existing signs, and the district’s field staff conducted physical inspections of individual signs.
With an average of 2,000 miles of highway in each district, the effort to conduct the inspections consumed a lot of time and resources. At risk of becoming saturated with data, IDOT needed to find efficient and cost-effective means to manage the inventory, maintain accurate records, and identify illegal or unpermitted signboards across the state. IDOT decided to consolidate the work and centralize the sign database, which called for an updated physical inventory of existing signs. After some analysis, IDOT decided to outsource the work to capture and implement the new, modern inventory.
 Following a process of competitive proposals, in November 2010 IDOT selected Hanson Professional Services to provide a three-year program of signboard inventory services. Based in Springfield, Hanson provides consulting engineering in the transportation, civil, commercial, and energy sectors. For this project, Hanson’s work consisted of capturing initial data, verification and management of the signboard database, ongoing change detection, and permit evaluation. The objective was to produce a modern inventory, based on scanning and input of existing records, that accurately reflected the situation on the ground.
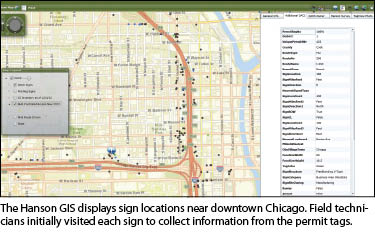
In order to handle the project efficiently, Hanson decided to use a combination of GIS and mobile mapping technologies. According to Hanson assistant vice president Gary Rogers, PLS, the firm used GPS data, stored in a GIS, to capture and manage positions of the signs. The GIS also contained other data, including photos, permitting information, and county and IDOT district information. Some information, such as permit tag numbers, could be obtained only by visiting each sign. Other data, including sign dimensions, milepost, and offset from centerline, could be better handled using mobile mapping. Together, the two technologies could check and supplement one another, enabling Hanson to establish the sign database for subsequent years.
Satellites, IMU, and Wheel
Surveyors are keenly aware of the skill and care that must be applied to achieve high-precision positions on static features, and this is with surveying instruments and targets mounted on stable tripods. Imagine how difficult it is to fix positions while your surveying instruments are mounted on a moving vehicle, airplane, or marine vessel. Mobile mapping presents such a challenge.
Vehicles carrying multiple calibrated cameras, as in the IDOT sign inventory, are taking thousands of images in rapid succession—and knowing the position and orientation of each camera at the precise time of each image capture is critical. In the case of mobile lidar, this may involve millions of discrete positions determined per minute. How is this accomplished?
Many surveyors are including moving elements in their otherwise static observations already: the GNSS satellites. If an object is moving on a tracked trajectory, the determination of any point along such a path is a function of precise time. Most mobile mapping operations use GNSS for coarse or high-precision positioning; dual antennas are deployed to provide orientation, and RTK is enabled via temporary base receivers or real-time networks. But GNSS alone presents challenges. The GNSS observations may not be frequent enough to smoothly define a trajectory of the cameras or lasers. Real-time GNSS may also experience interruptions due to roadside canopy, bridges, or tunnels. A little help is needed to fill in the gaps.
The synchronization of an inertial measurement unit (IMU) with GNSS real-time kinematics (RTK)—as in the Applanix POS LV mobile positioning system for land vehicles used by IDOT contractor Hanson—forms an integrated IRTK system (Inertial RTK). The inertial component, which includes IMUs for rotation measurement and accelerometers for force, completes the definition of the trajectory and reduces the time needed for GNSS re-acquisitions.
But inertial components are subject to drift over time. Older systems required stopping to reset the integrated systems, but with the addition of a wheel-mounted disk, tracked with a laser, a precise velocity is added to the solution, eliminating most re-initializations.
The images or lidar shots from mobile mapping systems can maintain high relative precision through the synchronization of these components, and they are registered to control references by GNSS. Accurately positioned targets are often placed along mapping corridors to supplement registration if desired for specific mapping projects.
There is also a post-processed version of network-RTK for situations where the real-time communications required for “live-RTK” are unavailable or unreliable. On a step up from conventional single-base post-processed kinematic (PPK), Applanix has a technology called SmartBase that performs a “rewind” of some kind of the processes used in a VRS network RTK solution. This processes observations from the GNSS receiver of the mobile system together with the modeled solutions from a local VRS network.
GIS, Mobile Mapping, and Information Management
During the first year of the project, Hanson developed an accurate baseline inventory of the conditions in the field, which included a physical visit to each sign. “We had to go to the signs in the first year to see if they were tagged,” Rogers said. “The tags are small and may be covered with vegetation, so they cannot be read by the mobile systems.”
Hanson used a combination of in-house personnel and subcontractors for the data collection. Each technician was equipped with a Trimble GeoXH handheld GPS receiver. Working alone, the technician would drive an assigned route, stopping at each sign. In some cases, signs were as much as 1,000 feet off the road, which made it necessary for the technician to walk and climb fences to access the sign. Once there, he or she collected specified information including GPS position and digital photos. Most signs carried a metal tag with additional data regarding the sign’s permit number and type. The technician recorded this information as well as notes about the sign’s condition and owner.
On a typical day, each technician could visit and collect information on roughly 50 signs. “We developed a training manual for the field crews,” Rogers said. “This included safety procedures and instructions on how to collect the needed information at each sign.” In districts where they used subcontractors, Hanson provided the handhelds and sent a Hanson crew coordinator for a week on site to bring the crews up to speed. Each day’s data were downloaded and sent to Hanson’s office for checking and processing. The results were then added into an Esri ArcGIS geodatabase.
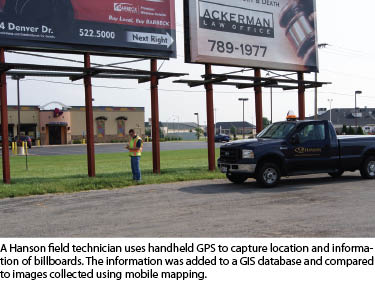 Next, data verification required Hanson to compare the data from the physical visits to the signs against independent measurements. To do so, Hanson needed a method to rapidly obtain high-quality positions and images along the highways. The solution came from mobile mapping systems that combine GPS positioning with distance measurement instruments and digital cameras to capture georeferenced images while traveling at highway speeds. After reviewing the capabilities of various systems, Hanson selected a Trimble MX1 mobile data capture system accompanied by Trimble Trident Analyst software. After installation and testing on a dedicated vehicle, the mobile system went into production in February 2011.
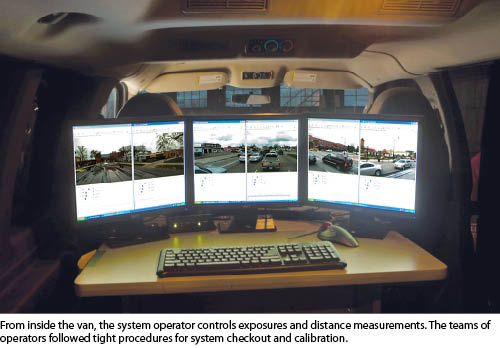
A typical day for Hanson’s mobile mapping system began in the van’s climate-controlled garage in Springfield. A two-person team checked and calibrated the equipment and computers on the van and then departed for the day’s assigned route. Because Springfield is located near the center of the state, most routes could be covered in one day, with the crew returning to Springfield to close out the files and download the data to portable hard drives. The “out and back” routing reduced costs for overnight stays and helped with crew rotation.
Following routes designed by Hanson’s GIS staff, the vehicle can collect data on roughly 400 miles per day, with the system configured to capture images every 33 feet. Rogers said that driving and operating the system is demanding work, and that it was important to keep the team fresh while maximizing the use of the mobile system. To do this, Hanson trained four sets of driver/operators and rotated the crews to keep the vehicle busy. In the first two years of the IDOT project, the mobile system operated for 85 days each year. “If the weather was good, we were running,” Rogers said. Over the course of two years, the van collected data along more than 35,000 miles of highway.
The Hanson teams quickly learned about the challenges in designing a day’s route for the mobile mapping system. In addition to covering the needed roads and highways, they had to consider fuel consumption, hours of daylight and—importantly—the lighting conditions related to sun angles and cloud cover. They worked to avoid deadheading, in which the vehicle drives a stretch of road without collecting data.
Work on divided highways such as the federal interstate system went quickly. “Because of the separation between the two roadways, we needed to drive the route in both directions,” Rogers explained. “But the work went quickly because of the distances that could be traveled in a day. We could collect all the needed data in a simple out-and-back route with no delays due to traffic.” Because the mobile system has multiple cameras that face forward and backward, the team typically needed just a single pass to collect the needed data along smaller, two-lane highways.
At the end of each day, the images and GPS data were transferred to Hanson’s office in Springfield. When the van needed to spend the night away from home, the teams simply shipped the portable hard drives containing the data to Springfield. In the office, technicians processed the field data to develop corrected positions for the route. The GPS information, augmented with data from the van’s onboard inertial measuring system, produced the camera position and orientation for each image.
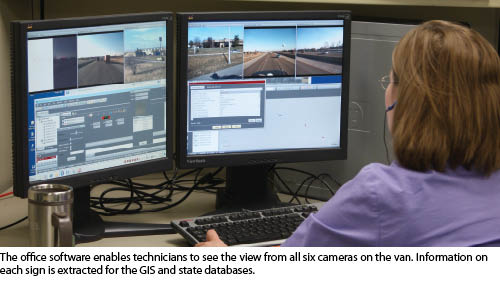
From there, the datasets were assigned to one of six office technicians, known as the “extractors.” Using Trimble Trident Analyst software, an extractor would inspect each photo and pull the position and information for each sign, adding notes on the content and condition of the sign. Using the dimensioning and georeferencing capabilities, the extractors could determine the sign’s dimensions and its distance from the highway centerline. Finally, the completed information was moved out of the software and married with the field GIS data.
Even in the face of the many signs to process, the office work went smoothly. In production mode, an extractor needs about five minutes to develop all the information for a sign. Hanson owns six licenses for the Trident software and works to keep them busy. During the IDOT project, the company ran night and weekend shifts for the extraction teams.
As part of the project management, Hanson created an internal website for its teams to provide a single location for information on routes and project status. Each field team carried an iPhone equipped with a customized app for the work. For sign inspections, work locations are assigned and uploaded to the phone, which then helps the crew navigate to the desired sign.
Preventing a New Type of Rework
The mobile mapping systems produce enormous quantities of images and related information that must be organized, processed, and analyzed. (In a typical day of driving, the six-camera system can collect more than 380,000 images.) In addition to Trident Analyst, Hanson uses Esri ArcGIS and engineering software packages and conducts heavy interaction with the IDOT databases.
Rogers said that despite the load, they did not have to make big investments in information systems. As work progressed, Hanson could use its existing information technology infrastructure to manage the large datasets. And by storing the field data on portable hard drives, they did not need to add new storage capacity or servers.
 One challenge in working with the large datasets is simply the time needed to load data from the portable hard drives. Loading and processing a data set more than once could be as costly as a revisit or other rework. To avoid reloading the data, Hanson developed consistent processes for extracting and using information. “It’s important to make sure all the people in the office are extracting in the same way,” Rogers said. “Just like in the field, we developed a manual for the extractors. It was an evolving process. We’d discover something new, adjust the manual, and make sure everyone was in sync.” In the van, the mobile operators worked to maintain proper camera exposure settings to avoid overly dark or light images that couldn’t be used in the office.
At the end of the first year of the contract, Hanson had completed and verified the IDOT sign inventory. The information was added to the state database, where signs can be compared with the existing list of permits to identify any discrepancies or illegal signs.
As the contract moved into its second year, the effort shifted to change detection and database maintenance. “The data collection in the first year resulted in a robust inventory of controlled signs and their locations that were then compared with IDOT’s permit database,” Rogers said. “In the contract’s final two years, we can rapidly review any changes to the inventory to review compliance with the Highway Beautification Act.” The permit review includes checking on sign sizes and spacing and their distance from the highway right of way as well as ownership, zoning, and compliance with permit rules. Permit coordinators will also use the updated imagery to look for new signs.
Rogers is convinced that the mobile technology is the key to the project’s success. The ability to combine GIS information with data from mobile mapping systems played an important role in the team’s success. Without the ability to efficiently gather and process large volumes of data, the work to validate the GIS data would have added significant time and cost to the sign inventory.
But the technology provides benefits that go beyond the financial aspects. The mapping systems eliminated much of the need for surveyors or technicians to stop and work along the state’s busy highways. This resulted in a lower risk of accidents and increased comfort and safety for the field personnel.
The flexibility of mobile mapping makes it appealing for other Hanson projects as well. Rogers looked at mobile systems that include lidar in addition to imaging, and he feels that their initial investment is a good choice. He cited the suitability of the mapping systems for transportation-related clients in rail, roads, and aviation. And by tying the positioning technologies to fathometers and side-scan sonar, Hanson brings mobile mapping to its hydrographic surveying operation. Municipalities can benefit from mobile systems by using either GIS- or survey-grade sensors for asset management and inventories.
“It’s an incredibly important technology,” Rogers said. “We can collect high-quality data while moving at highway speeds. It’s fast, safe, and accurate.” The next time you travel on Route 66, remember that mobile mapping is helping to keep America’s scenery in view.