Last year, the Surveyor General Branch of Natural Resources Canada released a web application that provides public land survey information on Canada Lands to any interested party, the Canada Lands Survey System – CLSS Map Browser.
We know it was quickly embraced by the land administration community based on anecdotal evidence from phone conversations and email messages. The following is a brief description of insights and experiences we gained while implementing and operating the application that we believe will interest a larger audience.
Recording plans and providing information from surveys conducted on Canada Lands to the public falls under the mandate of the Surveyor General Branch. Canada Lands include most of the area in Canada’s northern territories (the Northwest Territories, Nunavut and Yukon), more than 3,000 Indian Reserves across the country (about 13,500 square miles), all of Canada’s national parks, and Canada’s offshore waters that are outside of provincial jurisdiction.
In this article, I focus on four points that may be of interest to others:
- It’s easier than ever to create spatially enabled web applications, including applications for the survey community;
- basic and advanced information can easily be provided—from simple spatial data display to sophisticated database queries;
- applications may fulfill rather unexpected needs; and
- web applications can help to increase database integrity.
Creating A Web Map
Creating a spatially enabled web site is now easier than it has ever been. Even a mere five to ten years ago, it was still rather difficult to write computer code for web mapping applications. Computer programming languages for web development were usually less popular than other languages in general usage.
Today’s environment is quite different: Powerful web mapping applications can be developed using only HTML5 and JavaScript—both languages widely used around the world. Implementations are convenient and efficient because of readily available application programming interfaces (APIs) and style sheets (called a Cascading Style Sheet [CSS]). Programming languages, in turn, adhere to widely adopted international standards and make programming much easier.
To top it all off, the software components are accessible to everyone free of charge, even though many are commercial products. No extraordinary training is required as many people are familiar with HTML5 and JavaScript. For example, the ArcGIS API for JavaScript from ESRI provides an extensive toolset for programming very simple solutions to very sophisticated applications, and each CSS enhances the user’s web mapping experience.
We posted a sample HTML page that depicts a fictional survey in San Francisco on GitHub. The complete sample includes merely 50 lines of code, and the page can be sent to and viewed by anybody with a web browser for a quick review (Figure 1).
Web mapping provides spatial and attribute information. While all larger mapping applications run big databases in the background (that is, databases that are housed on servers), it is also possible to store spatial data right in the application itself if required or if back-end databases are not available. A few hundred lines of computer code can easily accommodate hundreds of point/line features with a multitude of attributes.
Furthermore, the technology has matured to the point where additional attribute information from external databases or spreadsheets can be linked to the spatial features that are displayed in the application (Figure 2).
Also, data can be updated over the web; even spatial information can now easily be manipulated through web mapping.
User Feedback
Once our application was operational, we learned from user feedback (extensive anecdotal evidence from phone calls and e-mail messages) that our application was used beyond our main intent as a research tool for surveys on Canada Lands across the country.
Users also employed our tool to produce maps, even though this functionality was very limited in our first release: the print function made a screen dump of the current view, inserted a user-provided map title, a north arrow, and the print date. We had included this capability merely for a quick convenience to users, never expecting heavy use of printing for the express purpose of map making. But that is exactly what happened.
Based on the feedback, one-third of users are non-surveyors using our website for convenient parcel mapping, particularly in early stages of parcel mapping.
Some feedback centered on the poor image quality. In response, we enhanced mapping capabilities significantly. We introduced better mapping quality, user-defined scaling, and map rotation. The resulting map is presented in PDF format that users can print or save to their liking. User feedback has been overwhelmingly positive.
Quality Control
 Last but not least, web mapping is an invaluable vehicle for additional quality control of our data. Our application includes a link that permits users to conveniently provide feedback to our office.
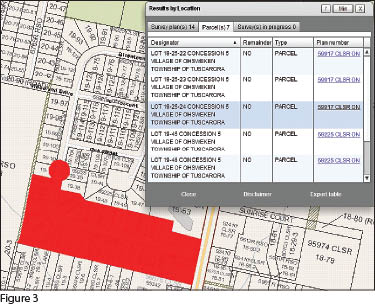
Interestingly, we receive frequent comments on data issues. Our database includes several tens of millions of pieces of data that are updated daily. Understandably, mistakes are made; errors slip through the system, even though we employ rigorous quality control routines. Users have access to data through the web application (updates are reflected on a 24-hour basis), and they can download data in various formats. We found that this presence of current data encourages users to “keep an eye” on data correctness (Figure 3).
It turns out that this is an invaluable service to us. Every night, we run extensive quality control routines to ensure the integrity of our spatial data; we also verify attribute consistencies through overlay analysis wherever possible. Yet, attribute information cannot always be verified analytically. That’s where user feedback is invaluable. The web mapping application—because it’s visual—provides a great symbiotic environment between data producers and users.
We believe that the effort of developing a web mapping application, regardless of its complexity, is easily offset by the advantages that an organization can glean from operating such a tool.
Website Resources
GitHub
https://github.com/glangen/Survey/blob/master/survey.html
Canada Lands Survey System
CLSS Map Browser
http://clss.nrcan.gc.ca/map-carte-eng.php
*Canada Lands includes aboriginal reserves, federal parks, the three territories, and the part of the offshore that is not under provincial jurisdiction.