A software team creates a large-scale, structured, urban reconstruction system that handles multiple data sources with deep learning.
Today, big data is ubiquitous: we have more information than ever, but combining and understanding all this data has become the challenge. This is particularly true for 3D cartography as we view our continually changing world with ever-improving sensors.
Our research group set out to tackle this problem. We are Niloy Mitra and me from University College London; John Femiani from Miami University, Ohio; and Peter Wonka from KAUST, Saudi Arabia, and our project is called BigSUR (a partial acronym—see the subtitle of this story).
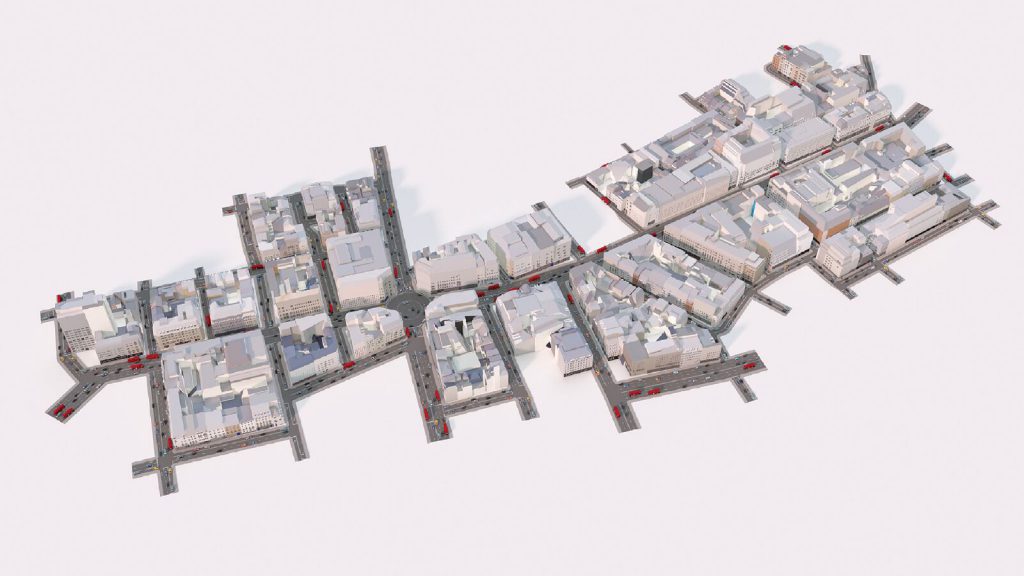
A reconstruction of the area around Oxford Circus in London.
Coming from a computer graphics background, our team was struck by the difference in quality between recent advances in virtual environments (such as video games and virtual reality systems) and the reconstruction in the cartography community. Video games contain high levels of detail such as windows, wall colors, and a variety of geometry; because each building is typically created by a team of artists, a huge amount of time can be spent creating these features.
We wanted to find out if we could use multiple data sources to improve the reconstruction of urban environments and close the gap between geospatial visualization and state-of-the-art virtual environments. The goal of the BigSUR project was to combine multiple data sources into a single, clean, city block representation.
Given 2D building footprints, a low-quality mesh, and street-level imagery, our system creates a detailed, semantically structured model of the building exterior. Our resulting model is a clean low-polygon, labeled with features. For example, we know which surfaces are walls or roofs and the locations and sizes of the windows.
Our resulting meshes can be used in applications such as energy simulations, privacy calculations, and detailed visualizations.
Data Sources
Combining multiple data sources is challenging because each comes in its own coordinate reference system, with different types of noise and accuracies. BigSUR weighs all these sources to find a plausible mesh that is supported by each source of information.
The first data source is the building footprints; these are ubiquitous and offer localization and regularization. However, footprints contain accurate information only at ground level; they become less accurate with height. Simply extruding them to the height suggested by the mesh often gave inaccurate and unrepresentative results.
The second data source, 3D meshes, are typically reconstructed from airborne photogrammetry or lidar. These meshes contain noise or have holes, but they offer a coarse-scale sketch of the volume.
In contrast, the final data source is street-level imagery (such as Google Street View), which gives detailed information but over only portions of the structure. For example, images may be obscured by trees or vehicles, or internal courtyards may not be accessible at all.
Deep Learning
Processing each of these data sources is challenging. For example, it’s easy for humans to answer questions about the contents of street-level imagery like, “Where is the door?” “How many windows?” or “What color is the wall?” But computer programs haven’t had a robust way to answer these questions until recently. Because photos of façades (especially those found from bulk geolocated panoramic cameras) contain irregularities such as dirt, shadows, and reflections, no one had found a way to make a flexible enough computer program to be useful.
In the last few years, deep learning has revolutionized how we approach these problems. John Femiani, the team’s vision expert, used thousands of facade images to train a deep neural network. From these examples, BigSUR learned how to identify windows with an accuracy of 96%; this was 23% better than previous systems.
This accuracy allows us to use the facade boundaries from street-level images to help decide where building boundaries should be, and, once we have the building masses, allows us to decorate them with windows, doors, balconies, and wall colors.
Of course, the system is only as good as the examples it has seen; different styles of architecture require more examples to learn from. For example, the neural network hadn’t seen a window with exterior blinds on it and was giving very poor accuracies in Oviedo, Spain, so we took it on a virtual tour of Madrid, a city with similar features. This boosted its performance for Oviedo and gave the results seen in the paper (link at the end).
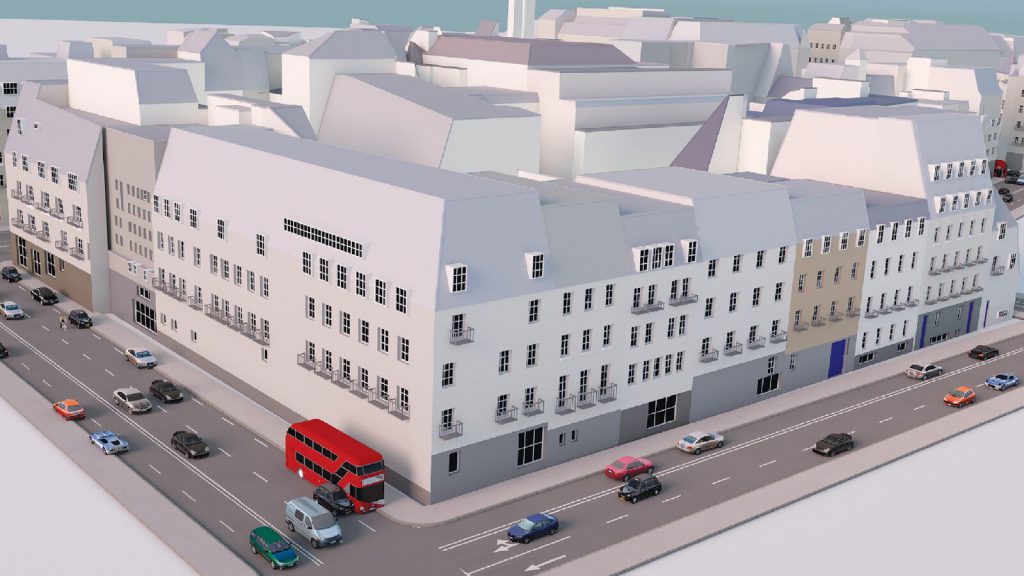
A close-up of the Oxford Circus result.
Fusing Sources
We had several false starts when trying to fuse such a variety of sources. In the end we sought inspiration from earlier work that represented architectural meshes as a set of horizontal building footprints and a vertical set of profiles around these footprints. Given such an output representation, we were able to work backwards towards the inputs, discovering and solving problems along the way.
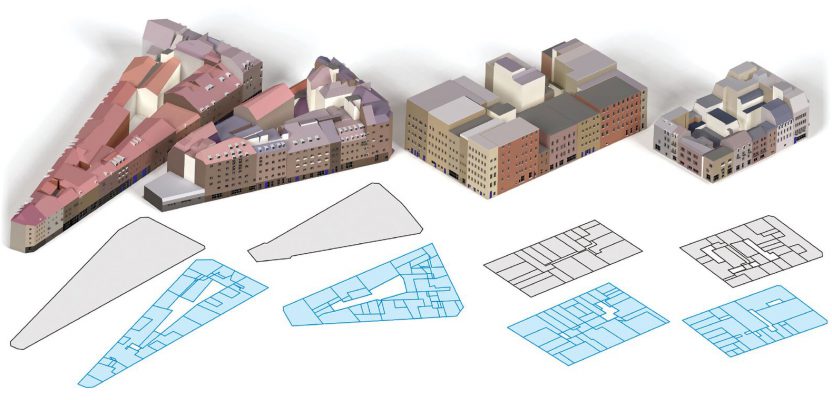
Deconstructing 3D buildings to footprints and profiles was a useful technique because both are simple 2D lines and are easy to work with yet allow you to create intricate buildings with complex roofs. We developed an optimization formulation that analyzes the heterogeneous data sources (i.e., building footprints, coarse meshes, and street-level imagery) and re-targets them to a single consistent representation. By balancing the various retargeting costs, the optimization reaches a consensual structured model, the output of which is the division of a block into footprints, profiles associated with each footprint edge, and façade elements (windows, doors, and balconies) placed appropriately over the mass models.
The final stage is to combine these optimization results for each city block. We extrude each building’s footprint along its profile to create a mass model. The roof and visible wall colors are selected from satellite images and are then decorated with the windows, doors, and balconies found in the images. Each individual building is then combined with the others to form a block.
Because the system is automatic, we can scale it to large areas with minimal human effort; we reconstructed a 37-block region (more than 1,000 individual buildings) around Oxford Circus. We then used road centerlines and a procedural system (Esri’s CityEngine) to create roads between the buildings to finish the visualization.
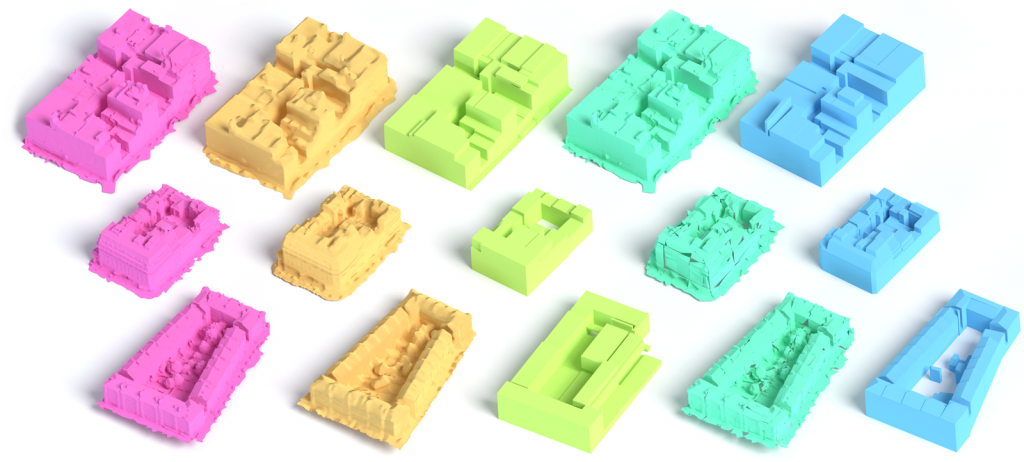
Datasets, left to right: The original mesh, the Poisson reconstruction, a Manhattan box fitting (Li et al. 2016), a structure-aware mesh decimation (Salinas et al. 2015), and our technique.
BigSUR is a research project, and although our source code is available online, there is some way to go before such a technique is fast, accessible, and robust enough for everyone. There are limitations in our understanding of photographs, which should be solved as we collect more data. In addition, our representation is targeted towards traditional buildings—modern freeform structures are not easily represented—but luckily these buildings are not common at the large scales we are interested in.
From an industry perspective, BigSUR is a glimpse of what the remote-sensing pipeline may look like in a few years time.
The technical paper was published at Siggraph Asia last year and is available at here.
Image at top: From left to right, two 3d model blocks from Oviedo, Spain; a block from Manhattan, NY; and Regent Street, London.