Although I’ve been using GIS for more years than I can remember, until xyHt took me out to InterGeo I had never heard of Global Mapper. I thought I’d used every GIS there was; I’ve even used some that only a select few have ever heard of (StruMap anyone?). The market is saturated with GIS, and if I hadn’t heard of it, then it needed investigation. So xyHt set me a mission to find out more.
Blue Marble Geographics, the company behind Global Mapper, was created in 1993. Their first software was a geographic calculator for Windows 3.1. It offered a straightforward toolkit for converting and reprojecting spatial data, and it quickly developed a well earned reputation as an accurate and reliable data-processing solution.
They acquired Global Mapper in 2011 and, over the past years, have been developing and improving it to become the software it is today.
Why am I talking about Blue Marble and not Global Mapper? When I started to investigate further into Global Mapper, I found such a positive company that I had to talk about it. Unlike some of the other GIS companies out there, Blue Marble are entirely customer-focused. The software is developed based on user requirement and not by what they think would be best to use. If there is something in particular that you want, they are not averse to creating “special builds.” It is really refreshing to see.
All this means nothing though if the software doesn’t work, so let’s have a look under the hood.
Under the Hood
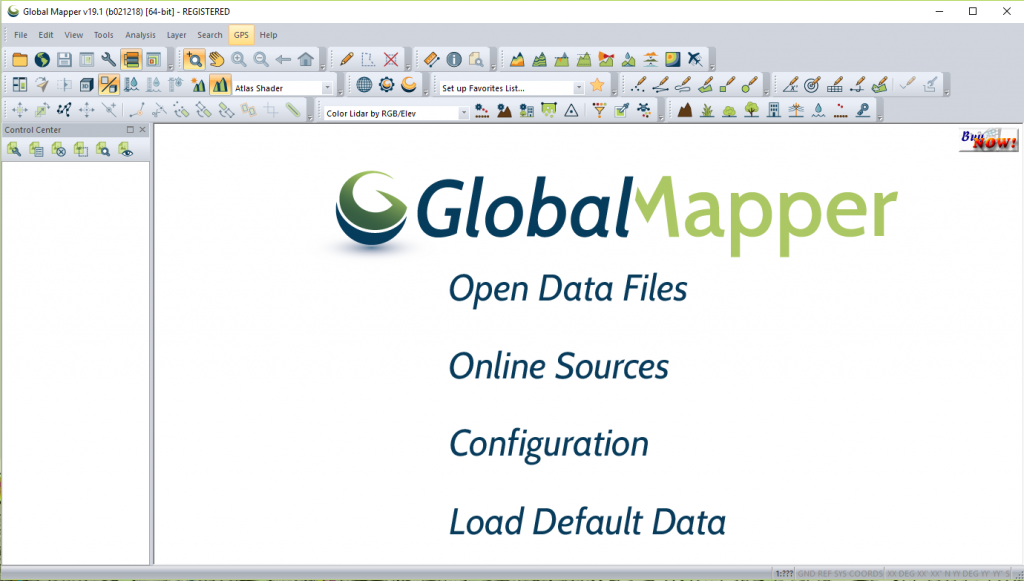 Opening Global Mapper is no different to any other GIS. You are inundated with buttons that are unfamiliar, although, with this particular software they are fairly clean and do not consume more than 40% of the screen space.
For the beginner it is good to see that the main pane gives you your primary needs in big bold text, although I already know that I’ve opened Global Mapper, so the huge header text is a little unnecessary.
Selecting the “Open data files” option provides a big list of available formats; in fact, as a GIS veteran, I was shocked at how many formats there were. Many of them are data types that are not available in the likes of Esri and QGIS. For example, I am unaware of any GIS available today that can open .PLY or geoPDF as standard.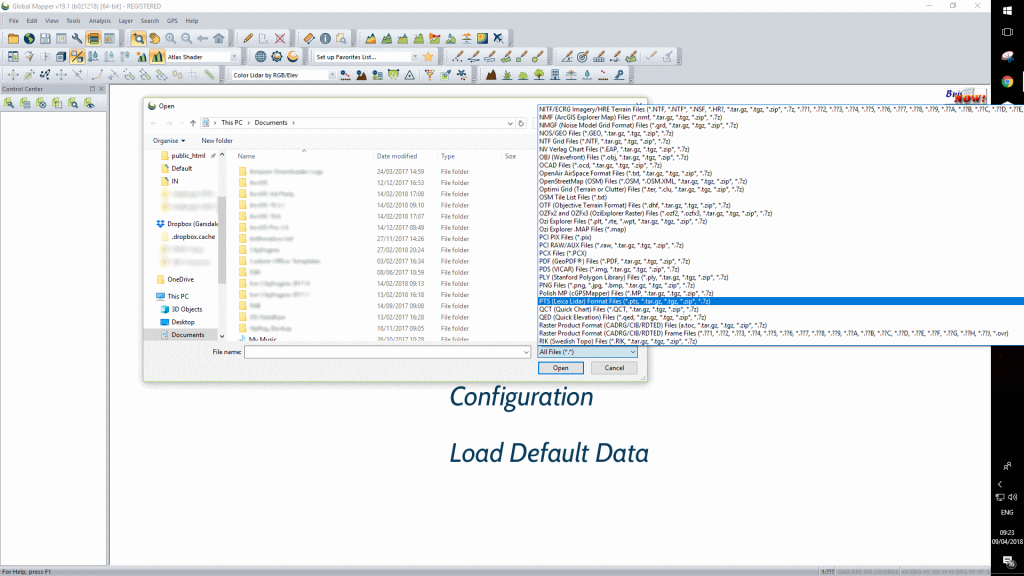
As a rough estimation, I see that there are 110 vector formats, including many that are survey standards (SEGY, PTS, HYPACK LNW/RAW, and others) and 60 raster formats, 75 elevation formats, eight 3D data formats, including .SKP, OBJ & .FBX. Then you have, if that wasn’t enough, 10 spatial database formats. It is absolutely incredible and something I was completely unprepared for. To test just a small section of these would have taken more time than I could afford, so the testing was kept to 3D Esri multipatch geodatabase vector data, shapefile vector data, .TIF format raster data, and .LAZ lidar data.
Loading the 2D vector data was easy and quick, drawing up as expected with no problems. I found that coloring, or symbolizing the data, was a little trickier. For symbolizing data, most GIS users would expect to click on the symbol in the table of contents or click on the layer properties, but in this software things aren’t so simple.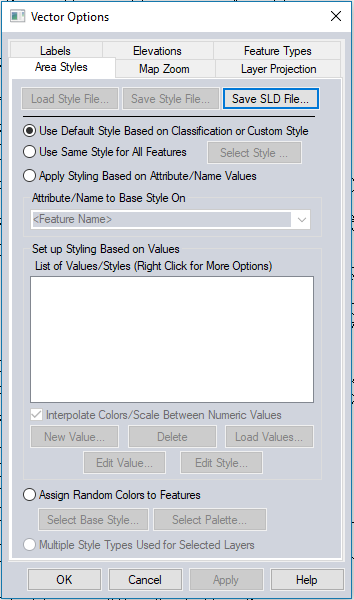
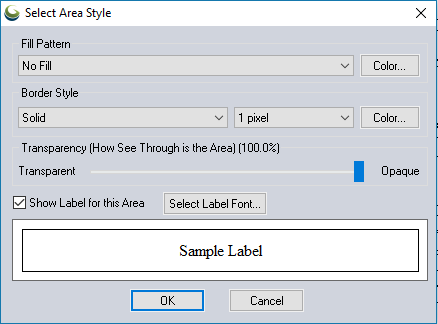
The first image “vector options” doesn’t make it clear that the “area styles” tab is for the altering symbols and colors. It is also confusing when you want to do a chloropleth or other ramped color scheme. When you pick an option for colorizing your feature, the “select area style” window comes up, and this seems quick, barren, and simple. As a cartographer, I am a little disappointed as I’d love to have some of the label controls or effects you get with some of the other GIS.
Bringing in 3D multipatch data was a little tricky, whereas adding the shapefile was as simple as selecting the file type and hitting “add data.” Using the add data from a spatial database option failed to bring in the data, but when I tried to add it by the “open file directory” option, it loaded fine.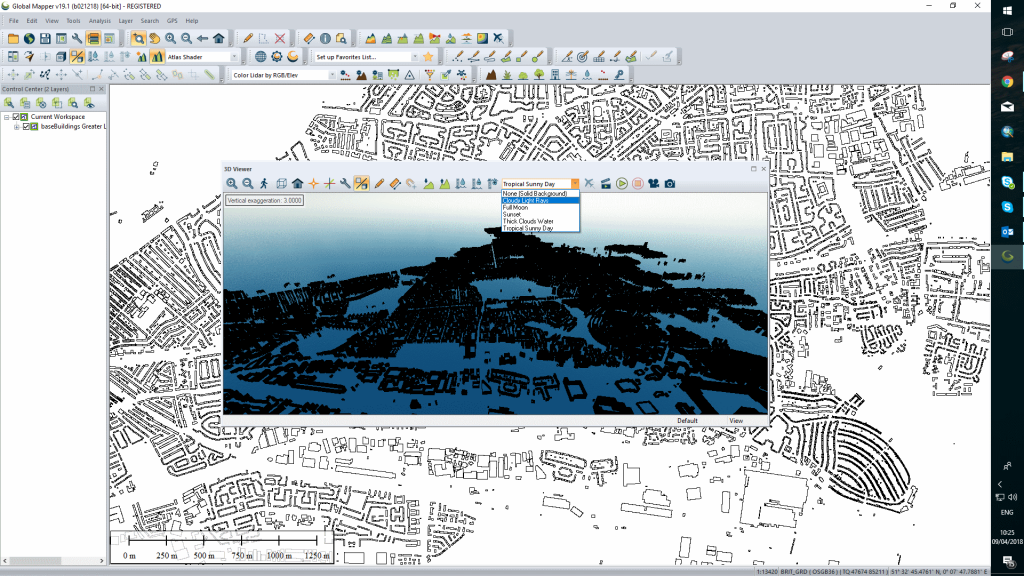
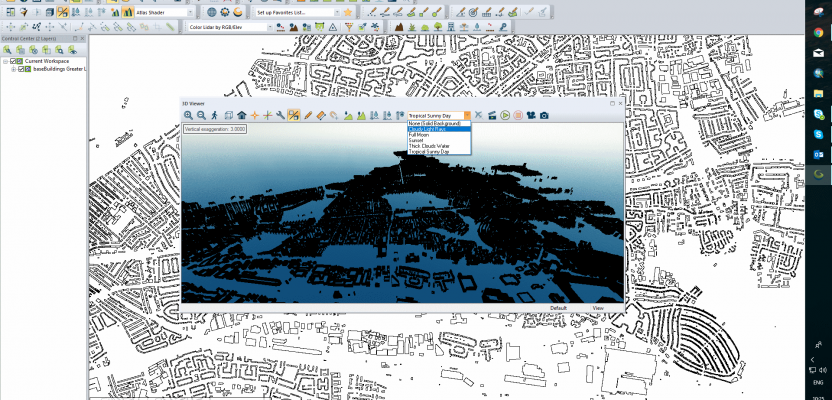
3D data is served through an extra window and has a button located under the main map frame’s “view” tab. There are a fair few options for rendering backgrounds, but lighting and shadow options are not present. For the screenshot above, I loaded three boroughs of Greater London which was LOD1 (extruded footprints). Although this was a little slow, there were no crashes or hanging which I have seen with other software.
Loading the lidar data was fast and efficient. I loaded two sq km of 1m spaced lidar made of about 30 tiles, and it was like lightning, so much so that I tried again with the data in LAZ format.
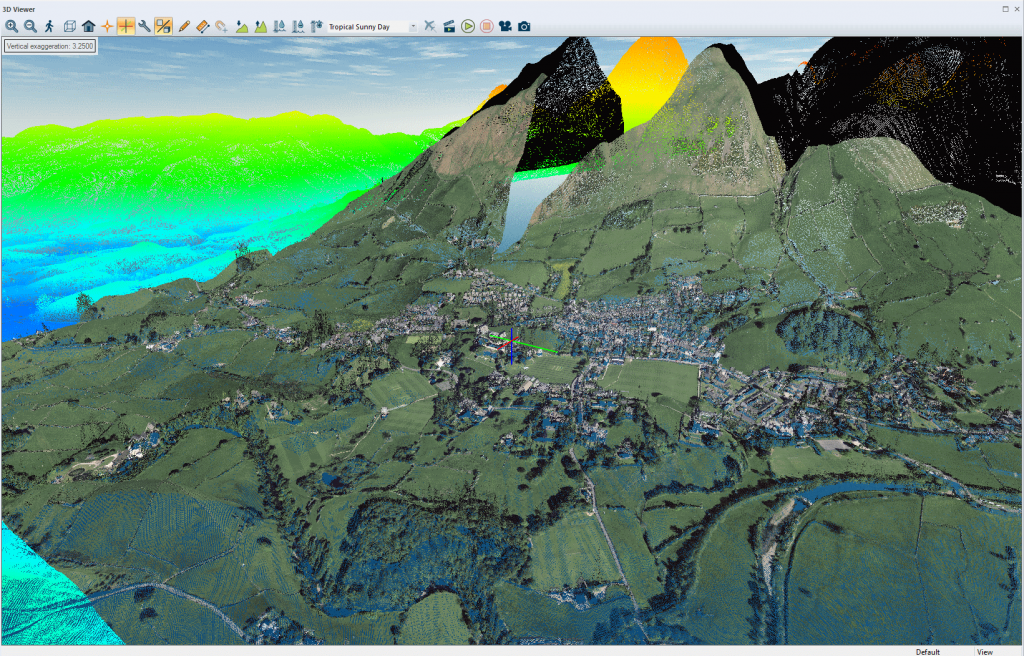
Clicking on the 3D view, the data draws quickly and with great resolution, bringing in what it needs as you zoom in and out without being too hard on the computer CPU or memory.
Although there aren’t many tools for using vector, just the usual join tables, viewshed, buffer tools amongst a few, there are lots of imagery and lidar tools, some that I hadn’t ever seen but realized after using them that I need them in my life.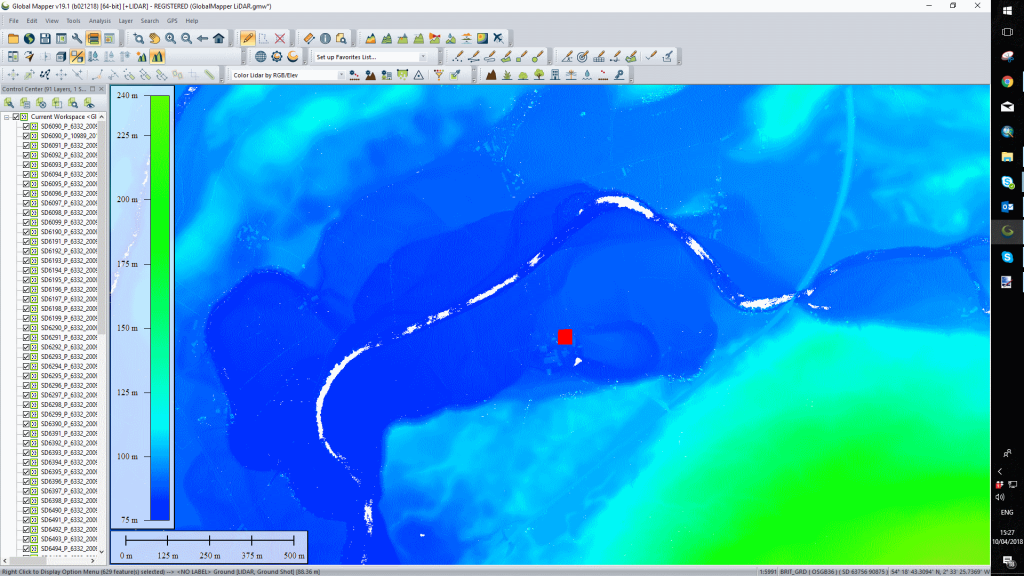
Let’s have a look at a couple of these tools.
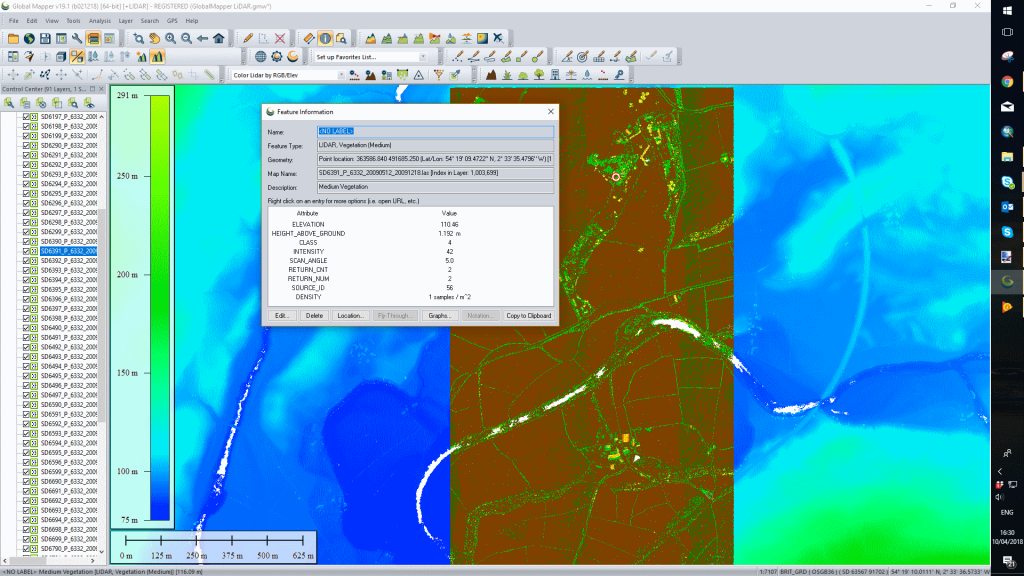
Classify Lidar
So what does this do? In short, you select an area of your lidar and you can classify it. This is something that is invaluable when dealing with unclassified data.
Although I found it difficult to find the select tool, once I had, it was really easy to marquee select small areas and hit the classify button. In the example above, I was able to classify the buildings from my unclassified data extremely quickly.
The only downfall was that I could only select using the rectangular selection method; for complex building polygons and trees it was very time consuming.
Auto Classify Non Ground Points
Yes, with this tool the software reads your unclassified data and will automatically classify the data based on its calculations. More interestingly, you can choose to classify pylons and overhead lines, too. Having tried this on a couple of data, I can say that this was pretty good, not always 100% for the data I had but it was near to 90% at worst. Considering the data was completely unclassified at the start, I was more than happy with it!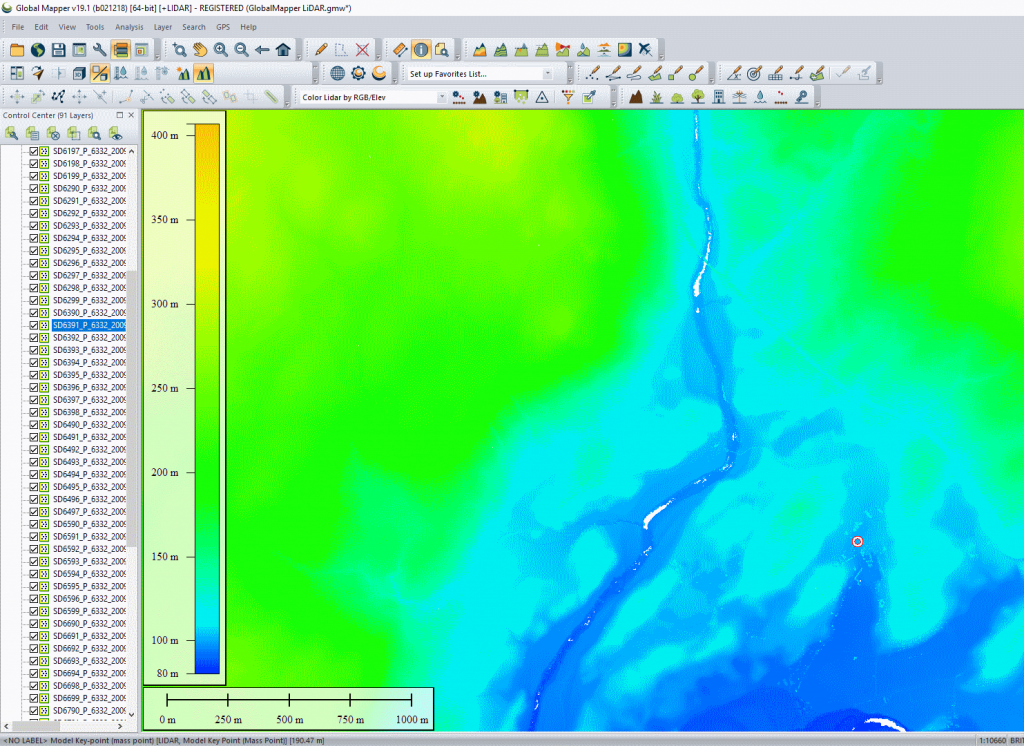
Coloring Lidar from Imagery
The last tool I want to talk about, and it was difficult for me to keep to just three, is the coloring lidar from imagery tool. Never in my years using lidar data have I seen a tool whereby you can take imagery and simply overlay it on the lidar points to colorize it. But here it is and it is quick.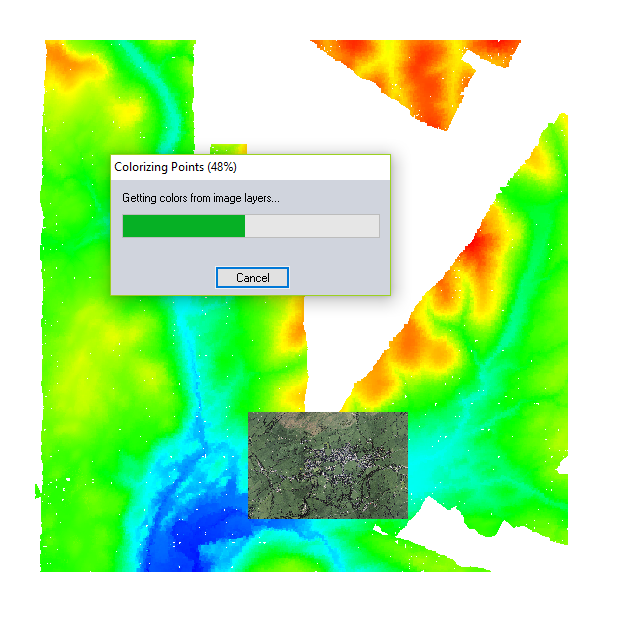 Using the data that I was already using, I brought in some 25cm imagery into the data frame, and the tool allows you to simple colorize the data using imagery data in the table of contents. I didn’t even need to specify bounds or how to interpolate the data; it was all on one simple click. The output was suitably impressive too. Zooming in showed that all the points were colorized. There didn’t appear to be any missing colors, and furthermore there was no slowdown using this data through the 3D data frame; conversion of the data took less than a minute.
Summary
When you realize that lidar and imagery is where this software shines, it is a pleasure to use. There are tools here that you don’t see in many proprietary offerings costing three or four times the price. Although the interfaces and menus could do with a little tweak, there are some amazing tools that are worth the money alone.
The bonus is that Blue Marble is open to improvement and is so positive.