Thermal imagery helps reveal building heat loss
Dr. Geoffrey Hay envisioned a solution for an invisible problem in a few milliseconds.
Hay, a GIScience professor at the University of Calgary in Alberta, Canada, was perplexed by his higher-than-expected heat bills after moving into his new, modern home that was equipped with “energy-efficient everything.” It was clear that his home was leaking energy, but the “how?” and “where?” Hay wished he could see the heat loss to stop the energy waste. Then he started “tingling” with the realization that he had the geoscience knowledge
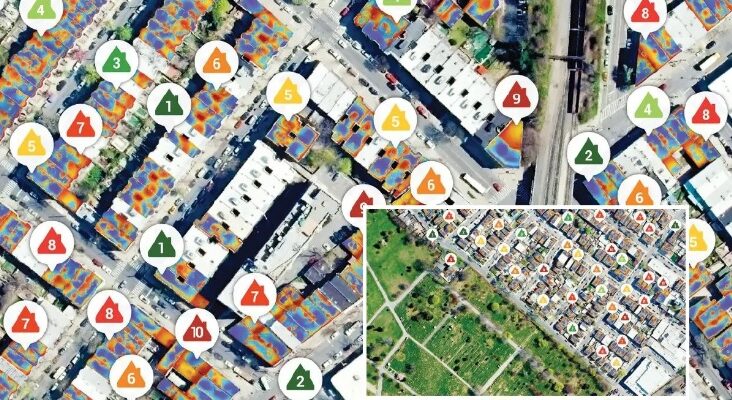
A map of heat-loss ratings in a New York neighborhood. The higher the number, the higher the heat loss. All images provided by MyHEAT.
to make the invisible visible.
The solution? Aerial surveys over rooftops using a very high-resolution thermal infrared (TIR) sensor.
“I knew that if I could visibly source where my house was losing heat, I would do something to fix the problem,” says Hay, co-founder and chief science officer of Calgary-based MyHEAT, a company that provides energy maps and interactive tools to improve building efficiency and reduce energy consumption. “I also felt that if other people knew their homes were wasting energy, and we could show them where and make it simple for them to do something about it, then they would do something about it, too.”
Hay’s initial hunch was right.
In 2014, after years of intense, award-winning research, MyHEAT became a reality. And its invisible energy solutions have been helping millions of homeowners make their homes more energy efficient, save money, and reduce urban greenhouse gas emissions.
Powered by high-resolution TIR imagery, powerful Geographic Object-Based Image Analysis (GEOBIA), and machine learning, MyHEAT provides utility companies and their customers with targeted platforms to detect, map, and monitor invisible energy waste––knowledge that enables them to better understand their energy loss and the available options to address it. It’s holistic, yet specific detail energy providers haven’t seen before and it’s the energy connection MyHEAT hopes will help empower a worldwide reduction in urban greenhouse gas emissions––one building at a time.
A cool way to curb consumption
From the outset, MyHEAT’s goal was to offer easy-to-use and insightful heat-loss maps that would not only tell a clear story about energy loss, they would provide the awareness to start a conversation about urban energy efficiency.
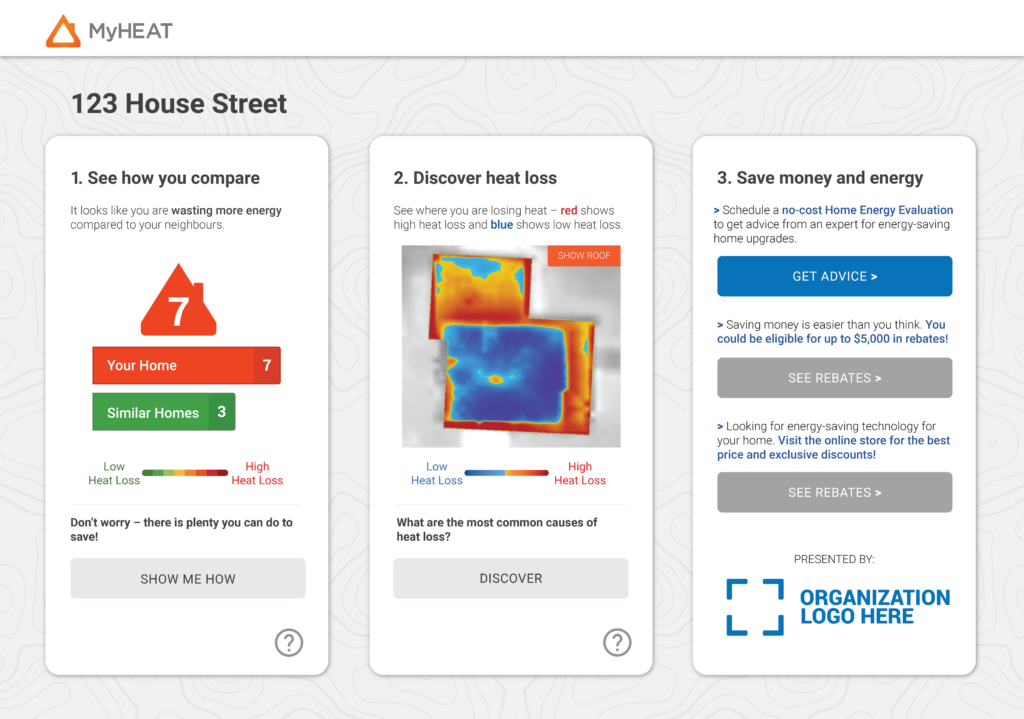
With MyHEAT’s customer-facing platform, customers can view the color-coded heat map of their own home, how it compares to homes in their neighborhood, and choose energy-saving options.
“In creating MyHEAT, we had two goals: get people thinking about home efficiency and help them take action,” says Darren Jones, the company’s CEO and co-founder. “The first step is to get people to look at their house. To do that we have to produce accurate heat-loss maps and interactive platforms that enable utilities to encourage customer behavioral change in order to advance their energy efficiency objectives.”
To develop its heat-loss maps, MyHEAT needed a consistent, sensitive TIR sensor that would provide large-area coverage, rapid data collection, accurate hotspot detection, precise hotspot positioning, and efficient field product turn-around.
Based on those needs, the company chose airborne thermal imaging technology from Calgary-based ITRES Research, a pioneer in the development and manufacture of advanced airborne hyperspectral and thermal imaging sensors for use in a wide range of commercial and scientific remote sensing applications.
“One of the significant features of the ITRES technology is that its thermal sensor uses a cryo-cooled Mercury-Cadmium-Telluride (MCT) detector, which not only allows us to precisely discern temperature differences as low as one-tenth of a degree, it enables us to collect data four times faster than uncooled TIR sensors,” says Jones. “With its 40-degree field of view and 1,800-pixel imaging swath, we can collect up to 240 square kilometers (93 square miles) per hour at one-meter spatial resolution. That gives us the speed to acquire data at city scales in two to four nights, weather depending. The thermal sensitivity, stability, and detail provides us with consistently reliable imagery, which is essential for producing accurate energy-waste maps for an individual residence.”
 Once the high-resolution thermal data is collected for a particular area of interest or an entire city, it is then transformed using MyHEAT’s proprietary GEOBIA and machine learning techniques and third-party datasets to reveal building heat loss and comparable efficiency metrics for neighborhoods across an area of interest or city.
Since successfully mapping energy waste over several 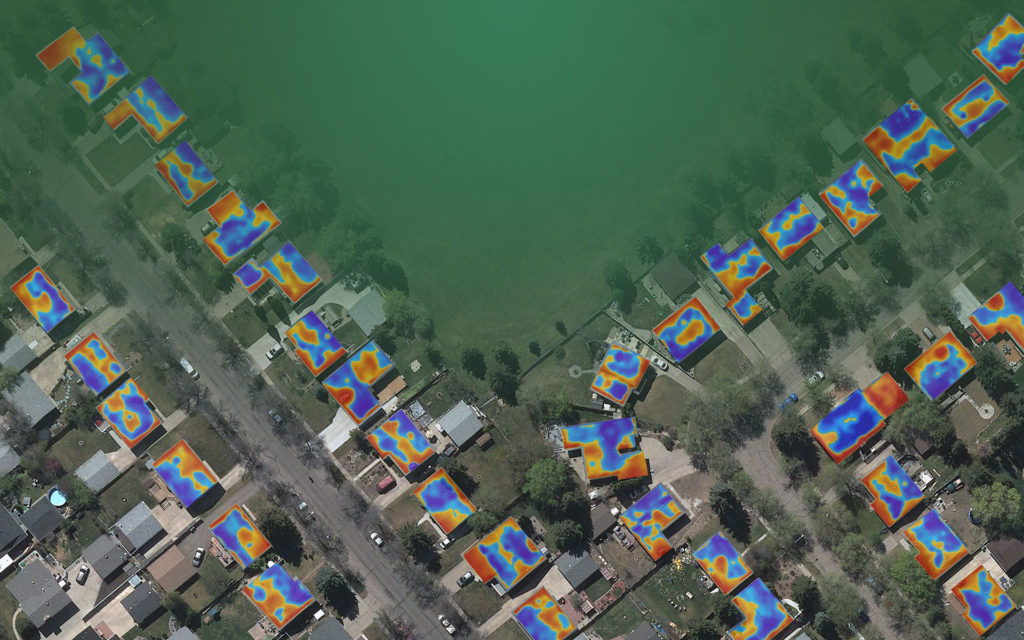 Albertan cities, MyHEAT’s proven solution has become an attractive business offering for energy providers across Canada and the United States.
“Utilities in Canada and the U.S. are mandated by the utility regulators in each province or state to help their customers save energy and set climate-related goals to reduce emissions from energy consumption,” says James Henry, MyHEAT’s director of growth and sustainability. “Our solution helps them understand what the opportunities are for meeting these goals in their service area. With our platform, they can immediately see energy consumption and loss and capitalize on the marketing opportunity to deliver information to individual homeowners in a personalized way and prompt them to take action by enrolling in one of the utilities’ programs.”
Understanding and developing targeted opportunities for curbing consumption while maximizing existing infrastructure was the spark that drove one leading U.S. energy provider to MyHEAT’s heat loss platform last fall.
New Approach to New Constraints
Serving more than 20 million people throughout New York and Massachusetts, this energy company, like many energy providers, has been facing increasing demands on its system while striving to meet ambitious greenhouse gas emissions goals.
In 2020, the company began looking for solutions to both address a forecasted demand-supply gap and meet its regulatory requirements for energy efficiency. One particularly attractive option was weatherization––enhancing thermal building envelopes with home improvements, such as better insulation, ventilation, and windows. As a weatherization program would be a new offering, the company chose to partner with MyHEAT and take a new, creative approach to designing and marketing the program to residential customers.
“With our platform they could zone in on customers with the most need to weatherize their home, and then create targeted interventions to increase their participation in the program,” says Henry.
Collecting Heat
MyHEAT collected aerial thermal imagery in December and January of 2021 and 2022, using the ITRES pushframe thermal sensor mounted in a fixed-wing aircraft.
On cool, dry, and clear evenings, a crew flew over the areas of interest to the utility, measuring the thermal emissions from all objects in the sensor’s path at a rate of 90 frames per second. With the aid of ITRES’ real-time display, the on-board technician could monitor the instrument signal and data quality in flight.
“The sensor offers a wide pixel resolution range from 10 centimeters to 1.25 meters,” says Jones. “That gives us great latitude to determine the best parameters for collecting data at the best resolution, the best time of the season, and the best time of night.”
After data acquisition, an ITRES team processed the raw sensor data to generate geometrically precise, orthorectified images. MyHEAT teams then analyzed and classified the orthorectified data to map each of the area’s energy waste.
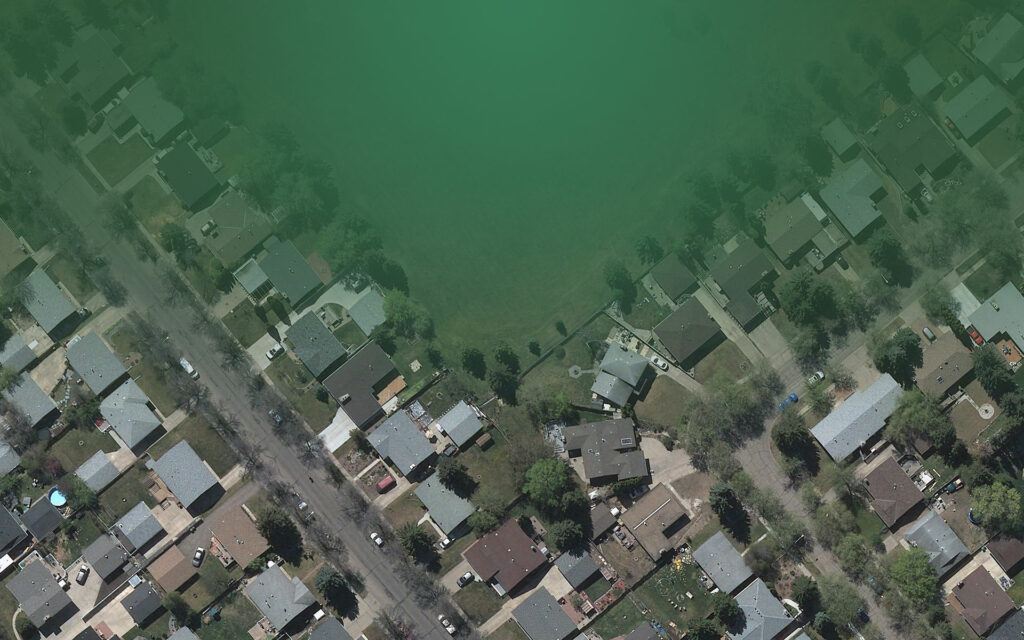
Using sophisticated, proprietary machine-learning algorithms, the MyHEAT software first analyzed the thermal imagery to distinguish buildings from other features such as vegetation, roads, and rivers. Among those buildings, it then discerned residential buildings from commercial and industrial ones, and then further delineated single-family homes from multi-family, townhouses, row houses, and condos.
With residential buildings identified, pseudo-colored heat-loss maps of each individual home were developed––red spots indicating significant heat loss; blue indicating little. Along with the map, they derived a heat rating of one to 10, which offers a relative measure of how much heat a building is losing compared to similar buildings in the neighborhood or region––the higher the number, the higher the heat loss.
“With these maps, our energy client can view its entire distribution system in color-coded heat maps,” says Henry. “The maps and heat ratings highlight where the greatest impact for energy reduction can be made. They can add income levels, age of occupants, age of homes, and consumption data to really target specific neighborhoods and homeowners for energy-efficient opportunities. That tailored approach is far more effective than the traditional ‘everyone gets a rebate’ format.”
Weatherizing for Lower Emissions
In August 2022, MyHEAT delivered a database of address-matched heat-loss images and heat ratings, and an internal map-based platform driven by the Google Maps API. The internal platform allows the energy provider to readily visualize heat loss across its entire area of interest and zoom into any cluster of homes for more detail. That insight provides accurate business intelligence to devise customer-centric, energy-saving offerings.
Last fall, MyHEAT delivered the final piece of the solution: the customer-facing platform. Based on targeted marketing campaigns, this system provides customers with a personalized link to view the color-coded heat map of their own home and their heat rating and how that compares to other homes in their neighborhood. Along with the rooftop view of their home, customers can use a diagnostic tool to better determine and infer what they’re seeing from the heat-loss map. By answering questions about where specifically they see red hotspots or bands, the system surmises the type of heat loss the customer has––insufficient insulation, leaky chimney, or inefficient windows––and then directs them to heat-saving weatherizing options offered by the company.
Offering simpler, lower-cost repair work is not only a cost-effective incentive for homeowners, it stands to significantly help ease the burden on the provider’s existing infrastructure and reduce downstream energy demands.
As the path to urban energy efficiency is often powered by conversation, awareness, and small acts, visualizing an invisible problem is an energizing prospect––for energy companies, homeowners, and for the planet. It may also move the needle toward MyHEAT’s goal of reaching worldwide reductions in urban greenhouse gas emissions one building at a time.