The scale and projection dilemma for long project corridors is addressed by an academic-private partnership from the UK.
Editor’s Note: What are the best practices for dealing with scale and projection over very long project corridors? That can depend on whom you talk to and how much they have been burned by the approaches they have used in the past: single projection, multiple projections, multiple low distortion projections (LPDs), transitions and equation stations, even no projection—each has its own pitfalls. We present for your consideration a groundbreaking solution from the United Kingdom, born of a partnership between a respected academic geodesy program and an innovative private firm. Meet SnakeGrid.
The UK rail network is the oldest in the world, dating back to the early 19th century. Many of the rail routes in use today were built in the 19th and early 20th centuries, designed for the steam locomotives of the era. Fast-forward to the 21st century, and these routes are running trains up to 125 mph at near to 90% route capacity. Increasing demand on these historic routes means running larger trains and more of them. The only way to run more trains in a set amount of time on a fixed route is to run trains closer together and at higher speeds.
There are many challenges involved with maintaining an historical rail network that is running at near-full capacity. Constructed in a time without the technology available today, the rail corridors thread their way around undulating hillsides and through tunnels constructed with smaller and slower-rolling stock in mind. The routes are often tight and sinuous, requiring carefully maintained curves and transitions that lie on beds of stone ballast, the foundation system used over 100 years ago. The curves and transitions constantly move on the ballast bed, requiring maintenance to re-set the track alignment back to its design position.
Legacy Methods
There are many techniques for measuring track geometry, most of which rely on relative measurements of the cant (tilt), gauge, and offsets from known datum points (often datum plates showing design values and offsets). In order for these systems to work on multiple projects simultaneously, some form of greater framework needs to be in place, usually in the form of a track alignment survey (TAS).Typically a TAS would be localized to a stretch of track requiring maintenance, extending beyond the maintenance area into track where no engineering works are planned, allowing a “through alignment design” (TAD) to seamlessly transition from existing track into new track alignment and back again. Historically these TAS have been commissioned on a project-to-project basis on localized survey grids fit for the purpose of the current project only. These would typically consist of either a simple braced traverse run for sites of up to approximately half a mile or, for larger sites, an open traverse braced with GNSS.
 The GNSS observations would be converted to grid coordinates using either the national mapping grid (OSGB36) with a localized scale factor correction or, for larger projects, a custom projection aligned to the rail corridor. Rail corridors are typically linear and sinuous in shape and are often best suited to a transverse or oblique Mercator-type projection, depending on the orientation of the route.
As projects increase beyond a few miles, the curvature of the Earth needs to be recognized and dealt with, typically using localized scale factors in “zones” of approximately 10km. These standard projection techniques typically use either straight or circular central trend lines of a constant height, at which point the scale factor is zero.
However, rail routes are very rarely perfectly straight or curved for a great distance and, as such, will diverge from the central trend line very quickly, leading to changing scale factors over relatively short distances, in turn requiring smaller zones to mitigate the distortion. The limitations of this approach become apparent when designing alignments across zone boundaries and extending survey sites outside the original area the projection was designed for.
The standard accuracy requirement for surveying of track alignment on the UK rail network is +/-5mm, which is easily achievable internally within a project and just as easily lost when stepping between survey zones and grids.
This project-by-project approach inevitably leads to surveying from the “part to the whole,” where existing surveys are extrapolated out and bolted on to existing data sets to suit the needs of the larger picture. This is the opposite of what any competent surveyor would tell you is best practice. Instead, it requires a solution that can encompass the whole picture: one engineering-grade survey grid that can serve an entire rail route, maintaining as close to unity scale factor as possible.
The solution lies in a customized projection optimized for linear surveys, where the projection trend line is computed as a sinuous polynomial line that closely tracks the route of interest in both plan and height. One such solution is the SnakeGrid (www.snakegrid.org), designed by Dr. Jonathan Iliffe and a team at University College London, Department of Civil, Environmental, and Geomatic Engineering.
Application Example
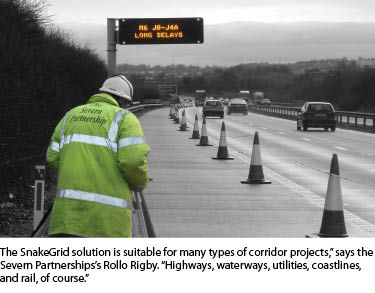
The SnakeGrid solution has been implemented by The Severn Partnership Ltd on numerous UK rail corridors, most notably the East Coast, Great Western, and Midland mainlines on behalf of Network Rail (the company maintaining Britain’s rail tracks). Other SnakeGrids have been commissioned by The Severn Partnership independently of Network Rail on projects requiring multiple survey sites along rail corridors, as the project benefits far outweigh the initial expenditure. Snake-Grid has now been adopted by Network Rail on all primary mainline routes as well as other standalone routes for major projects such as CrossRail through (and under) London.
 An example of the successful application of a SnakeGrid by The Severn Partnership is in Ireland between Dublin and Cork, a mainline rail route 267 kilometers (~166 miles) long. The Severn Partnership’s role was to provide an engineering-grade mapping grid for the entire rail route along with 12 primary control pairs, 53 secondary control pairs, and over 400 photo control points (PCPs) for an aerial mapping campaign.
A series of ground truth surveys were carried out at set intervals along the route in addition to any areas obstructed from sky view, such as tunnels and densely wooded areas. These were used to assess the accuracy achieved from the aerial mapping campaign.
In order to commission a SnakeGrid, a set of seed points are required that define the route at intervals of roughly two to three kilometers. These seed points need to be in the WGS84 coordinate system (or one that has a known set of transformation parameters to the WGS84 system), and heights need to be relative to the ellipsoid.
With this set of seed points the team can best fit a polynomial line in plan and height that meets the projection software’s criteria for minimum curvature. Although the seed points were provided in 3D, the height element of the seed points is used only to calculate how far above the ellipsoid the route is so that the trend line can take this into account, as it will have an effect on the 2D projected position of a point. Once that’s complete, a set of parameters are produced that can be uploaded into the SnakeGrid software that will project WGS84 coordinates to grid coordinates.
On completion of the GNSS campaign, all WGS84 coordinates, based on the ETRS89 datum using the OSI CORS network, were converted through SnakeGrid onto the site grid. With no grid zones or scale factors to manage, it was possible to move quickly onto the reduction of local traverse runs where topographic detail had been surveyed.
A combination of techniques were employed to obtain the orthometric level value for a point. Initial level values for the GNSS coordinates were calculated using the local geoid model, OSGM02, to calculate the geoid-to-spheroid separation. A double level run was also completed for the full 267 kilometers of the route incorporating all primary and secondary control to derive local levelled heights, which were then combined with GNSS-derived heights to ascertain final values.
With a final control network in place and ground truth surveys completed, it was a very quick process to combine the ground survey data with the aerial photogrammetry into one homogenous data set. The aim of the project was to achieve aerial mapping accuracies of +/-40mm, at the very limit of what was possible at the time. The project successfully met its objectives and delivered a complete mapping dataset on one survey grid for the full 267 kilometers.
 The snakegrid projection for the Dublin to Cork project was tested at 152 locations along the rail corridor, checking for scale factor variations. The worst case scenario was found to be 9.7 parts per million (ppm), less than half the 20ppm target value. In past projects it would be common to have the aerial dataset computed to the national mapping grid or a custom projection optimized for the mapping route. The ground survey would be completed on a separate engineering grid with a scale factor of 1:1, with the two data sets often being treated as separate entities combined using best fit transformations.
Using SnakeGrid allows the aerial mapping the same level of consistency as the ground survey, making combining the datasets a straightforward process. A mapping grid that is compatible with GNSS surveying techniques allows easy database updating in future projects, maximizing its value as an asset to the owner.
Hidden Benefits
The concept of scale factor distortion with distance away from the central trend line is relatively simple to visualize; however, SnakeGrid also mitigates changes in elevation along the survey corridor. Changes in elevation have a greater impact on scale factor variations because they directly affect the change in height above the ellipsoid compared with increasing plan distance from the trend line.
The rate of distortion in scale factor will be 1ppm for every 6.4 meters difference in height from the trend line and 0.5ppm for every 1 kilometer in plan away from the trend line. As changes in height impose greater changes in scale factor, it follows that changes in the elevation of land surrounding the trend line will dictate how far it is possible to move away from the route and remain within the required ppm error budget. Distance from the trend line in plan and height will have a cumulative effect on the error budget.
Depending on accuracy requirements, it is possible for a SnakeGrid projection to be used several kilometers away from the rail corridor it has been designed for, allowing wider mapping to be incorporated relatively easily into a project. Having a single survey grid fit for use from engineering to asset management can greatly simplify database management tasks and remove many potential sources of error through changing between survey grids.
Where a SnakeGrid doesn’t cover a wide enough area for a project, it is possible to add an additional branch onto the grid. In railway terms it is common for branch lines to diverge away from the main route to less central regions. At the diverging point you can fix the coordinates of the branch to exactly match the existing grid. The coordinates in both projections will match to a few millimeters for the first few kilometers along each route. Using the same process you can fix the coordinates at any point along a SnakeGrid route such that it can match a legacy dataset, if required.
Sidebar: Practical Demonstrations
Surveying and geodesy educators have employed many creative visual tools to demonstrate how the different standard projection approaches work. To demonstrate a Lambert Conformal Projection, place a paper cone over a classroom globe so that it makes contact with the area of interest, showing where the cone might intersect a state or zone of a state. Then cut the cone vertically and spread it flat to show that this type of projection deals with curvature and convergence of meridian. The same can be done with cylinders of paper for transverse and even oblique projections.
How does a SnakeGrid work? Think of an apple peel, sliced thinly off the curved and undulating surface of the Earth, then flattened out with a grid projected on it. The scale varies along a trend line with the alignment and height.
Future Benefits
The need for survey grids directly compatible with GNSS positioning will become ever more important. Sub-decimeter stand-alone positioning is not far away, with centimeter-level real-time network solutions already common place. Having a survey grid that can provide the engineering level of accuracy required while also allowing GNSS-derived coordinates to seamlessly integrate will maximize the value of the collected data. The database becomes an asset to be managed, reducing costly re-surveying of areas for different purposes. Multiple projects running simultaneously can benefit each other by using the same survey language, sharing data, and ensuring designs are compatible.
Problems to Be Solved
SnakeGrid has effectively removed a limiting factor from establishing large-scale survey grids on long linear projects. The limiting factor now is the positioning technology available and its repeatability should survey control need to be re-instated.
This leads to a new argument of what defines the coordinate system. Although site coordinates can be derived directly from any GNSS system, the accuracy of GNSS is lower than that of the projection being used. Therefore, should a primary control network be in place for the entire rail route, coordinated as a single homogenous network to act as a reference frame from which any future control is coordinated? With GNSS hardware and processing technology still progressing rapidly it is likely that coordinates derived for a single point within a given SnakeGrid will differ year by year depending on what GNSS constellations are used and what processing parameters are applied in the background.
In order to achieve the measurement repeatability required in the UK rail industry it will be necessary to document not only the grid coordinates for survey control but also the measured WGS84 coordinates of the point, which datum they relate to, and the method in which they were derived. Background knowledge of geodesy is becoming increasingly important as GNSS techniques improve.